Malcolm is a powerful network
traffic analysis tool suite designed with the following goals in mind:
- Easy to use– Malcolm accepts network traffic data in the form of full packet capture (PCAP) files and Zeek (formerly Bro) logs. These artifacts can be uploaded via a simple browser-based interface or captured live and forwarded to Malcolm using lightweight forwarders. In either case, the data is automatically normalized, enriched, and correlated for analysis.
- Powerful traffic analysis– Visibility into network communications is provided through two intuitive interfaces: Kibana, a flexible data visualization plugin with dozens of prebuilt dashboards providing an at-a-glance overview of network protocols; and Moloch, a powerful tool for finding and identifying the network sessions comprising suspected security incidents.
- Streamlined deployment– Malcolm operates as a cluster of Docker containers, isolated sandboxes which each serve a dedicated function of the system. This Docker-based deployment model, combined with a few simple scripts for setup and run-time management, makes Malcolm suitable to be deployed quickly across a variety of platforms and use cases, whether it be for long-term deployment on a Linux server in a security operations center (SOC) or for incident response on a Macbook for an individual engagement.
- Secure communications– All communications with Malcolm, both from the user interface and from remote log forwarders, are secured with industry standard encryption protocols.
- Permissive license– Malcolm is comprised of several widely used open source tools, making it an attractive alternative to security solutions requiring paid licenses.
- Expanding control systems visibility– While Malcolm is great for general-purpose network traffic analysis, its creators see a particular need in the community for tools providing insight into protocols used in industrial control systems (ICS) environments. Ongoing Malcolm development will aim to provide additional parsers for common ICS protocols.
Although all of the open source tools which make up Malcolm are already available and in general use, Malcolm provides a framework of interconnectivity which makes it greater than the sum of its parts. And while there are many other network traffic analysis solutions out there, ranging from complete Linux distributions like Security Onion to licensed products like Splunk Enterprise Security, the creators of Malcolm feel its easy deployment and robust combination of tools fill a void in the network security space that will make network traffic analysis accessible to many in both the public and private sectors as well as individual enthusiasts.
In short, Malcolm provides an easily deployable network analysis tool suite for full packet capture artifacts (PCAP files) and Zeek logs. While Internet access is required to build it, it is not required at runtime.
Quick startGetting MalcolmFor a
TL;DR example of downloading, configuring, and running Malcolm on a Linux platform, see
Installation example using Ubuntu 18.04 LTS.
Source codeThe files required to build and run Malcolm are available on the
Idaho National Lab's GitHub page. Malcolm's source code is released under the terms of a permissive open source software license (see see
License.txt for the terms of its release).
Building Malcolm from scratchThe
build.sh script can Malcolm's Docker from scratch. See
Building from source for more information.
Pull Malcolm's Docker imagesMalcolm's Docker images are periodically built and hosted on
Docker Hub. If you already have
Docker and
Docker Compose, these prebuilt images can be pulled by navigating into the Malcolm directory (containing the
docker-compose.yml file) and running
docker-compose pull like this:
$ docker-compose pull
Pulling elasticsearch ... done
Pulling kibana        ... done
Pulling elastalert    ... done
Pulling curator       ... done
Pulling logstash      ... done
Pulling filebeat      ... done
Pulling moloch        ... done
Pulling file-monitor  ... done
Pulling pcap-capture  ... done
Pulling upload        ... done
Pulling htadmin       ... done
Pulling nginx-proxy   ... done
You can then observe that the images have been retrieved by running
docker images:
$ docker images
REPOSITORY                                          TAG                 IMAGE ID            CREATED             SIZE
malcolmnetsec/moloch                                1.4.0               xxxxxxxxxxxx        27 minutes ago      517MB
malcolmnetsec/htadmin                               1.4.0               xxxxxxxxxxxx        2 hours ago         180MB
malcolmnetsec/nginx-proxy                           1.4.0               xxxxxxxxxxxx        4 hours ago         53MB
malcolmnetsec/file-upload                           1.4.0               xxxxxxxxxxxx        24 hours ago        198MB
malcolmnetsec/pcap-capture                          1.4.0               xxxxxxxxxxxx        24 hours ago        111MB
malcolmnetsec/file-monitor                          1.4.0               xxxxxxxxxxxx        24 hours ago        355MB
malcolmnetsec/logstash-oss                          1.4.0               xxxxxxxxxxxx        25 hours ago        1.2   4GB
malcolmnetsec/curator                               1.4.0               xxxxxxxxxxxx        25 hours ago        303MB
malcolmnetsec/kibana-oss                            1.4.0               xxxxxxxxxxxx        33 hours ago        944MB
malcolmnetsec/filebeat-oss                          1.4.0               xxxxxxxxxxxx        11 days ago         459MB
malcolmnetsec/elastalert                            1.4.0               xxxxxxxxxxxx        11 days ago         276MB
docker.elastic.co/elasticsearch/elasticsearch-oss   6.8.1               xxxxxxxxxxxx        5 weeks ago         769MB
You must run
auth_setup.sh prior to running
docker-compose pull. You should also ensure your system configuration and
docker-compose.yml settings are tuned by running
./scripts/install.py or
./scripts/install.py --configure (see
System configuration and tuning).
Import from pre-packaged tarballsOnce built, the
malcolm_appliance_packager.sh script can be used to create pre-packaged Malcolm tarballs for import on another machine. See
Pre-Packaged Installation Files for more information.
Starting and stopping MalcolmUse the scripts in the
scripts/ directory to start and stop Malcolm, view debug logs of a currently running instance, wipe the database and restore Malcolm to a fresh state, etc.
User interfaceA few minutes after starting Malcolm (probably 5 to 10 minutes for Logstash to be completely up, depending on the system), the following services will be accessible:
OverviewMalcolm processes network traffic data in the form of packet capture (PCAP) files or Zeek logs. A packet capture appliance ("sensor") monitors network traffic mirrored to it over a SPAN port on a network switch or router, or using a network TAP device.
Zeek logs are generated containing important session metadata from the traffic observed, which are then securely forwarded to a Malcolm instance. Full PCAP files are optionally stored locally on the sensor device for examination later.
Malcolm parses the network session data and enriches it with additional lookups and mappings including GeoIP mapping, hardware manufacturer lookups from
organizationally unique identifiers (OUI) in MAC addresses, assigning names to
network segments and
hosts based on user-defined IP address and MAC mappings, performing TLS fingerprinting, and many others.
The enriched data is stored in an
Elasticsearch document store in a format suitable for analysis through two intuitive interfaces: Kibana, a flexible data visualization plugin with dozens of prebuilt dashboards providing an at-a-glance overview of network protocols; and Moloch, a powerful tool for finding and identifying the network sessions comprising suspected security incidents. These tools can be accessed through a web browser from analyst workstations or for display in a security operations center (SOC). Logs can also optionally be forwarded on to another instance of Malcolm.
For smaller networks, use at home by network security enthusiasts, or in the field for incident response engagements, Malcolm can also easily be deployed locally on an ordinary consumer workstation or laptop. Malcolm can process local artifacts such as locally-generated Zeek logs, locally-captured PCAP files, and PCAP files collected offline without the use of a dedicated sensor appliance.
ComponentsMalcolm leverages the following excellent open source tools, among others.
- Moloch - for PCAP file processing, browsing, searching, analysis, and carving/exporting; Moloch itself consists of two parts:
- moloch-capture - a tool for traffic capture, as well as offline PCAP parsing and metadata insertion into Elasticsearch
- viewer - a browser-based interface for data visualization
- Elasticsearch - a search and analytics engine for indexing and querying network traffic session metadata
- Logstash and Filebeat - for ingesting and parsing ZeekLog Files and ingesting them into Elasticsearch in a format that Moloch understands and is able to understand in the same way it natively understands PCAP data
- Kibana - for creating additional ad-hoc visualizations and dashboards beyond that which is provided by Moloch Viewer
- Zeek - a network analysis framework and IDS
- ClamAV - an antivirus engine for scanning files extracted by Zeek
- CyberChef - a "swiss-army knife" data conversion tool
- jQuery File Upload - for uploading PCAP files and Zeek logs for processing
- Docker and Docker Compose - for simple, reproducible deployment of the Malcolm appliance across environments and to coordinate communication between its various components
- nginx - for HTTPS and reverse proxying Malcolm components
- ElastAlert - an alerting framework for Elasticsearch. Specifically, the BitSensor fork of ElastAlert, its Docker configuration and its corresponding Kibana plugin are used.
DevelopmentChecking out the
Malcolm source code results in the following subdirectories in your
malcolm/ working copy:
curator - code and configuration for the curator container which define rules for closing and/or deleting old Elasticsearch indicesDockerfiles - a directory containing build instructions for Malcolm's docker imagesdocs - a directory containing instructions and documentationelastalert - code and configuration for the elastalert container which provides an alerting framework for Elasticsearchelasticsearch - an initially empty directory where the Elasticsearch database instance will resideelasticsearch-backup - an initially empty directory for storing Elasticsearch index snapshotsfilebeat - code and configuration for the filebeat container which ingests Zeek logs and forwards them to the logstash containerfile-monitor - code and configuration for the file-monitor container which can scan files extracted by Zeekfile-upload - code and configuration for the upload container which serves a web browser-based upload form for uploading PCAP files and Zeek logs, and which serves an SFTP share as an alternate method for uploadhtadmin - configuration for the htadmin user account management containeriso-build - code and configuration for building an installer ISO for a minimal Debian-based Linux installation for running Malcolmkibana - code and configuration for the kibana container for creating additional ad-hoc visualizations and dashboards beyond that which is provided by Moloch Viewerlogstash - code and configuration for the logstash container which parses Zeek logs and forwards them to the elasticsearch containermoloch - code and configuration for the moloch container which handles PCAP processing and which serves the Viewer applicationmoloch-logs - an initially empty directory to which the moloch container will write some debug log filesmoloch-raw - an initially empty directory to which the moloch container will write captured PCAP files; as Moloch as employed by Malcolm is currently used for processing previously-captured PCAP files, this directory is currently unusednginx - configuration for the nginx reverse proxy containerpcap - an initially empty directory for PCAP files to be uploaded, processed, and storedpcap-capture - code and configuration for the pcap-capture container which can capture network trafficscripts - control scripts for starting, stopping, restarting, etc. Malcolmshared - miscellaneous code used by various Malcolm componentszeek-logs - an initially empty directory for Zeek logs to be uploaded, processed, and stored
and the following files of special note:
auth.env - the script ./scripts/auth_setup.sh prompts the user for the administrator credentials used by the Malcolm appliance, and auth.env is the environment file where those values are storedcidr-map.txt - specify custom IP address to network segment mappinghost-map.txt - specify custom IP and/or MAC address to host mappingdocker-compose.yml - the configuration file used by docker-compose to build, start, and stop an instance of the Malcolm appliancedocker-compose-standalone.yml - similar to docker-compose.yml, only used for the "packaged" installation of Malcolmdocker-compose-standalone-zeek-live.yml - identical to docker-compose-standalone.yml, only Filebeat is configured to monitor live Zeek logs (ie., being actively written to)
Building from sourceBuilding the Malcolm docker images from scratch requires internet access to pull source files for its components. Once internet access is available, execute the following command to build all of the Docker images used by the Malcolm appliance:
$ ./scripts/build.sh
Then, go take a walk or something since it will be a while. When you're done, you can run
docker images and see you have fresh images for:
malcolmnetsec/curator (based on debian:buster-slim)malcolmnetsec/elastalert (based on bitsensor/elastalert)malcolmnetsec/file-monitor (based on debian:buster-slim)malcolmnetsec/file-upload (based on debian:buster-slim)malcolmnetsec/filebeat-oss (based on docker.elastic.co/beats/filebeat-oss)malcolmnetsec/htadmin (based on debian:buster-slim)malcolmnetsec/kibana-oss (based on docker.elastic.co/kibana/kibana-oss)malcolmnetsec/logstash-oss (based on centos:7)malcolmnetsec/moloch (based on debian:stretch-slim)malcolmnetsec/nginx-proxy (based on jwilder/nginx-proxy:alpine)malcolmnetsec/pcap-capture (based on debian:buster-slim)
Additionally, the command will pull from Docker Hub:
docker.elastic.co/elasticsearch/elasticsearch-oss
Pre-Packaged installation filesCreating pre-packaged installation filesscripts/malcolm_appliance_packager.sh can be run to package up the configuration files (and, if necessary, the Docker images) which can be copied to a network share or USB drive for distribution to non-networked machines. For example:
$ ./scripts/malcolm_appliance_packager.sh
You must set a username and password for Malcolm, and self-signed X.509 certificates will be generated
Administrator username: analyst
analyst password:
analyst password (again):

(Re)generate self-signed certificates for HTTPS access [Y/n]?

(Re)generate self-signed certificates for a remote log forwarder [Y/n]?

Store username/password for forwarding Logstash events to a secondary, external Elasticsearch instance [y/N]?
Packaged Malcolm to "/home/user/tmp/malcolm_20190513_101117_f0d052c.tar.gz"


Do you need to package docker images also [y/N]? y
This might take a few minutes...

Packaged Malcolm docker images to "/home/user/tmp/malcolm_20190513_101117_f0d052c_images.tar.gz"


To install Malcolm:
  1. Run install.py
  2. Follow the prompts

To start, stop, restart, etc. Malcolm:
  Use the control scripts in the "scripts/" dir   ectory:
   - start.sh      (start Malcolm)
   - stop.sh       (stop Malcolm)
   - restart.sh    (restart Malcolm)
   - logs.sh       (monitor Malcolm logs)
   - wipe.sh       (stop Malcolm and clear its database)
   - auth_setup.sh (change authentication-related settings)

A minute or so after starting Malcolm, the following services will be accessible:
  - Moloch: https://localhost/
  - Kibana: https://localhost:5601/
  - PCAP Upload (web): https://localhost:8443/
  - PCAP Upload (sftp): sftp://USERNAME@127.0.0.1:8022/files/
  - Account management: https://localhost:488/
The above example will result in the following artifacts for distribution as explained in the script's output:
$ ls -lh
total 2.0G
-rwxr-xr-x 1 user user  61k May 13 11:32 install.py
-rw-r--r-- 1 user user 2.0G May 13 11:37 malcolm_20190513_101117_f0d052c_images.tar.gz
-rw-r--r-- 1 user user  683 May 13 11:37 malcolm_20190513_101117_f0d052c.README.txt
-rw-r--r-- 1 user user 183k May 13 11:32 malcolm_20190513_101117_f0d052c.tar.gz
Installing from pre-packaged installation filesIf you have obtained pre-packaged installation files to install Malcolm on a non-networked machine via an internal network share or on a USB key, you likely have the following files:
malcolm_YYYYMMDD_HHNNSS_xxxxxxx.README.txt - This readme file contains a minimal set up instructions for extracting the contents of the other tarballs and running the Malcolm appliance.malcolm_YYYYMMDD_HHNNSS_xxxxxxx.tar.gz - This tarball contains the configuration files and directory configuration used by an instance of Malcolm. It can be extracted via tar -xf malcolm_YYYYMMDD_HHNNSS_xxxxxxx.tar.gz upon which a directory will be created (named similarly to the tarball) containing the directories and configuration files. Alternately, install.py can accept this filename as an argument and handle its extraction and initial configuration for you.malcolm_YYYYMMDD_HHNNSS_xxxxxxx_images.tar.gz - This tarball contains the Docker images used by Malcolm. It can be imported manually via docker load -i malcolm_YYYYMMDD_HHNNSS_xxxxxxx_images.tar.gzinstall.py - This install script can load the Docker images and extract Malcolm configuration files from the aforementioned tarballs and do some initial configuration for you.
Run
install.py malcolm_XXXXXXXX_XXXXXX_XXXXXXX.tar.gz and follow the prompts. If you do not already have Docker and Docker Compose installed, the
install.py script will help you install them.
Preparing your systemRecommended system requirementsMalcolm needs a reasonably up-to-date version of
Docker and
Docker Compose. In theory this should be possible on Linux, macOS, and recent Windows 10 releases, although so far it's only been tested on Linux and macOS hosts.
To quote the
Elasticsearch documentation, "If there is one resource that you will run out of first, it will likely be memory." The same is true for Malcolm: you will want at least 16 gigabytes of RAM to run Malcolm comfortably. For processing large volumes of traffic, I'd recommend at a bare minimum a dedicated server with 16 cores and 16 gigabytes of RAM. Malcolm can run on less, but more is better. You're going to want as much hard drive space as possible, of course, as the amount of PCAP data you're able to analyze and store will be limited by your hard drive.
Moloch's wiki has a couple of documents (
here and
here and
here and a
calculator here) which may be helpful, although not everything in those documents will apply to a Docker-based setup like Malcolm.
System configuration and tuningIf you already have Docker and Docker Compose installed, the
install.py script can still help you tune system configuration and
docker-compose.yml parameters for Malcolm. To run it in "configuration only" mode, bypassing the steps to install Docker and Docker Compose, run it like this:
sudo ./scripts/install.py --configure
Although
install.py will attempt to automate many of the following configuration and tuning parameters, they are nonetheless listed in the following sections for reference:
docker-compose.yml parametersEdit
docker-compose.yml and search for the
ES_JAVA_OPTS key. Edit the
-Xms4g -Xmx4g values, replacing
4g with a number that is half of your total system memory, or just under 32 gigabytes, whichever is less. So, for example, if I had 64 gigabytes of memory I would edit those values to be
-Xms31g -Xmx31g. This indicates how much memory can be allocated to the Elasticsearch heaps. For a pleasant experience, I would suggest not using a value under 10 gigabytes. Similar values can be modified for Logstash with
LS_JAVA_OPTS, where using 3 or 4 gigabytes is recommended.
Various other environment variables inside of
docker-compose.yml can be tweaked to control aspects of how Malcolm behaves, particularly with regards to processing PCAP files and Zeek logs. The environment variables of particular interest are located near the top of that file under
Commonly tweaked configuration options, which include:
INITIALIZEDB– indicates to Malcolm to create (or recreate) Moloch’s internal settings database on startup; this setting is managed by the wipe.sh and start.sh scripts and does not generally need to be changed manually
MANAGE_PCAP_FILES– if set to true, all PCAP files imported into Malcolm will be marked as available for deletion by Moloch if available storage space becomes too low (default false)
ZEEK_AUTO_ANALYZE_PCAP_FILES– if set to true, all PCAP files imported into Malcolm will automatically be analyzed by Zeek, and the resulting logs will also be imported (default false)
MOLOCH_ANALYZE_PCAP_THREADS– the number of threads available to Moloch for analyzing PCAP files (default 1)
ZEEK_AUTO_ANALYZE_PCAP_THREADS– the number of threads available to Malcolm for analyzing Zeek logs (default 1)
LOGSTASH_JAVA_EXECUTION_ENGINE– if set to true, Logstash will use the new Logstash Java Execution Engine which may significantly speed up Logstash startup and processing (default false, as it is currently considered experimental)
LOGSTASH_OUI_LOOKUP– if set to true, Logstash will map MAC addresses to vendors for all source and destination MAC addresses when analyzing Zeek logs (default true)
LOGSTASH_REVERSE_DNS– if set to true, Logstash will perform a reverse DNS lookup for all external source and destination IP address values when analyzing Zeek logs (default false)
ES_EXTERNAL_HOSTS– if specified (in the format '10.0.0.123:9200'), logs received by Logstash will be forwarded on to another external Elasticsearch instance in addition to the one maintained locally by Malcolm
ES_EXTERNAL_SSL– if set to true, Logstash will use HTTPS for the connection to external Elasticsearch instances specified in ES_EXTERNAL_HOSTS
ES_EXTERNAL_SSL_CERTIFICATE_VERIFICATION– if set to true, Logstash will require full SSL certificate validation; this may fail if using self-signed certificates (default false)
KIBANA_OFFLINE_REGION_MAPS– if set to true, a small internal server will be surfaced to Kibana to provide the ability to view region map visualizations even when an Internet connection is not available (default true)
CURATOR_CLOSE_COUNT and CURATOR_CLOSE_UNITS - determine behavior for automatically closing older Elasticsearch indices to conserve memory; see Elasticsearch index curation
CURATOR_DELETE_COUNT and CURATOR_DELETE_UNITS - determine behavior for automatically deleting older Elasticsearch indices to reduce disk usage; see Elasticsearch index curation
CURATOR_DELETE_GIGS - if the Elasticsearch indices representing the log data exceed this size, in gigabytes, older indices will be deleted to bring the total size back under this threshold; see Elasticsearch index curation
CURATOR_SNAPSHOT_DISABLED - if set to False, daily snapshots (backups) will be made of the previous day's Elasticsearch log index; see Elasticsearch index curation
AUTO_TAG– if set to true, Malcolm will automatically create Moloch sessions and Zeek logs with tags based on the filename, as described in Tagging (default true)
BEATS_SSL– if set to true, Logstash will use require encrypted communications for any external Beats-based forwarders from which it will accept logs; if Malcolm is being used as a standalone tool then this can safely be set to false, but if external log feeds are to be accepted then setting it to true is recommended (default false)
ZEEK_EXTRACTOR_MODE– determines the file extraction behavior for file transfers detected by Zeek; see Automatic file extraction and scanning for more details
EXTRACTED_FILE_IGNORE_EXISTING– if set to true, files extant in ./zeek-logs/extract_files/ directory will be ignored on startup rather than scanned
EXTRACTED_FILE_PRESERVATION– determines behavior for preservation of Zeek-extracted files
VTOT_API2_KEY– used to specify a VirusTotal Public API v.20 key, which, if specified, will be used to submit hashes of Zeek-extracted files to VirusTotal
EXTRACTED_FILE_ENABLE_CLAMAV– if set to true (and VTOT_API2_KEY is unspecified), Zeek-extracted files will be scanned with ClamAV
EXTRACTED_FILE_ENABLE_FRESHCLAM– if set to true, ClamAV will periodically update virus databases
PCAP_ENABLE_NETSNIFF– if set to true, Malcolm will capture network traffic on the local network interface(s) indicated in PCAP_IFACE using netsniff-ng
PCAP_ENABLE_TCPDUMP– if set to true, Malcolm will capture network traffic on the local network interface(s) indicated in PCAP_IFACE using tcpdump; there is no reason to enable bothPCAP_ENABLE_NETSNIFF and PCAP_ENABLE_TCPDUMP
PCAP_IFACE– used to specify the network interface(s) for local packet capture if PCAP_ENABLE_NETSNIFF or PCAP_ENABLE_TCPDUMP are enabled; for multiple interfaces, separate the interface names with a comma (eg., 'enp0s25' or 'enp10s0,enp11s0')
PCAP_ROTATE_MEGABYTES– used to specify how large a locally-captured PCAP file can become (in megabytes) before it closed for processing and a new PCAP file created
PCAP_ROTATE_MINUTES– used to specify an time interval (in minutes) after which a locally-captured PCAP file will be closed for processing and a new PCAP file created
PCAP_FILTER– specifies a tcpdump-style filter expression for local packet capture; leave blank to capture all traffic
Linux host system configurationInstalling DockerDocker installation instructions vary slightly by distribution. Please follow the links below to docker.com to find the instructions specific to your distribution:
After installing Docker, because Malcolm should be run as a non-root user, add your user to the
docker group with something like:
$ sudo usermod -aG docker yourusername
Following this, either reboot or log out then log back in.
Docker starts automatically on DEB-based distributions. On RPM-based distributions, you need to start it manually or enable it using the appropriate
systemctl or
service command(s).
You can test docker by running
docker info, or (assuming you have internet access),
docker run --rm hello-world.
Installing docker-composePlease follow
this link on docker.com for instructions on installing docker-compose.
Operating system configurationThe host system (ie., the one running Docker) will need to be configured for the
best possible Elasticsearch performance. Here are a few suggestions for Linux hosts (these may vary from distribution to distribution):
- Append the following lines to
/etc/sysctl.conf:
# the maximum number of open file handles
fs.file-max=65536

# the maximum number of user inotify watches
fs.inotify.max_user_watches=131072

# the maximum number of memory map areas a process may have
vm.max_map_count=262144

# decrease "swappiness" (swapping out runtime memory vs. dropping pages)
vm.swappiness=1

# the maximum number of incoming connections
net.core.somaxconn=65535

# the % of system memory fillable with "dirty" pages before flushing
vm.dirty_background_ratio=40

# maximum % of dirty system memory before committing everything
vm.dirty_ratio=80
- Depending on your distribution, create either the file
/etc/security/limits.d/limits.conf containing:
# the maximum number of open file handles
* soft nofile 65535
* hard nofile 65535
# do not limit the size of memory that can be locked
* soft memlock unlimited
* hard memlock unlimited
OR the file
/etc/systemd/system.conf.d/limits.conf containing:
[Manager]
# the maximum number of open file handles
DefaultLimitNOFILE=65535:65535
# do not limit the size of memory that can be locked
DefaultLimitMEMLOCK=infinity
- Change the readahead value for the disk where the Elasticsearch data will be stored. There are a few ways to do this. For example, you could add this line to
/etc/rc.local (replacing /dev/sda with your disk block descriptor):
# change disk read-adhead value (# of blocks)
blockdev --setra 512 /dev/sda
- Change the I/O scheduler to
deadline or noop. Again, this can be done in a variety of ways. The simplest is to add elevator=deadline to the arguments in GRUB_CMDLINE_LINUX in /etc/default/grub, then running sudo update-grub2
- If you are planning on using very large data sets, consider formatting the drive containing
elasticsearch volume as XFS.
After making all of these changes, do a reboot for good measure!
macOS host system configurationAutomatic installation using install.pyThe
install.py script will attempt to guide you through the installation of Docker and Docker Compose if they are not present. If that works for you, you can skip ahead to
Configure docker daemon option in this section.
Install HomebrewThe easiest way to install and maintain docker on Mac is using the
Homebrew cask. Execute the following in a terminal.
$ /usr/bin/ruby -e "$(curl -fsSL https://raw.githubusercontent.com/Homebrew/install/master/install)"
$ brew install cask
$ brew tap caskroom/versions
Install docker-edge$ brew cask install docker-edge
This will install the latest version of docker and docker-compose. It can be upgraded later using
brew as well:
$ brew cask upgrade --no-quarantine docker-edge
You can now run docker from the Applications folder.
Configure docker daemon optionSome changes should be made for performance (
this link gives a good succinct overview).
- Resource allocation - For a good experience, you likely need at least a quad-core MacBook Pro with 16GB RAM and an SSD. I have run Malcolm on an older 2013 MacBook Pro with 8GB of RAM, but the more the better. Go in your system tray and select Docker→ Preferences→ Advanced. Set the resources available to docker to at least 4 CPUs and 8GB of RAM (>= 16GB is preferable).
- Volume mount performance - You can speed up performance of volume mounts by removing unused paths from Docker→ Preferences→ File Sharing. For example, if you’re only going to be mounting volumes under your home directory, you could share
/Users but remove other paths.
After making these changes, right click on the Docker icon in the system tray and select
Restart.
Windows host system configurationThere are several ways of installing and running docker with Windows, and they vary depending on the version of Windows you are running, whether or not Hyper-V must be enabled (which is a requirement for VMWare, but is precluded by the recent non-virtual machine release of Docker).
As the author supposes that the target audience of this document are more likely to be running macOS or Linux, detailed instructions for Docker setup under Windows are not included here. Instead, refer to the following links:
Running MalcolmConfigure authenticationRun
./scripts/auth_setup.sh before starting Malcolm for the first time in order to:
- define the administrator account username and password
- specify whether or not to (re)generate the self-signed certificates used for HTTPS access
- key and certificate files are located in the
nginx/certs/ directory
- specify whether or not to (re)generate the self-signed certificates used by a remote log forwarder (see the
BEATS_SSL environment variable above) - certificate authority, certificate, and key files for Malcolm’s Logstash instance are located in the
logstash/certs/ directory - certificate authority, certificate, and key files to be copied to and used by the remote log forwarder are located in the
filebeat/certs/ directory
- specify whether or not to store the username/password for forwarding Logstash events to a secondary, external Elasticsearch instance (see the
ES_EXTERNAL_HOSTS, ES_EXTERNAL_SSL, and ES_EXTERNAL_SSL_CERTIFICATE_VERIFICATION environment variables above) - these parameters are stored securely in the Logstash keystore file
logstash/certs/logstash.keystore
Account managementauth_setup.sh is used to define the username and password for the administrator account. Once Malcolm is running, the administrator account can be used to manage other user accounts via a
Malcolm User Management page served over HTTPS on port 488 (eg.,
https://localhost:488 if you are connecting locally).
Malcolm user accounts can be used to access the
interfaces of all of its
components, including Moloch. Moloch uses its own internal database of user accounts, so when a Malcolm user account logs in to Moloch for the first time Malcolm creates a corresponding Moloch user account automatically. This being the case, it is
not recommended to use the Moloch
Users settings page or change the password via the
Password form under the Moloch
Settings page, as those settings would not be consistently used across Malcolm.
Users may change their passwords via the
Malcolm User Management page by clicking
User Self Service. A forgotten password can also be reset via an emailed link, though this requires SMTP server settings to be specified in
htadmin/config.ini in the Malcolm installation directory.
Starting MalcolmDocker compose is used to coordinate running the Docker containers. To start Malcolm, navigate to the directory containing
docker-compose.yml and run:
$ ./scripts/start.sh
This will create the containers' virtual network and instantiate them, then leave them running in the background. The Malcolm containers may take a several minutes to start up completely. To follow the debug output for an already-running Malcolm instance, run:
$ ./scripts/logs.sh
You can also use
docker stats to monitor the resource utilization of running containers.
Stopping and restarting MalcolmYou can run
./scripts/stop.sh to stop the docker containers and remove their virtual network. Alternately,
./scripts/restart.sh will restart an instance of Malcolm. Because the data on disk is stored on the host in docker volumes, doing these operations will not result in loss of data.
Malcolm can be configured to be automatically restarted when the Docker system daemon restart (for example, on system reboot). This behavior depends on the
value of the
restart: setting for each service in the
docker-compose.yml file. This value can be set by running
./scripts/install.py --configure and answering "yes" to "
Restart Malcolm upon system or Docker daemon restart?."
Clearing Malcolm’s dataRun
./scripts/wipe.sh to stop the Malcolm instance and wipe its Elasticsearch database (including
index snapshots).
Capture file and log archive uploadMalcolm serves a web browser-based upload form for uploading PCAP files and Zeek logs over HTTPS on port 8443 (eg.,
https://localhost:8443 if you are connecting locally).
Additionally, there is a writable
files directory on an SFTP server served on port 8022 (eg.,
sftp://USERNAME@localhost:8022/files/ if you are connecting locally).
The types of files supported are:
- PCAP files (of mime type
application/vnd.tcpdump.pcap or application/x-pcapng) - PCAPNG files are partially supported: Zeek is able to process PCAPNG files, but not all of Moloch's packet examination features work correctly
- Zeek logs in archive files (
application/gzip, application/x-gzip, application/x-7z-compressed, application/x-bzip2, application/x-cpio, application/x-lzip, application/x-lzma, application/x-rar-compressed, application/x-tar, application/x-xz, or application/zip) - where the Zeek logs are found in the internal directory structure in the archive file does not matter
Files uploaded via these methods are monitored and moved automatically to other directories for processing to begin, generally within one minute of completion of the upload.
TaggingIn addition to be processed for uploading, Malcolm events will be tagged according to the components of the filenames of the PCAP files or Zeek log archives files from which the events were parsed. For example, records created from a PCAP file named
ACME_Scada_VLAN10.pcap would be tagged with
ACME,
Scada, and
VLAN10. Tags are extracted from filenames by splitting on the characters "," (comma), "-" (dash), and "_" (underscore). These tags are viewable and searchable (via the
tags field) in Moloch and Kibana. This behavior can be changed by modifying the
AUTO_TAGenvironment variable in docker-compose.yml.
Tags may also be specified manually with the
browser-based upload form.
Processing uploaded PCAPs with ZeekThe browser-based upload interface also provides the ability to specify tags for events extracted from the files uploaded. Additionally, an
Analyze with Zeek checkbox may be used when uploading PCAP files to cause them to be analyzed by Zeek, similarly to the
ZEEK_AUTO_ANALYZE_PCAP_FILES environment variable
described above, only on a per-upload basis. Zeek can also automatically carve out files from file transfers; see
Automatic file extraction and scanning for more details.
Live analysisCapturing traffic on local network interfacesMalcolm's
pcap-capture container can capture traffic on one or more local network interfaces and periodically rotate these files for processing with Moloch and Zeek. The
pcap-capture Docker container is started with additional privileges (
IPC_LOCK,
NET_ADMIN,
NET_RAW, and
SYS_ADMIN) in order for it to be able to open network interfaces in promiscuous mode for capture.
The environment variables prefixed with
PCAP_ in the
docker-compose.yml file determine local packet capture behavior. Local capture can also be configured by running
./scripts/install.py --configure and answering "yes" to "
Should Malcolm capture network traffic to PCAP files?."
Note that currently Microsoft Windows and Apple macOS platforms run Docker inside of a virtualized environment. This would require additional configuration of virtual interfaces and
port forwarding in Docker, the process for which is outside of the scope of this document.
Zeek logs from an external sourceMalcolm’s Logstash instance can also be configured to accept Zeek logs from a
remote forwarder by running
./scripts/install.py --configure and answering "yes" to "
Expose Logstash port to external hosts?." Enabling encrypted transport of these logs files is discussed in
Configure authentication and the description of the
BEATS_SSL environment variable in the
docker-compose.yml file.
Configuring Filebeat to forward Zeek logs to Malcolm might look something like this example
filebeat.yml:
filebeat.inputs:
- type: log
  paths:
    - /var/zeek/*.log
  fields_under_root: true
  fields:
    type: "session"
  compression_level: 0
  exclude_lines: ['^\s*#']
  scan_frequency: 10s
  clean_inactive: 180m
  ignore_older: 120m
  close_inactive: 90m
  close_renamed: true
  close_removed: true
  close_eof: false
  clean_renamed: true
  clean_removed: true

output.logstash:
  hosts: ["192.0.2.123:5044"]
  ssl.enabled: true
  ssl.certificate_authorities: ["/foo/bar/ca.crt"]
  ssl.certificate: "/foo/bar/client.crt"
  ssl.key: "/foo/bar/client.key"
  ssl.supported_protocols: "TLSv1.2"
  ssl.verification_mode: "none"
A future release of Malcolm is planned which will include a customized Linux-based network sensor appliance OS installation image to help automate this setup.
Monitoring a local Zeek instanceAnother option for analyzing live network data is to run an external copy of Zeek (ie., not within Malcolm) so that the log files it creates are seen by Malcolm and automatically processed as they are written.
To do this, you'll need to configure Malcolm's local Filebeat log forwarder so that it will continue to look for changes to Zeek logs that are actively being written to even once it reaches the end of the file. You can do this by replacing
docker-compose.yml with
docker-compose-zeek-live.yml before starting Malcolm:
$ mv -f ./docker-compose-zeek-live.yml ./docker-compose.yml
Alternately, you can run the
start.sh script (and the other control scripts) like this, without modifying your original
docker-compose.yml file:
$ ./scripts/start.sh ./docker-compose-zeek-live.yml
Once Malcolm has been
started,
cd into
./zeek-logs/current/ and run
bro from inside that directory.
MolochThe Moloch interface will be accessible over HTTPS on port 443 at the docker hosts IP address (eg.,
https://localhost if you are connecting locally).
Zeek log integrationA stock installation of Moloch extracts all of its network connection ("session") metadata ("SPI" or "Session Profile Information") from full packet capture artifacts (PCAP files). Zeek (formerly Bro) generates similar session metadata, linking network events to sessions via a connection UID. Malcolm aims to facilitate analysis of Zeek logs by mapping values from Zeek logs to the Moloch session database schema for equivalent fields, and by creating new "native" Moloch database fields for all the other Zeek log values for which there is not currently an equivalent in Moloch:
In this way, when full packet capture is an option, analysis of PCAP files can be enhanced by the additional information Zeek provides. When full packet capture is not an option, similar analysis can still be performed using the same interfaces and processes using the Zeek logs alone.
One value of particular mention is
Zeek Log Type (
zeek.logType in Elasticsearch). This value corresponds to the kind of Zeek
.log file from which the record was created. In other words, a search could be restricted to records from
conn.log by searching
zeek.logType == conn, or restricted to records from
weird.log by searching
zeek.logType == weird. In this same way, to view
only records from Zeek logs (excluding any from PCAP files), use the special Moloch
EXISTS filter, as in
zeek.logType == EXISTS!. On the other hand, to exclude Zeek logs and only view records from PCAP files, use
zeek.logType != EXISTS!.
Click the icon of the owl
in the upper-left hand corner of to access the Moloch usage documentation (accessible at
https://localhost/help if you are connecting locally), click the
Fields label in the navigation pane, then search for
zeek to see a list of the other Zeek log types and fields available to Malcolm.
The values of records created from Zeek logs can be expanded and viewed like any native moloch session by clicking the plus
icon to the left of the record in the Sessions view. However, note that when dealing with these Zeek records the full packet contents are not available, so buttons dealing with viewing and exporting PCAP information will not behave as they would for records from PCAP files. However, clicking the
Source Raw or
Destination Raw buttons will allow you to view the original Zeek log (formatted as JSON) from which the record was created. Other than that, Zeek records and their values are usable in Malcolm just like native PCAP session records.
HelpClick the icon of the owl in the upper-left hand corner of to access the Moloch usage documentation (accessible at
https://localhost/help if you are connecting locally), which includes such topics as
search syntax, the
Sessions view,
SPIView,
SPIGraph, and the
Connections graph.
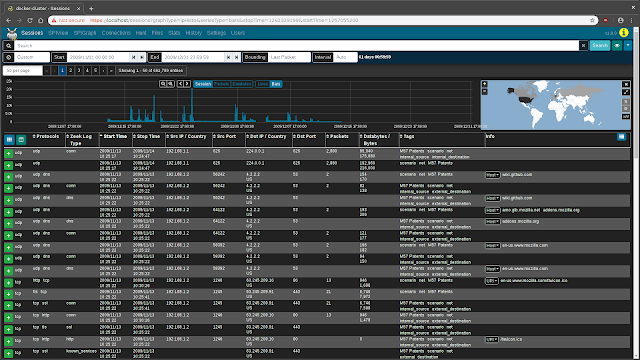
SessionsThe
Sessions view provides low-level details of the sessions being investigated, whether they be Moloch sessions created from PCAP files or
Zeek logs mapped to the Moloch session database schema.
The
Sessions view contains many controls for filtering the sessions displayed from all sessions down to sessions of interest:
- search bar: Indicated by the magnifying glass icon, the search bar allows defining filters on session/log metadata
- time bounding controls: The start icon, Start, End, Bounding, and Interval fields, and the date histogram can be used to visually zoom and pan the time range being examined.
- search button: The Search button re-runs the sessions query with the filters currently specified.
- views button: Indicated by the eyeball icon, views allow overlaying additional previously-specified filters onto the current sessions filters. For convenience, Malcolm provides several Moloch preconfigured views including several on the
zeek.logType field.
- map: A global map can be expanded by clicking the globe icon. This allows filtering sessions by IP-based geolocation when possible.
Some of these filter controls are also available on other Moloch pages (such as SPIView, SPIGraph, Connections, and Hunt).
The number of sessions displayed per page, as well as the page currently displayed, can be specified using the paging controls underneath the time bounding controls.
The sessions table is displayed below the filter controls. This table contains the sessions/logs matching the specified filters.
To the left of the column headers are two buttons. The
Toggle visible columns button, indicated by a grid
⊞ icon, allows toggling which columns are displayed in the sessions table. The
Save or load custom column configuration button, indicated by a columns
◫ icon, allows saving the current displayed columns or loading previously-saved configurations. This is useful for customizing which columns are displayed when investigating different types of traffic. Column headers can also be clicked to sort the results in the table, and column widths may be adjusted by dragging the separators between column headers.
Details for individual sessions/logs can be expanded by clicking the plus icon on the left of each row. Each row may contain multiple sections and controls, depending on whether the row represents a Moloch session or a
Zeek log. Clicking the field names and values in the details sections allows additional filters to be specified or summary lists of unique values to be exported.
When viewing Moloch session details (ie., a session generated from a PCAP file), an additional packets section will be visible underneath the metadata sections. When the details of a session of this type are expanded, Moloch will read the packet(s) comprising the session for display here. Various controls can be used to adjust how the packet is displayed (enabling
natural decoding and enabling
Show Images & Files may produce visually pleasing results), and other options (including PCAP download, carving images and files, applying decoding filters, and examining payloads in
CyberChef) are available.
See also Moloch's usage documentation for more information on the
Sessions view.
PCAP ExportClicking the down arrow
▼ icon to the far right of the search bar presents a list of actions including
PCAP Export (see Moloch's
sessions help for information on the other actions). When full PCAP sessions are displayed, the
PCAP Export feature allows you to create a new PCAP file from the matching Moloch sessions, including controls for which sessions are included (open items, visible items, or all matching items) and whether or not to include linked segments. Click
Export PCAP button to generate the PCAP, after which you'll be presented with a browser download dialog to save or open the file. Note that depending on the scope of the filters specified this might take a long time (or, possibly even time out).
See the
issues section of this document for an error that can occur using this feature when Zeek log sessions are displayed.View
SPIViewMoloch's
SPI (
Session
Profile
Information)
View provides a quick and easy-to-use interface for exploring session/log metrics. The SPIView page lists categories for general session metrics (eg., protocol, source and destination IP addresses, sort and destination ports, etc.) as well as for all of various types of network understood by Moloch and Zeek. These categories can be expanded and the top
n values displayed, along with each value's cardinality, for the fields of interest they contain.
Click the the plus icon to the right of a category to expand it. The values for specific fields are displayed by clicking the field description in the field list underneatn the category name. The list of field names can be filtered by typing part of the field name in the
Search for fields to display in this category text input. The
Load All and
Unload All buttons can be used to toggle display of all of the fields belonging to that category. Once displayed, a field's name or one of its values may be clicked to provide further actions for filtering or displaying that field or its values. Of particular interest may be the
Open [fieldname] SPI Graph option when clicking on a field's name. This will open a new tab with the SPI Graph (
see below) populated with the field's top values.
Note that because the SPIView page can potentially run many queries, SPIView limits the search domain to seven days (in other words, seven indices, as each index represents one day's worth of data). When using SPIView, you will have best results if you limit your search time frame to less than or equal to seven days. This limit can be adjusted by editing the
spiDataMaxIndices setting in
config.ini and rebuilding the
malcolmnetsec/moloch docker container.
See also Moloch's usage documentation for more information on
SPIView.
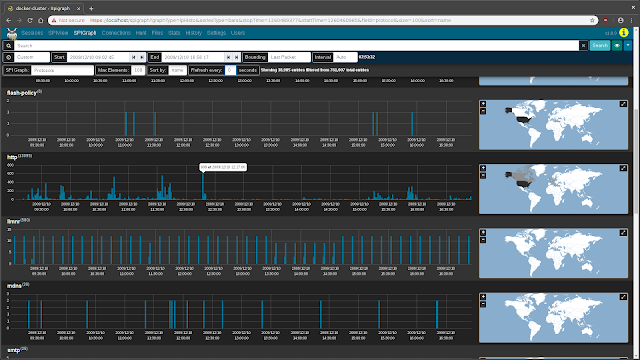
SPIGraphMoloch's
SPI (
Session
Profile
Information)
Graph visualizes the occurrence of some field's top
n values over time, and (optionally) geographically. This is particularly useful for identifying trends in a particular type of communication over time: traffic using a particular protocol when seen sparsely at regular intervals on that protocol's date histogram in the SPIGraph may indicate a connection check, polling, or beaconing (for example, see the
llmnr protocol in the screenshot below).
Controls can be found underneath the time bounding controls for selecting the field of interest, the number of elements to be displayed, the sort order, and a periodic refresh of the data.
See also Moloch's usage documentation for more information on
SPIGraph.
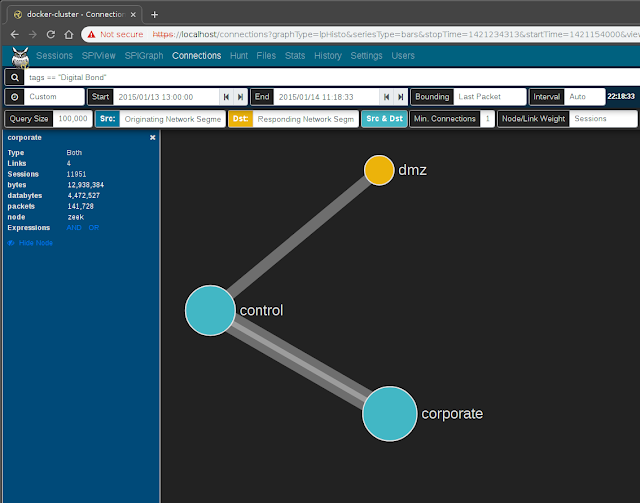
ConnectionsThe
Connections page presents network communications via a force-directed graph, making it easy to visualize logical relationships between network hosts.
Controls are available for specifying the query size (where smaller values will execute more quickly but may only contain an incomplete representation of the top
n sessions, and larger values may take longer to execute but will be more complete), which fields to use as the source and destionation for node values, a minimum connections threshold, and the method for determining the "weight" of the link between two nodes. As is the case with most other visualizations in Moloch, the graph is interactive: clicking on a node or the link between two nodes can be used to modify query filters, and the nodes themselves may be repositioned by dragging and dropping them. A node's color indicates whether it communicated as a source/originator, a destination/responder, or both.
While the default source and destination fields are
Src IP and
Dst IP:Dst Port, the Connections view is able to use any combination of any of the fields populated by Moloch and Zeek. For example:
- Src OUI and Dst OUI (hardware manufacturers)
- Src IP and Protocols
- Originating Network Segment and Responding Network Segment (see CIDR subnet to network segment name mapping)
- Originating GeoIP City and Responding GeoIP City
or any other combination of these or other fields.
See also Moloch's usage documentation for more information on the
Connections graph.
HuntMoloch's
Hunt feature allows an analyst to search within the packets themselves (including payload data) rather than simply searching the session metadata. The search string may be specified using ASCII (with or without case sensitivity), hex codes, or regular expressions. Once a hunt job is complete, matching sessions can be viewed in the
Sessions view.
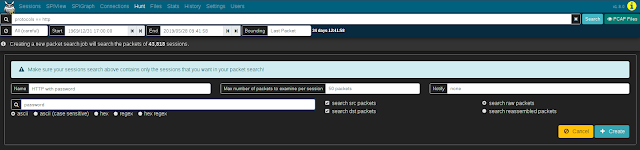
Clicking the
Create a packet search job on the Hunt page will allow you to specify the following parameters for a new hunt job:
- a packet search job name
- a maximum number of packets to examine per session
- the search string and its format (ascii, ascii (case sensitive), hex, regex, or hex regex)
- whether to search source packets, destination packets, or both
- whether to search raw or reassembled packets
Click the
Create button to begin the search. Moloch will scan the source PCAP files from which the sessions were created according to the search criteria. Note that whatever filters were specified when the hunt job is executed will apply to the hunt job as well; the number of sessions matching the current filters will be displayed above the hunt job parameters with text like "ⓘ Creating a new packet search job will search the packets of # sessions."
Once a hunt job is submitted, it will be assigned a unique hunt ID (a long unique string of characters like
yuBHAGsBdljYmwGkbEMm) and its progress will be updated periodically in the
Hunt Job Queue with the execution percent complete, the number of matches found so far, and the other parameters with which the job was submitted. More details for the hunt job can be viewed by expanding its row with the plus icon on the left.
Once the hunt job is complete (and a minute or so has passed, as the
huntId must be added to the matching session records in the database), click the folder icon on the right side of the hunt job row to open a new
Sessions tab with the search bar prepopulated to filter to sessions with packets matching the search criteria.
From this list of filtered sessions you can expand session details and explore packet payloads which matched the hunt search criteria.
The hunt feature is available only for sessions created from full packet capture data, not Zeek logs. This being the case, it is a good idea to click the eyeball icon and select the
PCAP Files view to exclude Zeek logs from candidate sessions prior to using the hunt feature.
See also Moloch's usage documentation for more information on the
hunt feature.
StatisticsMoloch provides several other reports which show information about the state of Moloch and the underlying Elasticsearch database.
The
Files list displays a list of PCAP files processed by Moloch, the date and time of the earliest packet in each file, and the file size:
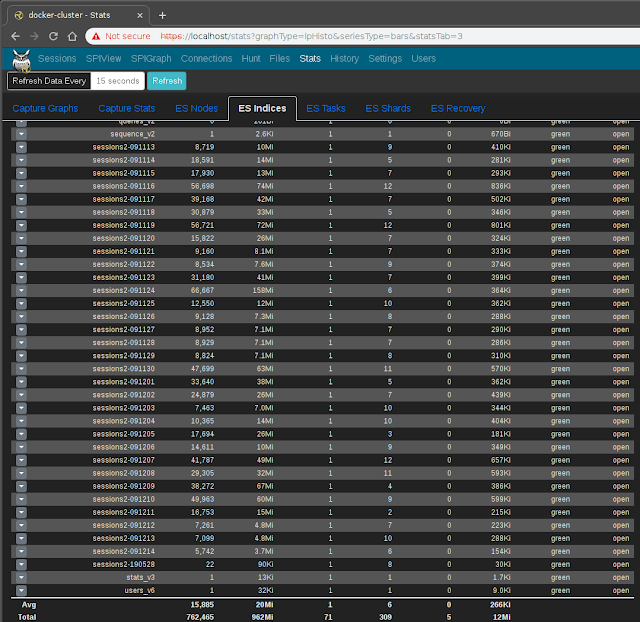
The
ES Indices list (available under the
Stats page) lists the Elasticsearch indices within which log data is contained:
The
History view provides a historical list of queries issues to Moloch and the details of those queries:
See also Moloch's usage documentation for more information on the
Files list,
statistics, and
history.
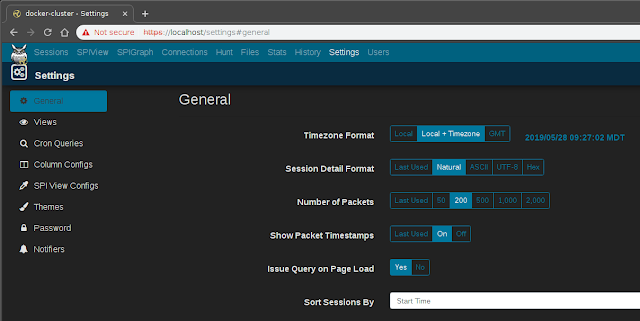
SettingsGeneral settingsThe
Settings page can be used to tweak Moloch preferences, defined additional custom views and column configurations, tweak the color theme, and more.
See Moloch's usage documentation for more information on
settings.
KibanaWhile Moloch provides very nice visualizations, especially for network traffic,
Kibana (an open source general-purpose data visualization tool for Elasticsearch) can be used to create custom visualizations (tables, charts, graphs, dashboards, etc.) using the same data.
The Kibana container can be accessed over HTTPS on port 5601 (eg.,
https://localhost:5601 if you are connecting locally). Several preconfigured dashboards for Zeek logs are included in Malcolm's Kibana configuration.
The official
Kibana User Guide has excellent tutorials for a variety of topics.
Kibana has several components for data searching and visualization:
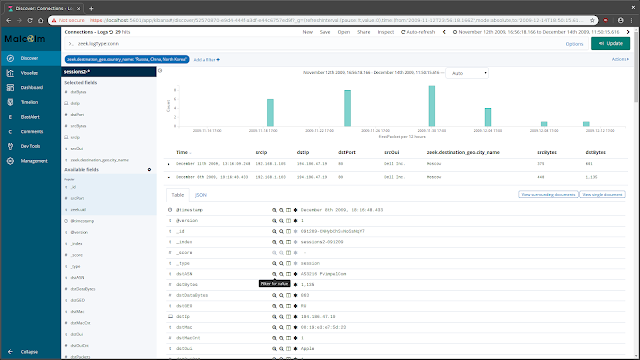
DiscoverThe
Discover view enables you to view events on a record-by-record basis (similar to a
session record in Moloch or an individual line from a Zeek log). See the official
Kibana User Guide for information on using the Discover view:
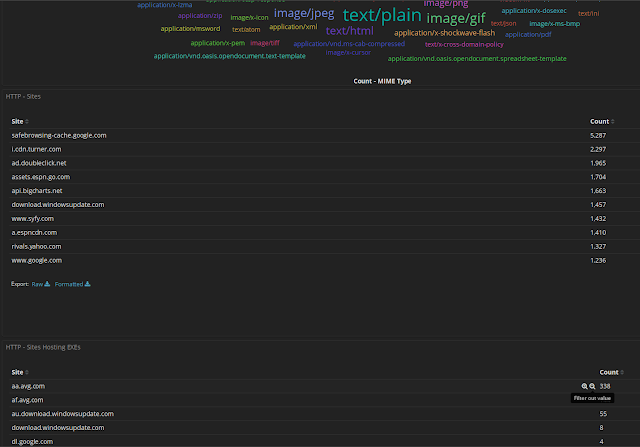
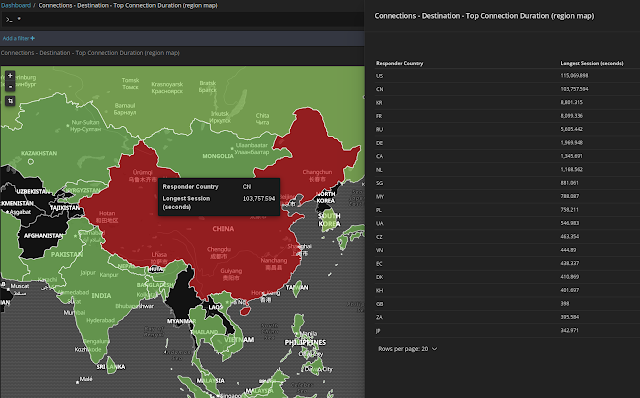
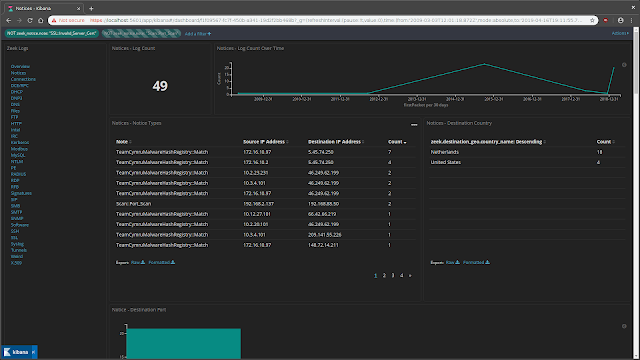
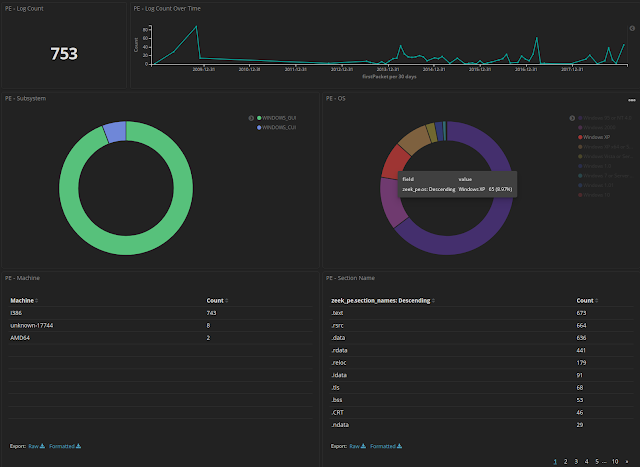
ScreenshotsVisualizations and dashboardsPrebuilt visualizations and dashboardsMalcolm comes with dozens of prebuilt visualizations and dashboards for the network traffic represented by each of the Zeek log types. Click
Dashboard to see a list of these dashboards. As is the case with all Kibana's visualizations, all of the charts, graphs, maps, and tables are interactive and can be clicked on to narrow or expand the scope of the data you are investigating. Similarly, click
Visualize to explore the prebuilt visualizations used to build the dashboards.
Many of Malcolm's prebuilt visualizations for Zeek logs are heavily inspired by the excellent
Kibana Dashboards that are part of
Security Onion.
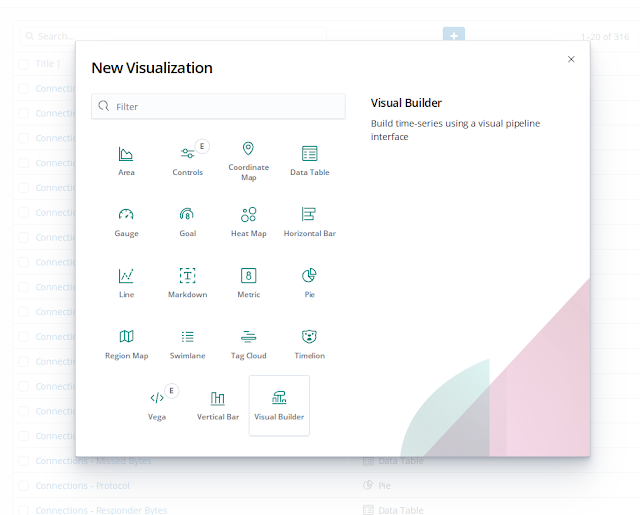
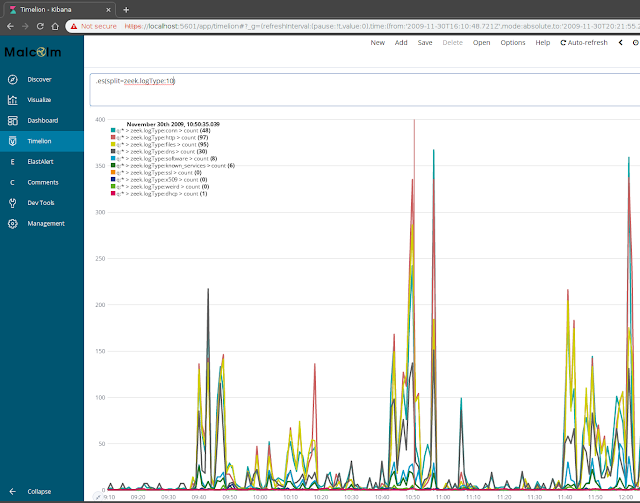
ScreenshotsBuilding your own visualizations and dashboardsSee the official
Kibana User Guide for information on creating your own visualizations and dashboards:
ScreenshotsOther Malcolm featuresAutomatic file extraction and scanningMalcolm can leverage Zeek's knowledge of network protocols to automatically detect file transfers and extract those files from PCAPs as Zeek processes them. This behavior can be enabled globally by modifying the
ZEEK_EXTRACTOR_MODEenvironment variable in docker-compose.yml, or on a per-upload basis for PCAP files uploaded via the
browser-based upload form when
Analyze with Zeek is selected.
To specify which files should be extracted, the following values are acceptable in
ZEEK_EXTRACTOR_MODE:
none: no file extractioninteresting: extraction of files with mime types of common attack vectorsmapped: extraction of files with recognized mime typesknown: extraction of files for which any mime type can be determinedall: extract all files
Extracted files can be examined through either (but not both) of two methods:
Files which are flagged as potentially malicious via either of these methods will be logged as Zeek
signatures.log entries, and can be viewed in the
Signatures dashboard in Kibana.
The
EXTRACTED_FILE_PRESERVATIONenvironment variable in docker-compose.yml determines the behavior for preservation of Zeek-extracted files:
quarantined: preserve only flagged files in ./zeek-logs/extract_files/quarantineall: preserve flagged files in ./zeek-logs/extract_files/quarantine and all other extracted files in ./zeek-logs/extract_files/preservednone: preserve no extracted files
Automatic host and subnet name assignmentIP/MAC address to hostname mapping via host-map.txtThe
host-map.txt file in the Malcolm installation directory can be used to define names for network hosts based on IP and/or MAC addresses in Zeek logs. The default empty configuration looks like this:
# IP or MAC address to host name map:
#   address|host name|required tag
#
# where:
#   address: comma-separated list of IPv4, IPv6, or MAC addresses
#          eg., 172.16.10.41, 02:42:45:dc:a2:96, 2001:0db8:85a3:0000:0000:8a2e:0370:7334
#
#   host name: host name to be assigned when event address(es) match
#
#   required tag (optional): only check match and apply host name if the event
#                            contains this tag
#
Each non-comment line (not beginning with a
#), defines an address-to-name mapping for a network host. For example:
127.0.0.1,127.0.1.1,::1|localhost|
192.168.10.10|office-laptop.intranet.lan|
06:46:0b:a6:16:bf|serial-host.intranet.lan|testbed
Each line consists of three
|-separated fields: address(es), hostname, and, optionally, a tag which, if specified, must belong to a log for the matching to occur.
As Zeek logs are processed into Malcolm's Elasticsearch instance, the log's source and destination IP and MAC address fields (
zeek.orig_h,
zeek.resp_h,
zeek.orig_l2_addr, and
zeek.resp_l2_addr, respectively) are compared against the lists of addresses in
host-map.txt. When a match is found, a new field is added to the log:
zeek.orig_hostname or
zeek.resp_hostname, depending on whether the matching address belongs to the originating or responding host. If the third field (the "required tag" field) is specified, a log must also contain that value in its
tags field in addition to matching the IP or MAC address specified in order for the corresponding
_hostname field to be added.
zeek.orig_hostname and
zeek.resp_hostname may each contain multiple values. For example, if both a host's source IP address and source MAC address were matched by two different lines,
zeek.orig_hostname would contain the hostname values from both matching lines.
CIDR subnet to network segment name mapping via cidr-map.txtThe
cidr-map.txt file in the Malcolm installation directory can be used to define names for network segments based on IP addresses in Zeek logs. The default empty configuration looks like this:
# CIDR to network segment format:
#   IP(s)|segment name|required tag
#
# where:
#   IP(s): comma-separated list of CIDR-formatted network IP addresses
#          eg., 10.0.0.0/8, 169.254.0.0/16, 172.16.10.41
#
#   segment name: segment name to be assigned when event IP address(es) match
#
#   required tag (optional): only check match and apply segment name if the event
#                            contains this tag
#
Each non-comment line (not beginning with a
#), defines an subnet-to-name mapping for a network host. For example:
192.168.50.0/24,192.168.40.0/24,10.0.0.0/8|corporate|
192.168.100.0/24|control|
192.168.200.0/24|dmz|
172.16.0.0/12|virtualized|testbed
Each line consists of three
|-separated fields: CIDR-formatted subnet IP range(s), subnet name, and, optionally, a tag which, if specified, must belong to a log for the matching to occur.
As Zeek logs are processed into Malcolm's Elasticsearch instance, the log's source and destination IP address fields (
zeek.orig_h and
zeek.resp_h, respectively) are compared against the lists of addresses in
cidr-map.txt. When a match is found, a new field is added to the log:
zeek.orig_segment or
zeek.resp_segment, depending on whether the matching address belongs to the originating or responding host. If the third field (the "required tag" field) is specified, a log must also contain that value in its
tags field in addition to its IP address falling within the subnet specified in order for the corresponding
_segment field to be added.
zeek.orig_segment and
zeek.resp_segment may each contain multiple values. For example, if
cidr-map.txt specifies multiple overlapping subnets on different lines,
zeek.orig_segment would contain the hostname values from both matching lines if
zeek.orig_h belonged to both subnets.
If both
zeek.orig_segment and
zeek.resp_segment are added to a log, and if they contain different values, the tag
cross_segment will be added to the log's
tags field for convenient identification of cross-segment traffic. This traffic could be easily visualized using Moloch's
Connections graph, by setting the
Src: value to
Originating Network Segment and the
Dst: value to
Responding Network Segment:
Applying mapping changesWhen changes are made to either
cidr-map.txt or
host-map.txt, Malcolm's Logstash container must be restarted. The easiest way to do this is to restart malcolm via
restart.sh (see
Stopping and restarting Malcolm).
Elasticsearch index curationMalcolm uses
Elasticsearch Curator to periodically examine indices representing the log data and perform actions on indices meeting criteria for age or disk usage. The environment variables prefixed with
CURATOR_ in the
docker-compose.yml file determine the criteria for the following actions:
This behavior can also be modified by running
./scripts/install.py --configure.
Other custom
filters and
actions may be defined by the user by manually modifying the
action_file.yml file used by the
curator container and ensuring that it is mounted into the container as a volume in the
curator: section of your
docker-compose.yml file:
  curator:
…
    volumes:
      - ./curator/config/action_file.yml:/config/action_file.yml
…
The settings governing index curation can affect Malcolm's performance in both log ingestion and queries, and there are caveats that should be taken into consideration when configuring this feature. Please read the Elasticsearch documentation linked in this section with regards to index curation.
Index curation only deals with disk space consumed by Elasticsearch indices: it does not have anything to do with PCAP file storage. The
MANAGE_PCAP_FILES environment variable in the
docker-compose.yml file can be used to allow Moloch to prune old PCAP files based on available disk space.
Known issuesPCAP file export error when Zeek logs are in Moloch search resultsMoloch has a nice feature that allows you to export PCAP files matching the filters currently populating the search field. However, Moloch viewer will raise an exception if records created from Zeek logs are found among the search results to be exported. For this reason, if you are using the export PCAP feature it is recommended that you apply the
PCAP Files view to filter your search results prior to doing the export.
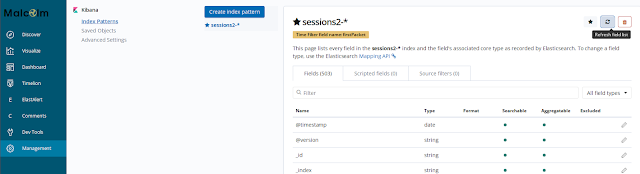
Manual Kibana index pattern refreshBecause some fields are created in Elasticsearch dynamically when Zeek logs are ingested by Logstash, they may not have been present when Kibana configures its index pattern field mapping during initialization. As such, those fields will not show up in Kibana visualizations until Kibana’s copy of the field list is refreshed. Malcolm periodically refreshes this list, but if fields are missing from your visualizations you may wish to do it manually.
After Malcolm ingests your data (or, more specifically, after it has ingested a new log type it has not seen before) you may manually refresh Kibana’s field list by clicking
Management→
Index Patterns, then selecting the
sessions2-* index pattern and clicking the reload
button near the upper-right of the window.
Installation example using Ubuntu 18.04 LTSHere's a step-by-step example of getting
Malcolm from GitHub, configuring your system and your Malcolm instance, and running it on a system running Ubuntu Linux. Your mileage may vary depending on your individual system configuration, but this should be a good starting point.
You can use
git to clone Malcolm into a local working copy, or you can download and extract the artifacts from the
latest release.
To install Malcolm from the latest Malcolm release, browse to the
Malcolm releases page on GitHub and download at a minimum
install.py and the
malcolm_YYYYMMDD_HHNNSS_xxxxxxx.tar.gz file, then navigate to your downloads directory:
user@host:~$ cd Downloads/
user@host:~/Downloads$ ls
install.py  malcolm_20190611_095410_ce2d8de.tar.gz
If you are obtaining Malcolm using
git instead, run the following command to clone Malcolm into a local working copy:
user@host:~$ git clone https://github.com/idaholab/Malcolm
Cloning into 'Malcolm'...
remote: Enumerating objects: 443, done.
remote: Counting objects: 100% (443/443), done.
remote: Compressing objects: 100% (310/310), done.
remote: Total 443 (delta 81), reused 441 (delta 79), pack-reused 0
Receiving objects: 100% (443/443), 6.87 MiB | 18.86 MiB/s, done.
Resolving deltas: 100% (81/81), done.

user@host:~$ cd Malcolm/
Next, run the
install.py script to configure your system. Replace
user in this example with your local account username, and follow the prompts. Most questions have an acceptable default you can accept by pressing the
Enter key. Depending on whether you are installing Malcolm from the release tarball or inside of a git working copy, the questions below will be slightly different, but for the most part are the same.
user@host:~/Downloads$ sudo python3 install.py
Installing required packages: ['apache2-utils', 'make', 'openssl']

"docker info" failed, attempt to install Docker? (Y/n): y

Attempt to install Docker using official repositories? (Y/n): y
Installing required packages: ['apt-transport-https', 'ca-certificates', 'curl', 'gnupg-agent', 'software-properties-common']
Installing docker packages: ['docker-ce', 'docker-ce-cli', 'containerd.io']
Installation of docker packages apparently succeeded

Add a non-root user to the "docker" group? (y/n): y

Enter user account: user

Add another non-root user to the "docker" group? (y/n): n

"docker-compose version" failed, attempt to install docker-compose? (Y/n): y

Install docker-compose directly from docker github? (Y/n): y
Download and installation of docker-compose apparently succeeded


fs.file-max increases allowed maximum for file handles
fs   .file-max= appears to be missing from /etc/sysctl.conf, append it? (Y/n): y

fs.inotify.max_user_watches increases allowed maximum for monitored files
fs.inotify.max_user_watches= appears to be missing from /etc/sysctl.conf, append it? (Y/n): y


vm.max_map_count increases allowed maximum for memory segments
vm.max_map_count= appears to be missing from /etc/sysctl.conf, append it? (Y/n): y


net.core.somaxconn increases allowed maximum for socket connections
net.core.somaxconn= appears to be missing from /etc/sysctl.conf, append it? (Y/n): y


vm.swappiness adjusts the preference of the system to swap vs. drop runtime memory pages
vm.swappiness= appears to be missing from /etc/sysctl.conf, append it? (Y/n): y


vm.dirty_background_ratio defines the percentage of system memory fillable with "dirty" pages before flushing
vm.dirty_background_ratio= appears to be missing from /etc/sysctl.conf, append it? (Y/n):    y


vm.dirty_ratio defines the maximum percentage of dirty system memory before committing everything
vm.dirty_ratio= appears to be missing from /etc/sysctl.conf, append it? (Y/n): y


/etc/security/limits.d/limits.conf increases the allowed maximums for file handles and memlocked segments
/etc/security/limits.d/limits.conf does not exist, create it? (Y/n): y

The "haveged" utility may help improve Malcolm startup times by providing entropy for the Linux kernel.
Install haveged? (y/N): y
Installing haveged packages: ['haveged']
Installation of haveged packages apparently succeeded
At this point,
if you are installing from the a release tarball you will be asked if you would like to extract the contents of the tarball and to specify the installation directory:
Extract Malcolm runtime files from /home/user/Downloads/malcolm_20190611_095410_ce2d8de.tar.gz (Y/n): y

Enter installation path for Malcolm [/home/user/Downloads/malcolm]: /home/user/Malcolm
Malcolm runtime files extracted to /home/user/Malcolm
Alternately,
if you are configuring Malcolm from within a git working copy,
install.py will now exit. Run
install.py again like you did at the beginning of the example, only remove the
sudo and add
--configure to run
install.py in "configuration only" mode.
user@host:~/Malcolm$ python3 scripts/install.py --configure
Now that any necessary system configuration changes have been made, the local Malcolm instance will be configured:
Setting 10g for Elasticsearch and 3g for Logstash. Is this OK? (Y/n): y

Restart Malcolm upon system or Docker daemon restart? (y/N): y

Select Malcolm restart behavior ('no', 'on-failure', 'always', 'unless-stopped'): unless-stopped

Periodically close old Elasticsearch indices? (Y/n): y

Indices older than 5 years will be periodically closed. Is this OK? (Y/n): n

Enter index close threshold (eg., 90 days, 2 years, etc.): 1 years

Indices older than 1 years will be periodically closed. Is this OK? (Y/n): y

Periodically delete old Elasticsearch indices? (Y/n): y

Indices older than 10 years will be periodically deleted. Is this OK? (Y/n): n

Enter index delete threshold (eg., 90 days, 2 years, etc.): 5 years

Indices older than 5 years will be periodically deleted. Is this OK? (Y/n): y

Periodically delete the oldest Elasticsearch indices when the database exceeds a certain size? (Y/n   ): y

Indices will be deleted when the database exceeds 10000 gigabytes. Is this OK? (Y/n): n

Enter index threshold in gigabytes: 100

Indices will be deleted when the database exceeds 100 gigabytes. Is this OK? (Y/n): y

Automatically analyze all PCAP files with Zeek? (y/N): y

Perform reverse DNS lookup locally for source and destination IP addresses in Zeek logs? (y/N): n

Perform hardware vendor OUI lookups for MAC addresses? (Y/n): y

Expose Logstash port to external hosts? (y/N): n

Forward Logstash logs to external Elasticstack instance? (y/N): n

Enable file extraction with Zeek? (y/N): y

Select file extraction behavior ('none', 'known', 'mapped', 'all', 'interesting'): interesting

Select file preservation behavior ('quarantined', 'all', 'none'): quarantined

Scan extracted files with ClamAV? (y/N): y

Download updated ClamAV virus signatures periodically? (Y/n): y

Should Malcolm capture network traffic to PCAP files? (y/N): y

Specify capture interface(s) (comma-separated): eth0

Capture packets using netsniff-ng? (Y/n): y

Capture packets using tcpdump? (y/N): n

Malcolm has been installed to /home/user/Malcolm. See README.md for more information.
Scripts for starting and stopping Malcolm and changing authentication-related settings can be found
in /home/user/Malcolm/scripts.
At this point you should
reboot your computer so that the new system settings can be applied. After rebooting, log back in and return to the directory to which Malcolm was installed (or to which the git working copy was cloned).
Now we need to
set up authentication and generate some unique self-signed SSL certificates. You can replace
analyst in this example with whatever username you wish to use to log in to the Malcolm web interface.
user@host:~/Malcolm$ ./scripts/auth_setup.sh
Username: analyst
analyst password:
analyst password (again):

(Re)generate self-signed certificates for HTTPS access [Y/n]? y

(Re)generate self-signed certificates for a remote log forwarder [Y/n]? y

Store username/password for forwarding Logstash events to a secondary, external Elasticsearch instance [y/N]? n
For now, rather than
build Malcolm from scratch, we'll pull images from
Docker Hub:
user@host:~/Malcolm$ docker-compose pull
Pulling elasticsearch ... done
Pulling kibana        ... done
Pulling elastalert    ... done
Pulling curator       ... done
Pulling logstash      ... done
Pulling filebeat      ... done
Pulling moloch        ... done
Pulling file-monitor  ... done
Pulling pcap-capture  ... done
Pulling upload        ... done
Pulling htadmin       ... done
Pulling nginx-proxy   ... done

user@host:~/Malcolm$ docker images
REPOSITORY                                          TAG                 IMAGE ID            CREATED             SIZE
malcolmnetsec/moloch                                1.4.0               xxxxxxxxxxxx        27 minutes ago      517MB
malcolmnetsec/htadmin                               1.4.0               xxxxxxxxxxxx        2 hours ago         180MB
malcolmnetsec/nginx-proxy                           1.4.0               xxxxxxxxxxxx        4 hours ago         5   3MB
malcolmnetsec/file-upload                           1.4.0               xxxxxxxxxxxx        24 hours ago        198MB
malcolmnetsec/pcap-capture                          1.4.0               xxxxxxxxxxxx        24 hours ago        111MB
malcolmnetsec/file-monitor                          1.4.0               xxxxxxxxxxxx        24 hours ago        355MB
malcolmnetsec/logstash-oss                          1.4.0               xxxxxxxxxxxx        25 hours ago        1.24GB
malcolmnetsec/curator                               1.4.0               xxxxxxxxxxxx        25 hours ago        303MB
malcolmnetsec/kibana-oss                            1.4.0               xxxxxxxxxxxx        33 hours ago        944MB
malcolmnetsec/filebeat-oss                          1.4.0               xxxxxxxxxxxx        11 days ago         459MB
malcolmnetsec/elastalert                            1.4.0               xxxxxxxxxxxx        11 days ago         276MB
docker.elast   ic.co/elasticsearch/elasticsearch-oss   6.8.1               xxxxxxxxxxxx        5 weeks ago         769MB
Finally, we can start Malcolm. When Malcolm starts it will stream informational and debug messages to the console. If you wish, you can safely close the console or use
Ctrl+C to stop these messages; Malcolm will continue running in the background.
user@host:~/Malcolm$ ./scripts/start.sh
Creating network "malcolm_default" with the default driver
Creating malcolm_file-monitor_1  ... done
Creating malcolm_htadmin_1       ... done
Creating malcolm_elasticsearch_1 ... done
Creating malcolm_pcap-capture_1  ... done
Creating malcolm_curator_1       ... done
Creating malcolm_logstash_1      ... done
Creating malcolm_elastalert_1    ... done
Creating malcolm_kibana_1        ... done
Creating malcolm_moloch_1        ... done
Creating malcolm_filebeat_1      ... done
Creating malcolm_upload_1        ... done
Creating malcolm_nginx-proxy_1   ... done

Malcolm started, setting "INITIALIZEDB=false" in "docker-compose.yml" for subsequent runs.

In a few minutes, Malcolm services will be accessible via the following URLs:
------------------------------------------------------------------------------
  - Moloch: https://localhost:443/
  - Kibana: https:/   /localhost:5601/
  - PCAP Upload (web): https://localhost:8443/
  - PCAP Upload (sftp): sftp://username@127.0.0.1:8022/files/
  - Account management: https://localhost:488/

         Name                        Command                       State                                                                          Ports
----------------------------------------------------------------------------------------------------------------------------------------------------------------------------------------------------------------------
malcolm_curator_1         /usr/local/bin/cron_env_deb.sh   Up
malcolm_elastalert_1      /usr/local/bin/elastalert- ...   Up (health: starting)   3030/tcp, 3333/tcp
malcolm_elasticsearch_1   /usr/local/bin/docker-entr ...   Up (health: starting)   9200/tcp, 9300/tcp
malcolm_file-monitor_1    /usr/local/bin/supervisord ...   Up                      3310/tcp
malcolm_filebeat_1        /usr/local/bin/docker-entr ...   Up
malcolm_htadmin_1         /usr/bin/supervisord -c /s ...   Up                      80/tcp
malcolm_kibana_1          /usr/bin/supervisord -   c /e ...   Up (health: starting)   28991/tcp, 5601/tcp
malcolm_logstash_1        /usr/local/bin/logstash-st ...   Up (health: starting)   5000/tcp, 5044/tcp, 9600/tcp
malcolm_moloch_1          /usr/bin/supervisord -c /e ...   Up                      8000/tcp, 8005/tcp, 8081/tcp
malcolm_nginx-proxy_1     /app/docker-entrypoint.sh  ...   Up                      0.0.0.0:28991->28991/tcp, 0.0.0.0:3030->3030/tcp, 0.0.0.0:443->443/tcp, 0.0.0.0:488->488/tcp, 0.0.0.0:5601->5601/tcp, 80/tcp,
                                                                                   0.0.0.0:8443->8443/tcp, 0.0.0.0:9200->9200/tcp, 0.0.0.0:9600->   9600/tcp
malcolm_pcap-capture_1    /usr/local/bin/supervisor.sh     Up
malcolm_upload_1          /docker-entrypoint.sh /usr ...   Up                      127.0.0.1:8022->22/tcp, 80/tcp

Attaching to malcolm_nginx-proxy_1, malcolm_upload_1, malcolm_filebeat_1, malcolm_kibana_1, malcolm_moloch_1, malcolm_elastalert_1, malcolm_logstash_1, malcolm_curator_1, malcolm_elasticsearch_1, malcolm_htadmin_1, malcolm_pcap-capture_1, malcolm_file-monitor_1
…
It will take several minutes for all of Malcolm's components to start up. Logstash will take the longest, probably 5 to 10 minutes. You'll know Logstash is fully ready when you see Logstash spit out a bunch of starting up messages, ending with this:
…
logstash_1  | [2019-06-11T15:45:41,938][INFO ][logstash.pipeline ] Pipeline started successfully {:pipeline_id=>"main", :thread=>"#<Thread:0x7a5910 sleep>"}
logstash_1  | [2019-06-11T15:45:42,009][INFO ][logstash.agent    ] Pipelines running {:count=>3, :running_pipelines=>[:input, :main, :output], :non_running_pipelines=>[]}
logstash_1  | [2019-06-11T15:45:42,599][INFO ][logstash.agent    ] Successfully started Logstash API endpoint {:port=>9600}
…
You can now open a web browser and navigate to one of the
Malcolm user interfaces.
CopyrightMalcolm is Copyright 2019 Battelle Energy Alliance, LLC, and is developed and released through the cooperation of the Cybersecurity and Infrastructure Security Agency of the U.S. Department of Homeland Security.
See
License.txt for the terms of its release.
Contact information of author(s):Seth GroverOther SoftwareIdaho National Laboratory is a cutting edge research facility which is a constantly producing high quality research and software. Feel free to take a look at our other software and scientific offerings at:
Primary Technology Offerings PageSupported Open Source SoftwareRaw Experiment Open Source SoftwareUnsupported Open Source Software![]()