Quantcast
Channel: KitPloit - PenTest Tools!
Viewing all 5816 articles
Browse latest View live

IoT-PT - A Virtual Environment For Pentesting IoT Devices


Sinter - A User-Mode Application Authorization System For MacOS Written In Swift

$
0
0

Sinter is a 100% user-mode endpoint security agent for macOS 10.15 and above, written in Swift.
Sinter uses the user-mode EndpointSecurity API to subscribe to and receive authorization callbacks from the macOS kernel, for a set of security-relevant event types. The current version of Sinter supports allowing/denying process executions; in future versions we intend to support other types of events such as file, socket, and kernel events.
Sinter is a work-in-progress. Feedback is welcome. If you are interested in contributing or sponsoring us to help achieve its potential, let's get in touch.

Features
  • Allow or deny process execution by code directory hash (aka "CD hash")
    • option to deny all unknown programs (any program that is not explicitly allowed)
    • option to deny all unsigned programs
    • option to deny all programs with invalid signatures
  • "monitor" mode to track and log (but allow) all process execution events
  • Accepts allow/deny rules from a Santa sync-server
  • Configure deny rules in JSON, provided locally or by a sync-server
  • Log to the local filesystem in a structured JSON format
Planned upcoming features:

Anti-Features
  • Does not use kernel extensions (which will be officially deprecated in macOS 11 Big Sur)
  • Does not support legacy macOS (10.14 or older)
  • Does not use any memory unsafe code
  • Limits third-party library dependencies
  • Not an anti-malware or anti-virus. No signature database. Denies only what you tell it to deny, using rules.

Background
The first open-source macOS solution for allowing/denying processes was Google Santa. We're fans of Santa, and have contributed to its codebase in the past. For a long time, however, many in the macOS community have asked for an open-source solution to track and manage more than just process events.
We saw the ideal platform to build such a capability with the EndpointSecurity API in macOS 10.15. Starting from the ground-up around a strictly user-mode API meant that we could attempt a simpler design, and use a modern programming language with safer memory handling and better performance. Thus, we set out to develop Sinter, short for "Sinter Klausen," another name for Santa Claus.

Getting Started
Download and install the latest version of Sinter using the pkg installer link from the Releases page.
After installing Sinter, you must enable the "Full Disk Access" permission for Sinter.app. Do this by opening System Preferences, Security, Privacy tab, Full Disk Access. Check the item for Sinter.app. If using MDM, you can automatically enable this permission on your endpoints, and no user interaction will be required.

Configuration
Sinter requires a configuration file to be present at /etc/sinter/config.json. An example is provided in the source tree at ./config/config.json:
{
"Sinter": {
"decision_manager": "local",
"logger": "filesystem",

"allow_unsigned_programs": "true",
"allow_invalid_programs": "true",
"allow_unknown_programs": "true",
"allow_expired_auth_requests": "true",
"allow_misplaced_applications": "true",

"config_update_interval": 600,

"allowed_application_directories": [
"/bin",
"/usr/bin",
"/usr/local/bin",
"/Applications",
"/System",
"/usr/sbin",
"/usr/libexec",
],
},

"FilesystemLogger": {
"log_file_path": "/var/log/sinter.log",
},

"RemoteDecisionManager": {
"server_url": "https://server_address:port",
"machine_identifier": "identifier",
},

"LocalDecisionManager": {
"rule_database_path": "/etc/sinter/rules.json",
}
}
The decision manager plugin can be selected by changing the decision_manager value. The local plugin will enable the LocalDecisionManager configuration section, pointing Sinter to use the local rule database present at the given path. It is possible to use a Santa-compatible sync-server, by using the sync-server plugin instead. This enables the RemoteDecisionManager configuration section, where the server URL and machine identifier can be set.
There are two logger plugins currently implemented:
  1. filesystem: Messages are written to file, using the path specified at FilesystemLogger.log_file_path
  2. unifiedlogging: Logs are emitted using the Unified Logging, using com.trailofbits.sinter as subsystem.

Allowed application directories
It is possible to configure Sinter to log and optionally deny applications that have not been started from an allowed folder.
  • allow_misplaced_applications: If set to true, misplaced applications will only generate a warning. If set to false, any execution that does not starts from a valid path is denied.
  • allowed_application_directories: If non-empty, it will be used to determine if applications are placed in the wrong folder.

Enabling UI notifications
  1. Install the notification server (the PKG installer will do this automatically): sudo /Applications/Sinter.app/Contents/MacOS/Sinter --install-notification-server
  2. Start the agent: /Applications/Sinter.app/Contents/MacOS/Sinter --start-notification-server

Configuring Sinter in MONITOR mode
Modes are not implemented in Sinter, as everything is rule-based. It is possible to implement the monitoring functionality by tweaking the following settings:
  • allow_unsigned_programs: allow applications that are not signed
  • allow_invalid_programs: allow applications that fail the signature check
  • allow_unknown_programs: automatically allow applications that are not covered by the active rule database
  • allow_expired_auth_requests: the EndpointSecurity API requires Sinter to answer to an authorization requests within an unspecified time frame (typically, less than a minute). Large applications, such as Xcode, will take a considerable amount of time to verify. Those executions are denied by default, and the user is expected to try again once the application has been verified. Setting this configuration to true changes this behavior so that those requests are always allowed.

Rule format
Rule databases are written in JSON format. Here's an example database that allows the CMake application bundle from cmake.org:
{
"rules": [
{
"rule_type": "BINARY",
"policy": "ALLOWLIST",
"sha256": "BDD0AF132D89EA4810566B3E1E0D1E48BAC6CF18D0C787054BB62A4938683039",
"custom_msg": "CMake"
}
]
}
Sinter only supports BINARY rules for now, using either ALLOWLIST or DENYLIST policies. The code directory hash value can be taken from the codesign tool output (example: codesign -dvvv /Applications/CMake.app). Note that even though the CLI tools can acquire the full SHA256 hash, the Kernel/EndpointSecurity API is limited to the first 20 bytes.

Building from Source
Building Sinter requires certain code-signing certificates and entitlements that Apple must grant your organization. However, Sinter can still be built from source and run locally on a test system with SIP disabled. For instructions, see the Sinter wiki.


PurpleSharp - C# Adversary Simulation Tool That Executes Adversary Techniques With The Purpose Of Generating Attack Telemetry In Monitored Windows Environments

$
0
0

Defending enterprise networks against attackers continues to present a difficult challenge for blue teams. Prevention has fallen short; improving detection & response capabilities has proven to be a step in the right direction. However, without the telemetry produced by adversary behavior, building new and testing existing detection capabilities will be constrained.
PurpleSharp is an open source adversary simulation tool written in C# that executes adversary techniques within WindowsActive Directory environments. The resulting telemetry can be leveraged to measure and improve the efficacy of a detection engineering program. PurpleSharp leverages the MITRE ATT&CK Framework and executes different techniques across the attack life cycle: execution, persistence, privilege escalation, credential access, lateral movement, etc. It currently supports 37 unique ATT&CK techniques.

PurpleSharp was first presented at Derbycon IX on September 2019.
An updated version was released on August 6th 2020 as part of BlackHat Arsenal 2020. If you want to jump straight to the demos:

Demo 1


Demo 2


Goals / Use Cases
The attack telemetry produced by simulating techniques with PurpleSharp aids detection teams in:
  • Building new detecttion analytics
  • Testing existing detection analytics
  • Validating detection resiliency
  • Identifying gaps in visibility
  • Identifing issues with event logging pipeline

Quick Start Guide
PurpleSharp can be built with Visual Studio Community 2019 or 2020.

Documentation
https://purplesharp.readthedocs.io/

Authors

Acknowledgments
The community is a great source of ideas and feedback. Thank you all.


Kali Linux 2020.3 Release - Penetration Testing and Ethical Hacking Linux Distribution

$
0
0

Time for another Kali Linux release! Quarter #3 – Kali Linux 20202.3. This release has various impressive updates.

A quick overview of what’s new since the last release in May 2020:

  • New ShellStarting the process to switch from “Bash” to “ZSH
  • The release of “Win-Kex” – Get ready WSL2
  • Automating HiDPI support – Easy switching mode
  • Tool IconsEvery default tool now has its own unique icon
  • Bluetooth ArsenalNew set of tools for Kali NetHunter
  • Nokia SupportNew devices for Kali NetHunter
  • Setup ProcessNo more missing network repositories and quicker installs


More info here.


Pagodo - Automate Google Hacking Database Scraping And Searching

$
0
0

The goal of this project was to develop a passive Google dork script to collect potentially vulnerable web pages and applications on the Internet. There are 2 parts. The first is ghdb_scraper.py that retrieves Google Dorks and the second portion is pagodo.py that leverages the information gathered by ghdb_scraper.py.

What are Google Dorks?
The awesome folks at Offensive Security maintain the Google Hacking Database (GHDB) found here: https://www.exploit-db.com/google-hacking-database. It is a collection of Google searches, called dorks, that can be used to find potentially vulnerable boxes or other juicy info that is picked up by Google's search bots.

Installation
Scripts are written for Python 3.6+. Clone the git repository and install the requirements.
git clone https://github.com/opsdisk/pagodo.git
cd pagodo
virtualenv -p python3 .venv # If using a virtual environment.
source .venv/bin/activate # If using a virtual environment.
pip install -r requirements.txt

Google is blocking me!
If you start getting HTTP 503 errors, Google has rightfully detected you as a bot and will block your IP for a set period of time. The solution is to use proxychains and a bank of proxies to round robin the lookups.
Install proxychains4
apt install proxychains4 -y
Edit the /etc/proxychains4.conf configuration file to round robin the look ups through different proxy servers. In the example below, 2 different dynamic socks proxies have been set up with different local listening ports (9050 and 9051). Don't know how to utilize SSH and dynamic socks proxies? Do yourself a favor and pick up a copy of The Cyber Plumber's Handbook to learn all about Secure Shell (SSH) tunneling, port redirection, and bending traffic like a boss.
vim /etc/proxychains4.conf
round_robin
chain_len = 1
proxy_dns
remote_dns_subnet 224
tcp_read_time_out 15000
tcp_connect_time_out 8000
[ProxyList]
socks4 127.0.0.1 9050
socks4 127.0.0.1 9051
Throw proxychains4 in front of the Python script and each lookup will go through a different proxy (and thus source from a different IP). You could even tune down the -e delay time because you will be leveraging different proxy boxes.
proxychains4 python3 pagodo.py -g ALL_dorks.txt -s -e 17.0 -l 700 -j 1.1

ghdb_scraper.py
To start off, pagodo.py needs a list of all the current Google dorks. A datetimestamped file with the Google dorks and the indididual dork category dorks are also provided in the repo. Fortunately, the entire database can be pulled back with 1 GET request using ghdb_scraper.py. You can dump all dorks to a file, the individual dork categories to separate dork files, or the entire json blob if you want more contextual data about the dork.
To retrieve all dorks
python3 ghdb_scraper.py -j -s
To retrieve all dorks and write them to individual categories:
python3 ghdb_scraper.py -i
Dork categories:
categories = {      1: "Footholds",      2: "File Containing Usernames",      3: "Sensitives Directories",      4: "Web Server Detection",      5: "Vulnerable Files",      6: "Vulnerable Servers",      7: "Error Messages",      8: "File Containing Juicy Info",      9: "File Containing Passwords",      10: "Sensitive Online Shopping Info",      11: "Network or Vulnerability Data",      12: "Pages Containing Login Portals",      13: "Various Online devices",      14: "Advisories and Vulnerabilities",  }  

pagodo.py
Now that a file with the most recent Google dorks exists, it can be fed into pagodo.py using the -g switch to start collecting potentially vulnerable public applications. pagodo.py leverages the googlepython library to search Google for sites with the Google dork, such as:
intitle:"ListMail Login" admin -demo  
The -d switch can be used to specify a domain and functions as the Google search operator:
site:example.com  
Performing ~4600 search requests to Google as fast as possible will simply not work. Google will rightfully detect it as a bot and block your IP for a set period of time. In order to make the search queries appear more human, a couple of enhancements have been made. A pull request was made and accepted by the maintainer of the Python google module to allow for User-Agent randomization in the Google search queries. This feature is available in 1.9.3 and allows you to randomize the different user agents used for each search. This emulates the different browsers used in a large corporate environment.
The second enhancement focuses on randomizing the time between search queries. A minimum delay is specified using the -e option and a jitter factor is used to add time on to the minimum delay number. A list of 50 jitter times is created and one is randomly appended to the minimum delay time for each Google dork search.
categories = {
1: "Footholds",
2: "File Containing Usernames",
3: "Sensitives Directories",
4: "Web Server Detection",
5: "Vulnerable Files",
6: "Vulnerable Servers",
7: "Error Messages",
8: "File Containing Juicy Info",
9: "File Containing Passwords",
10: "Sensitive Online Shopping Info",
11: "Network or Vulnerability Data",
12: "Pages Containing Login Portals",
13: "Various Online devices",
14: "Advisories and Vulnerabilities",
}
Latter in the script, a random time is selected from the jitter array and added to the delay.
intitle:"ListMail Login" admin -demo
Experiment with the values, but the defaults successfully worked without Google blocking my IP. Note that it could take a few days (3 on average) to run so be sure you have the time.
To run it:
site:example.com

Conclusion
Comments, suggestions, and improvements are always welcome. Be sure to follow @opsdisk on Twitter for the latest updates.


ReconSpider - Most Advanced Open Source Intelligence (OSINT) Framework For Scanning IP Address, Emails, Websites, Organizations

$
0
0

ReconSpider is most Advanced Open Source Intelligence (OSINT) Framework for scanning IP Address, Emails, Websites, Organizations and find out information from different sources.
ReconSpider can be used by Infosec Researchers, Penetration Testers, Bug Hunters and Cyber Crime Investigators to find deep information about their target.
ReconSpider aggregate all the raw data, visualize it on a dashboard and facilitate alerting and monitoring on the data.
Recon Spider also combines the capabilities of Wave,Photon and Recon Dog to do a comprehensive enumeration of attack surface.

Why it's called ReconSpider ?
ReconSpider = Recon + Spider
Recon = Reconnaissance
Reconnaissance is a mission to obtain information by various detection methods, about the activities and resources of an enemy or potential enemy, or geographic characteristics of a particular area.
Spider = Web crawler
A Web crawler, sometimes called a spider or spiderbot and often shortened to crawler, is an Internet bot that systematically browses the World Wide Web, typically for the purpose of Web indexing (web spidering).

Overview of the tool:
  • Performs OSINT scan on a IP Address, Emails, Websites, Organizations and find out information from different sources.
  • Correlates and collaborate the results, show them in a consolidated manner.
  • Use specific script / launch automated OSINT for consolidated data.
  • Currently available in only Command Line Interface (CLI).

Mind Map (v1)
Check out our mind map to see visually organize information of this tool regarding api, services and techniques and more.
http://bhavkaran.com/reconspider/mindmap.html

ReconSpider Banner
__________                               _________       __     ___            
\______ \ ____ ____ ____ ____ / _____/_____ |__| __| _/___________
| _// __ \_/ ___\/ _ \ / \ \_____ \\____ \| |/ __ |/ __ \_ __ \
| | \ ___/\ \__( <_> ) | \ / \ |_> > / /_/ \ ___/| | \/
|____|_ /\___ >\___ >____/|___| / /_______ / __/|__\____ |\___ >__|
\/ \/ \/ \/ \/|__| \/ \/

developer: https://bhavkaran.com


ENTER 0 - 13 TO SELECT OPTIONS

1. IP Enumerate information from IP Address
2. DOMAIN Gather information about given DOMAIN
3. PHONENUMBER Gather information about Phonenumber
4. DNS MAP Map DNS records associated with target
5. METADATA Extr act all metadata of the given file
6. REVERSE IMAGE SEARCH Obtain domain name or IP address mapping
7. HONEYPOT Check if it's honeypot or a real system
8. MAC ADDRESS LOOKUP Obtain information about give Macaddress
9. IPHEATMAP Draw out heatmap of locations of IP
10. TORRENT Gather torrent download history of IP
11. USERNAME Extract Account info. from social media
12. IP2PROXY Check whether IP uses any VPN / PROXY
13. MAIL BREACH Checks given domain has breached Mail
99. UPDATE Update ReconSpider to its latest version

0. EXIT Exit from ReconSpider to your terminal

Documentation
Installing and using ReconSpider is very easy. Installation process is very simple.
  1. Downloading or cloning ReconSpider github repository.
  2. Installing all dependencies.
Let's Begin !!

Setting up the environment (Linux Operating System)
Step 1 - Cloning ReconSpider on your linux system.
In order to download ReconSpider simply clone the github repository. Below is the command which you can use in order to clone ReconSpider repository.
git clone https://github.com/bhavsec/reconspider.git
Step 2 - Make sure python3 and python3-pip is installed on your system.
You can also perform a check by typing this command in your terminal.
sudo apt install python3 python3-pip
Step 3 - Installing all dependencies.
Once you clone and check python installation, you will find directory name as reconspider. Just go to that directory and install using these commands:
cd reconspider
sudo python3 setup.py install

Setting up the environment (Windows Operating System)
Step 1 - Downloading ReconSpider on your windows system.
In order to download ReconSpider from github repository simply copy and paste this URL in your favourite browser.
https://github.com/bhavsec/reconspider/archive/master.zip
Step 2 - Unzipping the file
Once you download, you will find zipped file name as datasploit-master.zip. Just right click on that zipped file and unzip the file using any software like WinZip, WinRAR.
Step 2 - Installing all dependencies.
After unzipping, go to that directory using Command Prompt and type the following command.
python3 setup.py install
Step 3 - Database
IP2Proxy Database
https://lite.ip2location.com/database/px8-ip-proxytype-country-region-city-isp-domain-usagetype-asn-lastseen
Download database, extract it and move to reconspider/plugins/ directory.

Usage
ReconSpider is very handy tool and easy to use. All you have to do is just have to pass values to parameter. In order to start ReconSpider just type:
python3 reconspider.py
1. IP
This option gathers all the information of given IP Address from public resources.
ReconSpider >> 1
IP >> 8.8.8.8
2. DOMAIN
This option gathers all the information of given URL Address and check for vulneribility.
Reconspider >> 2
HOST (URL / IP) >> vulnweb.com
PORT >> 443
3. PHONENUMBER
This option allows you to gather information of given phonenumber.
Reconspider >> 3
PHONE NUMBER (919485247632) >>
4. DNS MAP
This option allows you to map an organizations attack surface with a virtual DNS Map of the DNS records associated with the target organization.
ReconSpider >> 4
DNS MAP (URL) >> vulnweb.com
5. METADATA
This option allows you to extract all metadat of the file.
Reconspider >> 5
Metadata (PATH) >> /root/Downloads/images.jpeg
6. REVERSE IMAGE SEARCH
This option allows you to obtain information and similar image that are available in internet.
Reconspider >> 6
REVERSE IMAGE SEARCH (PATH) >> /root/Downloads/images.jpeg
Open Search Result in web broser? (Y/N) : y
7. HONEYPOT
This option allows you to identify honeypots! The probability that an IP is a honeypot is captured in a "Honeyscore" value that can range from 0.0 to 1.0
ReconSpider >> 7
HONEYPOT (IP) >> 1.1.1.1
8. MAC ADDRESS LOOKUP
This option allows you to identify Mac address details who is manufacturer, address, country, etc.
Reconspider >> 8
MAC ADDRESS LOOKUP (Eg:08:00:69:02:01:FC) >>
9. IPHEATMAP
This option provided you heatmap of the provided ip or single ip, if connect all the provided ip location with accurate Coordinator.
Reconspider >> 9

1) Trace single IP
2) Trace multiple IPs
OPTIONS >>
10. TORRENT
This option allows you to gathers history of Torrent download history.
Reconspider >> 10
IPADDRESS (Eg:192.168.1.1) >>
11. USERNAME
This option allows you to gathers account information of the provided username from social media like Instagram, Twitter, Facebook.
Reconspider >> 11

1.Facebook
2.Twitter
3.Instagram

Username >>
12. IP2PROXY
This option allows you to identify whether IP address uses any kind of VPN / Proxy to hide his identify.
Reconspider >> 12
IPADDRESS (Eg:192.168.1.1) >>
13. MAIL BREACH
This option allows you to identify all breached mail ID from given domain.
Reconspider >> 13
DOMAIN (Eg:intercom.io) >>
99. UPDATE
This option allows you to check for updates. If a newer version will available, ReconSpider will download and merge the updates into the current directory without overwriting other files.
ReconSpider >> 99
Checking for updates..
0. EXIT
This option allows you to exit from ReconSpider Framework to your current Operating System's terminal.
ReconSpider >> 0
Bye, See ya again..

Contact Developer
Do you want to have a conversation in private?
Twitter:            @bhavsec
Facebook: fb.com/bhavsec
Instagram: instagram.com/bhavsec
LinkedIn: linkedin.com/in/bhavsec
Email: contact@bhavkaran.com
Website: bhavkaran.com

ReconSpider Full Wiki and How-to Guide
Please go through the ReconSpider Wiki Guide for a detailed explanation of each and every option and feature.

Frequent & Seamless Updates
ReconSpider is under heavy development and updates for fixing bugs. optimizing performance& new features are being rolled regularly. Custom error handling is also not implemented, and all the focus is to create required functionality.
If you would like to see features and issues that are being worked on, you can do that on Development Progress project board.

Special Thanks


DropEngine - Malleable Payloads!

$
0
0


By @s0lst1c3

Disclaimer
DropEngine (the "Software") and associated documentation is provided “AS IS”. The Developer makes no other warranties, express or implied, and hereby disclaims all implied warranties, including any warranty of merchantability and warranty of fitness for a particular purpose. Any actions or activities related to the use of the Software are the sole responsibility of the end user. The Developer will not be held responsible in the event that any criminal charges are brought against any individuals using or misusing the Software. It is up to the end user to use the Software in an authorized manner and to ensure that their use complies with all applicable laws and regulations.

Install
Clone the git repo:
git clone https://github.com/s0lst1c3/dropengine.git
Create a new virtual env:
python3.7 -m venv venv 
Activate the virtual env:
source venv/bin/activate

Constructing a Basic Payload

Module Selection
DropEngine accepts a list of module names from the command line and uses them to construct a payload. To make things a bit easier to follow, this guide will walk you through the process of listing the various types of modules needed to create a basic payload. Keep in mind that we're not actually executing anything yet. We're just seeing what modules are available and describing what they do.
First, we need to decide what kind of shellcode runner we want to use. To get a list of available shellcode runners, use the --list runners flag:
Command:
python dropengine.py --list runners
Example Output:
(venv) s0lst1c3@DESKTOP-NC0U49D:/mnt/c/Users/s0lst1c3/obfuscation$ python dropengine.py --list runners

Listing runners:

runner - basic_csharp_runner
runner - basic_csharp_runner_no_mutation
runner - csharp_installutil
runner - msbuild_csharp_runner

(venv) s0lst1c3@DESKTOP-NC0U49D:/mnt/c/Users/s0lst1c3/obfuscation$
We'll go ahead and plan to use the "msbuild_csharp_runner", which will give us an MSBuild payload written in C#.
Next, we'll need to select an interface module that is compatible with our shellcode runner. In DropEngine, you can think of interfaces as the "glue" that binds your payload together. The interface facilitates communication between you (the user), and between the various modules in your payload.
To get a list of available interfaces, use the --list interfaces flag as shown in the following example:
Command:
python dropengine.py --list interfaces
Example Output:
(venv) s0lst1c3@DESKTOP-NC0U49D:/mnt/c/Users/s0lst1c3/obfuscation$ python dropengine.py --list interfaces

Listing interfaces:

runner_interface - csharp_runner_interface - Interface for generating CSharp payloads
As you can see from the Example Output shown above, the only available interface at this time is the csharp_runner_interface, which is designed for building payloads using C#.
Next, let's decide on a crypter to protect our shellcode. To obtain a list of available crypters, use the --list crypters flag as shown below:
Command:
python dropengine.py --list crypters
Example Output:
(venv) s0lst1c3@DESKTOP-NC0U49D:/mnt/c/Users/s0lst1c3/obfuscation$ python dropengine.py --list crypters 

Listing crypters:

crypter - crypter_aes

(venv) s0lst1c3@DESKTOP-NC0U49D:/mnt/c/Users/s0lst1c3/obfuscation$
As with our interfaces, we really only have one crypter module available at this time, and that's "crypter_aes".
We'll also need a decrypter module to convert our shellcode back into plaintext. To get a list of decrypters, use the --list decrypters command:
Command:
decrypter - decrypter_csharp_rijndael_aes
Example Output:
(venv) s0lst1c3@DESKTOP-NC0U49D:/mnt/c/Users/s0lst1c3/obfuscation$ python dropengine.py --list decrypters

Listing decrypters:

decrypter - decrypter_csharp_rijndael_aes

(venv) s0lst1c3@DESKTOP-NC0U49D:/mnt/c/Users/s0lst1c3/obfuscation$
We'll go ahead and use the "decrypter_csharp_rijndael_aes", since it's compatible with our crypter module.
Now we need to select encryption and decryption key modules to use with our selected crypter and decrypter. To list all available crypters and decrypters, use the --list ekeys dkeys command as shown below:
Command:
 python dropengine.py --list ekeys dkeys
Example Output:
(venv) s0lst1c3@DESKTOP-NC0U49D:/mnt/c/Users/s0lst1c3/obfuscation$ python dropengine.py --list ekeys dkeys

Listing ekeys:

ekey - ekey_env_ad_domain_name
ekey - ekey_env_ext_fqdn
ekey - ekey_env_ext_ip
ekey - ekey_env_hd_serial
ekey - ekey_env_int_fqdn
ekey - ekey_env_int_hostname
ekey - ekey_env_mac_addr
ekey - ekey_env_mac_oui
ekey - ekey_env_moonphase
ekey - ekey_env_timezone
ekey - ekey_env_username
ekey - ekey_env_vol_serial
ekey - ekey_one_time_remote_http
ekey - ekey_static

Listing dkeys:

dkey - dkey_csharp_static
dkey - dkey_csharp_env_ad_domain_name
dkey - dkey_env_csharp_ext_fqdn
dkey - dkey_env_csharp_ext_ip
dkey - dkey_env_csharp_hd_serial
dkey - dkey_env_csharp_int_fqdn
dkey - dkey_env_csharp_int_hostname
dkey - dkey_env_c sharp_mac_addr
dkey - dkey_env_csharp_mac_oui
dkey - dkey_env_csharp_moonphase
dkey - dkey_env_csharp_timezone
dkey - dkey_env_csharp_username
dkey - dkey_env_csharp_vol_serial
dkey - dkey_remote_csharp_otk_http

(venv) s0lst1c3@DESKTOP-NC0U49D:/mnt/c/Users/s0lst1c3/obfuscation$
Let's keep things simple for now and use the two static key modules: "dkey_csharp_static" and "ekey_static".
Next, we need to select an executor module to execute our raw shellcode. To get a list of available executors:
Command:
python dropengine.py --list executors
Example Output:
(venv) s0lst1c3@DESKTOP-NC0U49D:/mnt/c/Users/s0lst1c3/obfuscation$ python dropengine.py --list executors

Listing executors:

executor - executor_csharp_virtual_alloc_thread

(venv) s0lst1c3@DESKTOP-NC0U49D:/mnt/c/Users/s0lst1c3/obfuscation$
At this time, our only compatible executor is "executor_csharp_virtual_alloc_thread", so we'll use that.
Finally, we just need to select a mutator module to perform symbol transformation on our completed payload. To get a list of available mutators, use the --list mutators command:
Command:
python dropengine.py --list mutators
Example Output:
(venv) s0lst1c3@DESKTOP-NC0U49D:/mnt/c/Users/s0lst1c3/obfuscation$ python dropengine.py --list mutators

Listing mutators:

mutator - mutator_null
mutator - mutator_random_string
mutator - mutator_rot13
mutator - mutator_wordlist

(venv) s0lst1c3@DESKTOP-NC0U49D:/mnt/c/Users/s0lst1c3/obfuscation$
We'll go ahead and use the "mutator_random_string" module.
Select a runne here

Creating the Payload
We've now explored the various payload components available to us and selected the ones we want to use. Now it's time to create our payload. Recall that in the previous section we made the following sections:
  • interface - csharp_runner_interface
  • crypter - crypter_aes
  • decrypter - decrypter_csharp_rijndael_aes
  • encryption key - ekey_static
  • decryption key - dkey_csharp_static
  • executor - executor_csharp_virtual_alloc_thread
  • mutator mutator_random_string
To run DropEngine with these selections, use the following command (note that the --shellcode flag should point to your shellcode, and the -o flag will specify the output path):
(venv) s0lst1c3@DESKTOP-NC0U49D:/mnt/c/Users/s0lst1c3/obfuscation$ python dropengine.py --interface csharp_runner_interface \
--crypter crypter_aes \
--decrypter decrypter_csharp_rijndael_aes \
--ekey ekey_static \
--runner msbuild_csharp_runner \
--dkey dkey_csharp_static \
--executor executor_csharp_virtual_alloc_thread \
--mutator mutator_random_string \
--shellcode shell.bin \
--o example.csproj

Acknowledgements
This tool either builds upon, is inspired by, or directly incorporates prior research and development from the following awesome people:
Applocker Bypasses
Enivoronmental Keying
Remote Keying
Payload Obfuscation
Dynamic Imports and Modular Design Patterns
Sandbox Evasion


Wonitor - Fast, Zero Config Web Endpoint Change Monitor

$
0
0

fast, zero config web endpoint change monitor. for comparing responses, a selected list of http headers and the full response body is stored on a local key/value store file. no configuration needed.
  • to increase network throughput, a --worker flag allows to set the concurrency when monitoring.
  • endpoints returning a javascript content type will be beautified by default.
  • using --headersOnly when adding a URL allows to only monitor response headers.

installation
Install via go or binary release:
go get -u github.com/rverton/wonitor

usage
λ $ ./wonitor
NAME:
wonitor - web monitor

USAGE:
wonitor [global options] command [command options] [arguments...]

COMMANDS:
add, a add endpoint to monitor
delete, d deletes an endpoint
get, g get endpoint body
list, l list all monitored endpoints and their body size in bytes
monitor, m retrieve all urls and compare them
help, h Shows a list of commands or help for one command

GLOBAL OPTIONS:
--help, -h show help (default: false)

λ $ ./wonitor add --url https://unlink.io/
+ https://unlink.io/
λ $ ./wonitor monitor --save
[https://unlink.io/] 1576b diff:
--- Original
+++ Current
@@ -1 +1,47 @@
+HTTP/1.1 200 OK
+Content-Type: text/html
+Server: nginx/1.10.3 (Ubuntu)
+X-Frame-Options: DENY

+<h tml>
+<body>
+<pre>
[... snip ...]
+</pre>
+</body>
+</html>
+

λ $ ./wonitor monitor --save
λ $ # no output because no change detected

endpoint diffing
The following headers are also included in the saved response and monitored for changes:
var headerToInclude = []string{
"Host",
"Content-Length",
"Content-Type",
"Location",
"Access-Control-Allow-Origin",
"Access-Control-Allow-Methods",
"Access-Control-Expose-Headers",
"Access-Control-Allow-Credentials",
"Allow",
"Content-Security-Policy",
"Proxy-Authenticate",
"Server",
"WWW-Authenticate",
"X-Frame-Options",
"X-Powered-By",
}


ADBSploit - A Python Based Tool For Exploiting And Managing Android Devices Via ADB

$
0
0

A python based tool for exploiting and managing Android devices via ADB

Currently on development
  • Screenrecord
  • Stream Screenrecord
  • Extract Contacts
  • Extract SMS
  • Extract Messasing App Chats WhatsApp/Telegram/Line
  • Install Backdoor
  • And more...

Installation
# First Download or clone repo
git clone https://github.com/mesquidar/adbsploit.git
# Move to the directory
cd adbsploit
# Install it
python setup.py install
# Excute
adbsploit
# Enjoy!!

Requirements
  • Python 3.X

Usage
  • Execute the commad: devices
  • Then select the device with: select
  • You can connect to device using the command: connect
  • Type help for more information

Functionalities

v0.2

Added:
  • Fixed setup and installation
  • Extract Contacts
  • Extract SMS
  • Send SMS
  • Recovery Mode
  • Fastboot Mode
  • Device Info
  • Kill Process

v0.1
  • List Devices
  • Connect Devices
  • TCPIP
  • Forward Ports
  • Airplane Managment
  • Wifi Managment
  • Sound Control
  • List/Info Apps
  • WPA Supplicant Extraction
  • Install/Uninstall Apps
  • Shutdown/Reboot
  • Logs
  • Start/Stop/Clear Apps
  • Show Inet/MAC
  • Battery Status
  • Netstat
  • Check/Unlock/Lock Screen
  • Turn On/Off Screen
  • Swipe Screen
  • Screencapture
  • Send Keyevent
  • Open Browser URL
  • Process List
  • Dump Meminfo/Hierarchy


SecGen - Create Randomly Insecure VMs

$
0
0

SecGen creates vulnerable virtual machines, lab environments, and hacking challenges, so students can learn security penetration testing techniques.
Boxes like Metasploitable2 are always the same, this project uses Vagrant, Puppet, and Ruby to create randomly vulnerable virtual machines that can be used for learning or for hosting CTF events.
The latest version is available at: http://github.com/cliffe/SecGen/
Please complete a short survey to tell us how you are using SecGen.

Introduction
Computer security students benefit from engaging in hacking challenges. Practical lab work and pre-configured hacking challenges are common practice both in security education and also as a pastime for security-minded individuals. Competitive hacking challenges, such as capture the flag (CTF) competitions have become a mainstay at industry conferences and are the focus of large online communities. Virtual machines (VMs) provide an effective way of sharing targets for hacking, and can be designed in order to test the skills of the attacker. Websites such as Vulnhub host pre-configured hacking challenge VMs and are a valuable resource for those learning and advancing their skills in computer security. However, developing these hacking challenges is time consuming, and once created, essentially static. That is, once the challenge has been "solved" there is no remaining ch allenge for the student, and if the challenge is created for a competition or assessment, the challenge cannot be reused without risking plagiarism, and collusion.
Security Scenario Generator (SecGen) generates randomised vulnerable systems. VMs are created based on a scenario specification, which describes the constraints and properties of the VMs to be created. For example, a scenario could specify the creation of a system with a remotely exploitable vulnerability that would result in user-level compromise, and a locally exploitable flaw that would result in root-level compromise. This would require the attacker to discover and exploit both randomly selected vulnerabilities in order to obtain root access to the system. Alternatively, the scenario that is defined can be more specific, specifying certain kinds of services (such as FTP or SMB) or even exact vulnerabilities (by CVE).
SecGen is a Ruby application, with an XML configuration language. SecGen reads its configuration, including the available vulnerabilities, services, networks, users, and content, reads the definition of the requested scenario, applies logic for randomising the scenario, and leverages Puppet and Vagrant to provision the required VMs.

License
SecGen is free software: you can redistribute it and/or modify it under the terms of the GNU General Public License as published by the Free Software Foundation, either version 3 of the License, or (at your option) any later version.
SecGen contains modules, which install various software packages. Each SecGen module may contain or remotely source software, and each module defines its own license in the accompanying secgen_metadata.xml file.

Installation
SecGen is developed and tested on Ubuntu Linux. In theory, SecGen should run on Mac or Windows, if you have all the required software installed.
You will need to install the following:

On Ubuntu (16.04) these commands will get you up and running
Install all the required packages:
# install a recent version of vagrant
wget https://releases.hashicorp.com/vagrant/1.9.8/vagrant_1.9.8_x86_64.deb
sudo apt install ./vagrant_1.9.8_x86_64.deb
# install other required packages via repos
sudo apt-get install ruby-dev zlib1g-dev liblzma-dev build-essential patch virtualbox ruby-bundler imagemagick libmagickwand-dev exiftool libpq-dev libcurl4-openssl-dev libxml2-dev graphviz graphviz-dev libpcap0.8-dev git
Copy SecGen to a directory of your choosing, such as /home/user/bin/SecGen
Then install gems:
cd /home/user/bin/SecGen
bundle install
To use the Windows basesboxes you will need to install Packer. Use the following command:
curl -SL https://releases.hashicorp.com/packer/1.3.2/packer_1.3.2_linux_amd64.zip -o packer_1.3.2_linux_amd64.zip
unzip packer_1.3.2_linux_amd64.zip
sudo mv packer /usr/local/
sudo bash -c 'echo "export PATH=\"\$PATH:/usr/local/\"" >> /etc/environment'
sudo vagrant plugin install winrm
sudo vagrant plugin install winrm-fs

Usage
Basic usage:
ruby secgen.rb run
This will use the default scenario to randomly generate VM(s).


SecGen accepts arguments to change the way that it behaves, the currently implemented arguments are:
   ruby secgen.rb [--options] <command>
OPTIONS:
--scenario [xml file], -s [xml file]: Set the scenario to use
(defaults to /home/secgen/SecGen/scenarios/default_scenario.xml)
--project [output dir], -p [output dir]: Directory for the generated project
(output will default to /home/secgen/SecGen/projects/SecGen20200313_094915)
--shutdown: Shutdown VMs after provisioning (vagrant halt)
--network-ranges: Override network ranges within the scenario, use a comma-separated list
--forensic-image-type [image type]: Forensic image format of generated image (raw, ewf)
--read-options [conf path]: Reads options stored in file as arguments (see example.conf)
--memory-per-vm: Allocate generated VMs memory in MB (e.g. --memory-per-vm 1024)
--total-memory: Allocate total VM memory for the scenario, split evenly across all VMs.
--cpu-cores: Number of virtu al CPUs for generated VMs
--help, -h: Shows this usage information
--system, -y [system_name]: Only build this system_name from the scenario
--snapshot: Creates a snapshot of VMs once built
--no-tests: Prevent post-provisioning tests from running.

VIRTUALBOX OPTIONS:
--gui-output, -g: Show the running VM (not headless)
--nopae: Disable PAE support
--hwvirtex: Enable HW virtex support
--vtxvpid: Enable VTX support
--max-cpu-usage [1-100]: Controls how much cpu time a virtual CPU can use
(e.g. 50 implies a single virtual CPU can use up to 50% of a single host CPU)

OVIRT OPTIONS:
--ovirtuser [ovirt_username]
--ovirtpass [ovirt_password]
--ovirt-url [ovirt_api_url]
--ovirtauthz [ovirt authz]
--ovirt-cluster [ovirt_cluster]
--ovirt-network [ovirt_network_name]
--ovirt-affinity-group [ovirt _affinity_group_name]

ESXI OPTIONS:
--esxiuser [esxi_username]
--esxipass [esxi_password]
--esxi-url [esxi_api_url]
--esxi-datastore [esxi_datastore]
--esxi-disktype [esxi_disktype]
--esxi-network [esxi_network_name]

COMMANDS:
run, r: Builds project and then builds the VMs
build-project, p: Builds project (vagrant and puppet config), but does not build VMs
build-vms, v: Builds VMs from a previously generated project
(use in combination with --project [dir])
ovirt-post-build: only performs the ovirt actions that normally follow a successful vm build
(snapshots and networking)
create-forensic-image: Builds forensic images from a previously generated project
(can be used in combination with --project [dir])
list-scenarios: Lists all scenarios that can be used with the --scenario option
list-projects: Lists all projects that can be used with the --project option
delete-all-projects: Deletes all current projects in the projects directory

Scenarios
SecGen generates VMs based on a scenario specification, which describes the constraints and properties of the VMs to be created.

Using existing scenarios
Existing scenarios make SecGen's barrier for entry low: when invoking SecGen, a scenario can be specified as a command argument, and SecGen will then read the appropriate scenario definition and go about randomisation and VM generation. This removes the requirement for end users of the framework to understand SecGen's configuration specification.
Scenarios can be found in the scenarios/ directory. For example, to spin up a VM that has a random remotly exploitable vulnerability that results in user-level compromise:
   ruby secgen.rb --scenario scenarios/examples/remotely_exploitable_user_vulnerability.xml run


VMs for a security audit of an organisation
To generate a set of VMs for a randomly generated fictional organisation, with a desktop system, webserver, and intranet server:
   ruby secgen.rb --scenario scenarios/security_audit/team_project.xml run
Note that the intranet server has a security remit, with instructions on performing a security audit of these systems. The desktop system can access the intranet to access the remit, but the attacker VM (for example, Kali) can be connected to the NIC only shared by the Web server to simulate the need to pivot attacks through the Web server, as they can't connect to the intranet system directly. The "marking guide" is in the form of the output scenario.xml in the project directory, which provides the details of the systems generated.

VMs for a CTF event
To generate a set of VMs for a CTF competition:
   ruby secgen.rb --scenario scenarios/ctf/flawed_fortress_1.xml run
Note that a 'CTFd_importable.zip' file is also generated, containing all the flags and hints, which you can import into the CTFd scoreboard frontend. This is compatible with CTFd v2.0.2 and newer.
Default admin account: Username: adminusername Password: adminpassword

Defining new scenarios
Writing your own scenarios enables you to define a VM or set of VMs with a configuration as specific or general as desired.
SecGen's scenario specification is a powerful interface for specifying the constraints of the vulnerable systems to generate. Scenarios are defined in XML configuration files that specify systems in terms of a base, services/utilities, vulnerabilities, and networks.
For details please see the Creating Scenarios guide.

Modules
SecGen is designed to be easily extendable with modules that define vulnerabilities and other kinds of software, configuration, and content changes.
The types of modules supported in SecGen are:
  • base: a SecGen module that defines the OS platform (VM template) used to build the VM
  • vulnerability: a SecGen module that adds an insecure, hackable, state (including realistic software vulnerabilities known to be in the wild or fabricated hacking challenges)
  • service: a SecGen module that adds a (relatively secure) network service
  • utility: a SecGen module that adds (relatively secure) software or configuration changes
  • network: a virtual network card
  • generator: generates output, such as random text
  • encoder: receives input, such as text, performs operations on that to produce output (such as, encoding/encryption/selection)
Each vulnerability module is contained within the modules/vulnerabilies directory tree, which is organised to match the Metasploit Framework (MSF) modules directory structure. For example, the distcc_exec vulnerability module is contained within: modules/vulnerabilities/unix/misc/distcc_exec/.
The root of the module directory always contains a secgen_metadata.xml file and also contains puppet files, which are used to make a system vulnerable.
For details please see the Modules Metadata guide.

Generators and encoders create and alter content
Encoders and generators have code that is evaluated at project build time, such as encoding text, and generating flags and other potentially randomised content. In each case, this is a ruby script located within the module directory in local/secgen_local.rb. Although normally called by SecGen, secgen_local.rb scripts can be executed directly, and accept all the parameter inputs as command line arguments, and returns the output in JSON format to stdout. Other human readable output is written to stderr.
#ruby modules/encoders/string/base64/secgen_local/local.rb --strings_to_encode "encode this" --strings_to_encode "and this"
BASE64 Encoder
Encoding '["encode this", "and this"]'
Encoded: ["ZW5jb2RlIHRoaXM=", "YW5kIHRoaXM="]
["ZW5jb2RlIHRoaXM=","YW5kIHRoaXM="]


Puppet is used to provision the VMs
Each vulnerability, service, and utility module contains Puppet files which are used to provision the software and configuration changes onto the VMs. By the time Puppet is executed to provision VMs, all randomisation has previously taken place at build time.
For details please see the Modules Puppet guide.

SecGen project output
By default output is to 'projects/SecGen_[CurrentTime]/'
The project output includes:
  • A Vagrant configuration for spinning up the boxes.
  • A directory containing all the required puppet modules for the above. A Librarian-Puppet file is created to manage modules, and some required modules may be obtained via PuppetForge, and therefore an Internet connection is required when building the project.
  • A de-randomised scenario XML file. Using SecGen you can use this 'scenario.xml' file to recreate the above Vagrant config and puppet files. Any randomisation that has been applied should be un-randomised in this output (compared to the original scenario file). This file contains all the details of the systems created, and can also be used later for grading, scoring, or giving hints.
  • A 'flag_hints.xml' file, containing all the flags along with multiple hints per flag.
  • A 'CTFd_importable.zip' file useful for CTF events, for import into the CTFd scoreboard frontend.
If you start SecGen with the "build-project" (or "p") command it creates the above files and then stops. The "run" (or "r") command creates the project files then uses Vagrant to build the VM(s).
It is possible to copy the project directory to any compatible system with Vagrant, and simply run "vagrant up" to create the VMs.
The default root password for the base-boxes is 'puppet', but this may be modified by SecGen depending on the scenario used.

Batch Processing with SecGen
Generating multiple VMs in a batch is now possible through the use of batch_secgen, which manages a job queue to mass-create VMs with SecGen. There are helper commands available to add jobs, list jobs in the table, remove jobs, and reset the status of jobs from 'running' or 'error' to 'todo'.
For details please see the Batch Creation of VMs guide.

Roadmap
  • More modules! Including more CTF-style modules.
  • Windows baseboxes and vulnerabilities.
  • More security labs with worksheets.
  • Further gamification and immersive scenarios.

Acknowledgments
Development team:
  • Dr Z. Cliffe Schreuders http://z.cliffe.schreuders.org
  • Tom Shaw
  • Jason Keighley
  • Lewis Ardern -- author of the first proof-of-concept release of SecGen
  • Connor Wilson
Many thanks to everyone who has contributed to the project. The above list is not complete or exhaustive, please refer to the GitHub history.
This project is supported by a Higher Education Academy (HEA) learning and teaching in cyber security grant (2015-2017). This project is supported by a Leeds Beckett University Teaching Excellence Fund grant (2018-2019).

Contributing
We encourage contributions to the project.
Briefly, please fork from http://github.com/cliffe/SecGen/, create a branch, make and commit your changes, then create a pull request.

Resources
Paper: Z.C. Schreuders, T. Shaw, A. Mac Muireadhaigh, and P. Staniforth, “Hackerbot: Attacker Chatbots for Randomised and Interactive Security Labs, Using SecGen and oVirt,” USENIX Workshop on Advances in Security Education (ASE'18), Baltimore, MD, USA. USENIX Association, 2018. (This paper describes Hackerbot and how we use SecGen with oVirt.)
Paper: Z.C. Schreuders, T. Shaw, M. Shan-A-Khuda, G. Ravichandran, J. Keighley, and M. Ordean, “Security Scenario Generator (SecGen): A Framework for Generating Randomly Vulnerable Rich-scenario VMs for Learning Computer Security and Hosting CTF Events,” USENIX Workshop on Advances in Security Education (ASE'17), Vancouver, BC, Canada. USENIX Association, 2017. (This paper provides a good overview of SecGen.)
Paper: Z.C. Schreuders, and L. Ardern, "Generating randomised virtualised scenarios for ethical hacking and computer security education: SecGen implementation and deployment," in The first UK Workshop on Cybersecurity Training & Education (Vibrant Workshop 2015) Liverpool, UK, 2015. (This paper describes the first prototype.)
Podcast interview: Purple Squad Security Episode 011 – Security Scenario Generator with Dr. Z. Cliffe Schreuders


Cloud-Sniper - Virtual Security Operations Center

$
0
0

Cloud Security Operations

What is Cloud Sniper?
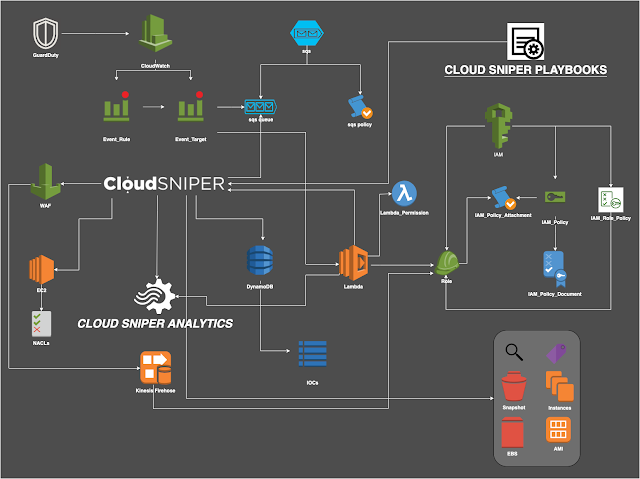
Cloud Sniper is a platform designed to manage Security Operations in cloud environments. It is an open platform which allows responding to security incidents by accurately analyzing and correlating native cloud artifacts. It is to be used as a Virtual Security Operations Center (vSOC) to detect and remediate security incidents providing a complete visibility of the company's cloud security posture.
With this platform, you will have a complete and comprehensive management of the security incidents, reducing the costs of having a group of level-1 security analysts hunting for cloud-based Indicators of Compromise (IOC). These IOCs, if not correlated, will generate difficulties in detecting complex attacks. At the same time Cloud Sniper enables advanced security analysts integrate the platform with external forensic or incident-and-response tools to provide security feeds into the platform.
The cloud-based platform is deployed automatically and provides complete and native integration with all the necessary information sources, avoiding the problem that many vendors have when deploying or collecting data.
Cloud Sniper receives cloud-based and third-parties feeds and automatically responds protecting your infrastructure and generating a knowledge database of the IOCs that are affecting your platform. This is the best way to gain visibility in environments where information can be bounded by the Shared Responsibility Model enforced by cloud providers.
To detect advanced attack techniques, which may easily be ignored, the Cloud Sniper Analytics module correlates the events generating IOCs. These will give visibility on complex artifacts to analyze, helping both to stop the attack and to analyze the attacker's TTPs.
Cloud Sniper is currently available for AWS, but it is to be extended to others cloud platforms.

Automatic infrastructure deployment (for AWS)


WIKI => HOW IT WORKS

Cloud Sniper releases
1.  Automatic Incident and Response 
1. WAF filtering
2. NACLs filtering
3. IOCs knowledge database.
4. Tactics, Techniques and Procedures (TTPs) used by the attacker
2. Security playbooks
1. NIST approach
3. Automatic security tagging
4. Cloud Sniper Analytics
1. Beaconing detection with VPC Flow Logs (C2 detection analytics)

Upcoming Features and Integrations
1.  Security playbooks for cloud-based environments
2. Security incidents centralized management for multiple accounts. Web Management UI
3. WAF analytics
4. Case management (automatic case creation)
5. IOCs enrichment and Threat Intelligence feeds
6. Automatic security reports based on well-known security standards (NIST)
7. Integration with third-party security tools (DFIR)


Scan-For-Webcams - Scan For Webcams In The Internet

$
0
0

Automatically scan for publically accessible webcams around the internet

Usage
The program will output a list of links with the format of ip_address:port
If your terminal supports links, click the link and open it in your browser, otherwise, copy the link and open it in your browser.

Installation
  1. clone&cd into the repo:
    git clone https://github.com/JettChenT/scan-for-webcams;cd scan-for-webcams
  2. install requirements:
    pip install -r requirements.txt
  3. set up shodan:
    1. go to shodan.io, register/log in and grab your API key
    2. Set environ SHODAN_API_KEY as your API key:
      export "SHODAN_API_KEY"="<your api key>"
  4. set up clarifai:
    1. go to clarifai.com, register/log in, create an application and grab your API key
    2. set environ CLARIFAI_API_KEY as your API key
      export "CLARIFAI_API_KEY"="<your api key>"
And then you can run the program!

Demo


Intel Owl - Analyze Files, Domains, IPs In Multiple Ways From A Single API At Scale

$
0
0

Do you want to get threat intelligence data about a file, an IP or a domain?
Do you want to get this kind of data from multiple sources at the same time using a single API request?
You are in the right place!
This application is built to scale out and to speed up the retrieval of threat info.
It can be integrated easily in your stack of security tools to automate common jobs usually performed, for instance, by SOC analysts manually.
Intel Owl is composed of analyzers that can be run to retrieve data from external sources (like VirusTotal or AbuseIPDB) or to generate intel from internal analyzers (like Yara or Oletools)
This solution is for everyone who needs a single point to query for info about a specific file or observable (domain, IP, URL, hash).
Main features:
  • full django-python application
  • easily and completely customizable, both the APIs and the analyzers
  • clone the project, set up the configuration and you are ready to run
  • Official frontend client: IntelOwl-ng provides features such as dashboard, visualizations of analysis data, easy to use forms for requesting new analysis, etc.

Documentation
Documentation about IntelOwl installation, usage, contribution can be found at https://intelowl.readthedocs.io/.

Blog posts
v1.0.0 Announcement
First announcement

Free Internal Modules Available
  • Static Doc Analysis
  • Static RTF Analysis
  • Static PDF Analysis
  • Static PE Analysis
  • Static Generic File Analysis
  • Strings analysis
  • PE Signature verification
Free modules that require additional configuration:
  • Cuckoo (requires at least one working Cuckoo instance)
  • MISP (requires at least one working MISP instance)
  • Yara (Community, Neo23x0, Intezer and McAfee rules are already available. There's the chance to add your own rules)

External Services Available

required paid or trial API key
  • GreyNoise v2

required paid or free API key
  • VirusTotal v2 + v3
  • HybridAnalysis
  • Intezer
  • Farsight DNSDB
  • Hunter.io - Email Hunting
  • ONYPHE
  • Censys.io
  • SecurityTrails

required free API key
  • GoogleSafeBrowsing
  • AbuseIPDB
  • Shodan
  • HoneyDB
  • AlienVault OTX
  • MaxMind
  • Auth0

needed access request
  • CIRCL PassiveDNS + PassiveSSL

without api key
  • Fortiguard URL Analyzer
  • GreyNoise Alpha API v1
  • Talos Reputation
  • Tor Project
  • Robtex
  • Threatminer
  • Abuse.ch MalwareBazaar
  • Abuse.ch URLhaus
  • Team Cymru Malware Hash Registry
  • Tranco Rank
  • Google DoH
  • CloudFlare DoH Classic
  • CloudFlare DoH Malware
  • Classic DNS resolution

Legal notice
You as a user of this project must review, accept and comply with the license terms of each downloaded/installed package listed below. By proceeding with the installation, you are accepting the license terms of each package, and acknowledging that your use of each package will be subject to its respective license terms.
osslsigncode, stringsifter, peepdf, oletools, MaxMind-DB-Reader-python, pysafebrowsing, PyMISP, OTX-Python-SDK, yara-python, GitPython, Yara community rules, Neo23x0 Yara sigs, Intezer Yara sigs, McAfee Yara sigs

Google Summer Of Code
The project was accepted to the GSoC 2020 under the Honeynet Project!!
Stay tuned for upcoming new features developed by Eshaan Bansal (Twitter).

About the author
Feel free to contact the author at any time: Matteo Lodi (Twitter)
We also have a dedicated twitter account for the project: @intel_owl.


Pyre-Check - Performant Type-Checking For Python

$
0
0

Pyre is a performant type checker for Python compliant with PEP 484. Pyre can analyze codebases with millions of lines of code incrementally – providing instantaneous feedback to developers as they write code.
Pyre ships with Pysa, a security focused static analysis tool we've built on top of Pyre that reasons about data flows in Python applications. Please refer to our documentation to get started with our security analysis.

Requirements
To get started, you need Python 3.6 or later and watchman working on your system. On MacOS you can get everything with homebrew:
$ brew install python3 watchman
On Ubuntu, Mint, or Debian; use apt-get:
$ sudo apt-get install python3 python3-pip watchman
We tested Pyre on Ubuntu 16.04 LTS, CentOS 7, as well as OSX 10.11 and later.

Setting up a Project
We start by creating an empty project directory and setting up a virtual environment:
$ mkdir my_project && cd my_project
$ python3 -m venv ~/.venvs/venv
$ source ~/.venvs/venv/bin/activate
(venv) $ pip install pyre-check
Next, we teach Pyre about our new project:
(venv) $ pyre init
This command will set up a configuration for Pyre (.pyre_configuration) as well as watchman (.watchmanconfig) in your project's directory. Accept the defaults for now – you can change them later if necessary.

Running Pyre
We are now ready to run Pyre:
(venv) $ echo "i: int = 'string'" > test.py
(venv) $ pyre
Æ› Found 1 type error!
test.py:1:0 Incompatible variable type [9]: i is declared to have type `int` but is used as type `str`.
This first invocation will start a daemon listening for filesystem changes – type checking your project incrementally as you make edits to the code. You will notice that subsequent invocations of pyre will be faster than the first one.
For more detailed documentation, see https://pyre-check.org.


Parth - Heuristic Vulnerable Parameter Scanner

$
0
0

Some HTTP parameter names are more commonly associated with one functionality than the others. For example, the parameter ?url= usually contains URLs as the value and hence often falls victim to file inclusion, open redirect and SSRF attacks. Parth can go through your burp history, a list of URLs or it's own disocovered URLs to find such parameter names and the risks commonly associated with them. Parth is designed to aid web security testing by helping in prioritization of components for testing.

Usage

Import targets from a file
This option works for all 3 supported import types: Burp Suite history, newline delimited text file or a HTTP request text file.
python3 parth.py -i example.history

Find URLs for a domain
This option will make use of CommonCrawl, Open Threat Exchange and Waybackmachine to find URLs of the target domain.
python3 parth.py -t example.com

Ignore duplicate parameter names
Same parameter names across all URLs are ignored.
python3 parth.py -ut example.com

Save parameter names
This option will write all the parameter names found in a file with name params-{target}.txt for later use.
python3 parth.py -pt example.com

JSON Output
The following command will save the result as a JSON object in the specified file.
python3 parth.py -t example.com -o example.json

Credits
The database of parameter names and the risks associated with them is mainly created from the public work of various people of the community.


Yeti - Your Everyday Threat Intelligence

$
0
0

Yeti is a platform meant to organize observables, indicators of compromise, TTPs, and knowledge on threats in a single, unified repository. Yeti will also automatically enrich observables (e.g. resolve domains, geolocate IPs) so that you don't have to. Yeti provides an interface for humans (shiny Bootstrap-based UI) and one for machines (web API) so that your other tools can talk nicely to it.
Yeti was born out of frustration of having to answer the question "where have I seen this artifact before?" or Googling shady domains to tie them to a malware family.
In a nutshell, Yeti allows you to:
  • Submit observables and get a pretty good guess on the nature of the threat.
  • Inversely, focus on a threat and quickly list all TTPs, Observables, and associated malware.
  • Let responders skip the "Google the artifact" stage of incident response.
  • Let analysts focus on adding intelligence rather than worrying about machine-readable export formats.
  • Visualize relationship graphs between different threats.
This is done by:
  • Collecting and processing observables from a wide array of different sources (MISP instances, malware trackers, XML feeds, JSON feeds...)
  • Providing a web API to automate queries (think incident management platform) and enrichment (think malware sandbox).
  • Export the data in user-defined formats so that they can be ingested by third-party applications (think blocklists, SIEM).

Installation
There's are a few handy bootstrap scripts in /extras that you can use to install a production instance of Yeti.
If you're really in a hurry, you can curl | bash them.
$ curl https://raw.githubusercontent.com/yeti-platform/yeti/master/extras/ubuntu_bootstrap.sh | sudo /bin/bash
Please refer to the full documentation for more detailed steps.

Docker images
Yeti has a docker-compose script to get up and running even faster; this is useful for testing or even running production instances of Yeti should your infrastructure support it. Full instructions here, but in a nutshell:
$ git clone https://github.com/yeti-platform/yeti.git
$ cd yeti/extras/docker/dev
$ docker-compose up

Useful links


AWS Recon - Multi-threaded AWS Inventory Collection Tool With A Focus On Security-Relevant Resources And Metadata

$
0
0

A multi-threaded AWS inventory collection tool.
The creators of this tool have a recurring need to be able to efficiently collect a large amount of AWS resource attributes and metadata to help clients understand their cloud security posture.
There are a handful of tools (e.g. AWS Config, CloudMapper, CloudSploit, Prowler) that do some form of resource collection to support other functions. But we found we needed broader coverage and more details at a per-service level. We also needed a consistent and structured format that allowed for integration with our other systems and tooling.
Enter AWS Recon, multi-threaded AWS inventory collection tool written in plain Ruby. Though most AWS tooling tends to be dominated by Python, the Ruby SDK is quite mature and capable. The maintainers of the Ruby SDK have done a fantastic job making it easy to handle automatic retries, paging of large responses, and threading huge numbers of requests.

Project Goals
  • More complete resource coverage than available tools (especially for ECS & EKS)
  • More granular resource detail, including nested related resources in the output
  • Flexible output (console, JSON lines, plain JSON, file, standard out)
  • Efficient (multi-threaded, rate limited, automatic retries, and automatic result paging)
  • Easy to maintain and extend

Setup

Requirements
Ruby 2.5.x or 2.6.x (developed and tested with 2.6.5)

Installation
Install the gem:
$ gem install aws_recon
Fetching aws_recon-0.2.2.gem
Fetching aws-sdk-resources-3.76.0.gem
Fetching aws-sdk-3.0.1.gem
Fetching parallel-1.19.2.gem
...
Successfully installed aws-sdk-3.0.1
Successfully installed parallel-1.19.2
Successfully installed aws_recon-0.2.2
Or add it to your Gemfile using bundle:
$ bundle add aws_recon
Fetching gem metadata from https://rubygems.org/
Resolving dependencies...
...
Using aws-sdk 3.0.1
Using parallel 1.19.2
Using aws_recon 0.2.2

Usage
AWS Recon will leverage any AWS credentials currently available to the environment it runs in. If you are collecting from multiple accounts, you may want to leverage something like aws-vault to manage different credentials.
$ aws-vault exec profile -- aws_recon
Plain environment variables will work fine too.
$ AWS_PROFILE=<profile> aws_recon
You may want to use the -v or --verbose flag initially to see status and activity while collection is running.
In verbose mode, the console output will show:
<thread>.<region>.<service>.<operation>
The t prefix indicates which thread a particular request is running under. Region, service, and operation indicate which request operation is currently in progress and where.
$ aws_recon -v

t0.global.EC2.describe_account_attributes
t2.global.S3.list_buckets
t3.global.Support.describe_trusted_advisor_checks
t2.global.S3.list_buckets.acl
t5.ap-southeast-1.WorkSpaces.describe_workspaces
t6.ap-northeast-1.Lightsail.get_instances
...
t2.us-west-2.WorkSpaces.describe_workspaces
t1.us-east-2.Lightsail.get_instances
t4.ap-southeast-1.Firehose.list_delivery_streams
t7.ap-southeast-1.Lightsail.get_instances
t0.ap-south-1.Lightsail.get_instances
t1.us-east-2.Lightsail.get_load_balancers
t7.ap-southeast-2.WorkSpaces.describe_workspaces
t2.eu-west-3.SageMaker.list_notebook_instances
t3.eu-west-2.SageMaker.list_notebook_instances

Finished in 46 seconds. Saving resources to output.json.

Example command line options
$ AWS_PROFILE=<profile> aws_recon -s S3,EC2 -r global,us-east-1,us-east-2
$ AWS_PROFILE=<profile> aws_recon --services S3,EC2 --regions global,us-east-1,us-east-2

Errors
An exception will be raised on AccessDeniedException errors. This typically means your user/role doesn't have the necessary permissions to get/list/describe for that service. These exceptions are raised so troubleshooting access issues is easier.
Traceback (most recent call last):
arn:aws:sts::1234567890:assumed-role/role/9876543210 is not authorized to perform: codepipeline:GetPipeline on resource: arn:aws:codepipeline:us-west-2:876543210123:pipeline (Aws::CodePipeline::Errors::AccessDeniedException)
The exact API operation that triggered the exception is indicated on the last line of the stack trace. If you can't resolve the necessary access, you should exclude those services with -x or --not-services so the collection can continue.

Threads
AWS Recon uses multiple threads to try to overcome some of the I/O challenges of performing many API calls to endpoints all over the world.
For global services like IAM, Shield, and Support, requests are not multi-threaded. The S3 module is multi-threaded since each bucket requires several additional calls to collect complete metadata.
For regional services, a thread (up to the thread limit) is spawned for each service in a region. By default, up to 8 threads will be used. If your account has resources spread across many regions, you may see a speed improvement by increasing threads with -t X, where X is the number of threads.

Options
Most users will want to limit collection to relevant services and regions. Running without any options will attempt to collect all resources from all 16 regular regions.
$ aws_recon -h

AWS Recon - AWS Inventory Collector

Usage: aws_recon [options]
-r, --regions [REGIONS] Regions to scan, separated by comma (default: all)
-n, --not-regions [REGIONS] Regions to skip, separated by comma (default: none)
-s, --services [SERVICES] Services to scan, separated by comma (default: all)
-x, --not-services [SERVICES] Services to skip, separated by comma (default: none)
-c, --config [CONFIG] Specify config file for services & regions (e.g. config.yaml)
-o, --output [OUTPUT] Specify output file (default: output.json)
-f, --format [FORMAT] Specify output format (default: aws)
-t, --threads [THREADS] Specify max threads (default: 8, max: 128)
-z, --skip-slow Skip slow operations (default: false)
-j, --stream-output Stream JSON lines to stdout (default: false) -v, --verbose Output client progress and current operation
-d, --debug Output debug with wire trace info
-h, --help Print this help information

Output
Output is always some form of JSON - either JSON lines or plain JSON. The output is either written to a file (the default), or written to stdout (with -j).

Supported Services & Resources
Current "coverage" by service is listed below. The services without coverage will eventually be added. PRs are certainly welcome. :)
AWS Recon aims to collect all resources and metadata that are relevant in determining the security posture of your AWS account(s). However, it does not actually examine the resources for security posture - that is the job of other tools that take the output of AWS Recon as input.
  • AdvancedShield
  • Athena
  • GuardDuty
  • Macie
  • Systems Manager
  • Trusted Advisor
  • ACM
  • API Gateway
  • AutoScaling
  • CodePipeline
  • CodeBuild
  • CloudFormation
  • CloudFront
  • CloudWatch
  • CloudWatch Logs
  • CloudTrail
  • Config
  • DirectoryService
  • DirectConnect
  • DMS
  • DynamoDB
  • EC2
  • ECR
  • ECS
  • EFS
  • ELB
  • EKS
  • Elasticsearch
  • Firehose
  • FMS
  • Glacier
  • IAM
  • KMS
  • Kafka
  • Kinesis
  • Lambda
  • Lightsail
  • Organizations
  • RDS
  • Redshift
  • Route53
  • Route53Domains
  • S3
  • SageMaker
  • SES
  • ServiceQuotas
  • Shield
  • SNS
  • SQS
  • Transfer
  • VPC
  • WAF
  • WAFv2
  • Workspaces
  • Xray

Additional Coverage
One of the primary motivations for AWS Recon was to build a tool that is easy to maintain and extend. If you feel like coverage could be improved for a particular service, we would welcome PRs to that effect. Anyone with a moderate familiarity with Ruby will be able to mimic the pattern used by the existing collectors to query a specific service and add the results to the resource collection.

Development
Clone this repository:
$ git clone git@github.com:darkbitio/aws-recon.git
$ cd aws-recon
Create a sticky gemset if using RVM:
$ rvm use 2.6.5@aws_recon_dev --create --ruby-version
Run bin/setup to install dependencies. Then, run rake test to run the tests. You can also run bin/console for an interactive prompt that will allow you to experiment.
To install this gem onto your local machine, run bundle exec rake install. To release a new version, update the version number in version.rb, and then run bundle exec rake release, which will create a git tag for the version, push git commits and tags, and push the .gem file to rubygems.org.

TODO
  • Optionally suppress AWS API errors instead of re-raising them
  • Package as a gem
  • Test coverage with AWS SDK stubbed resources

Kudos
AWS Recon was inspired by the excellent work of the people and teams behind these tools:


VolExp - Volatility Explorer

$
0
0

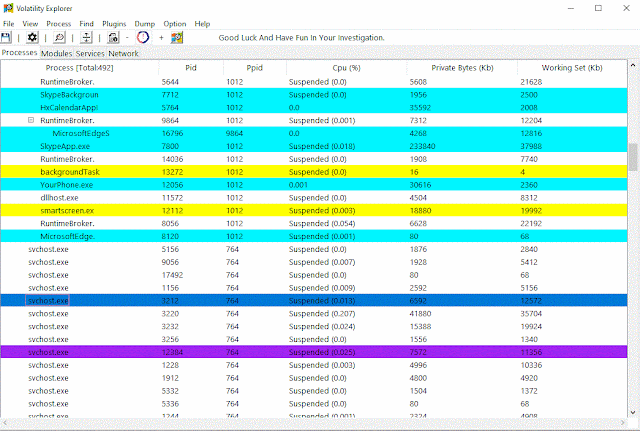
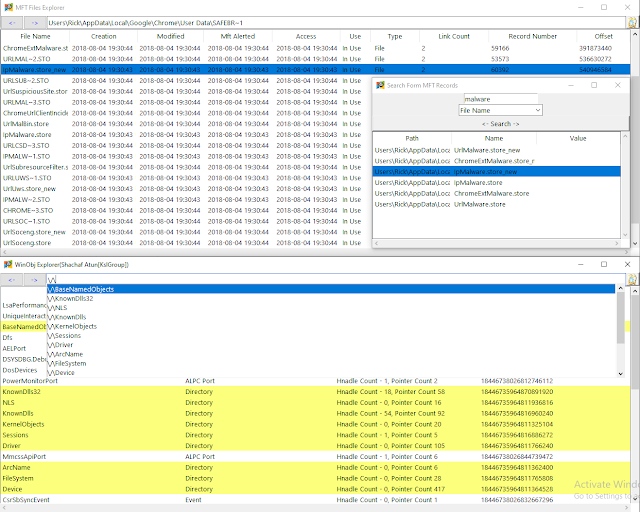
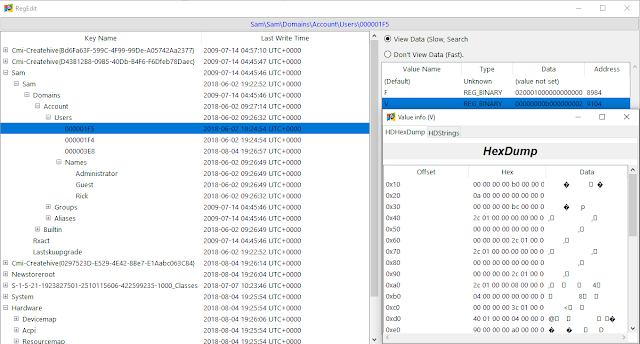
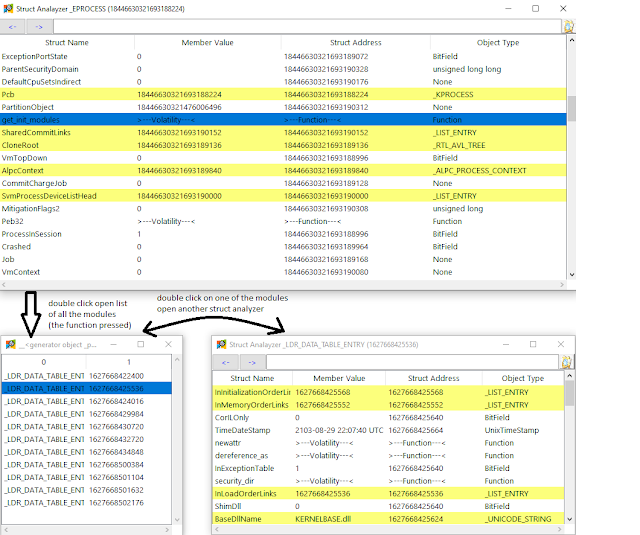
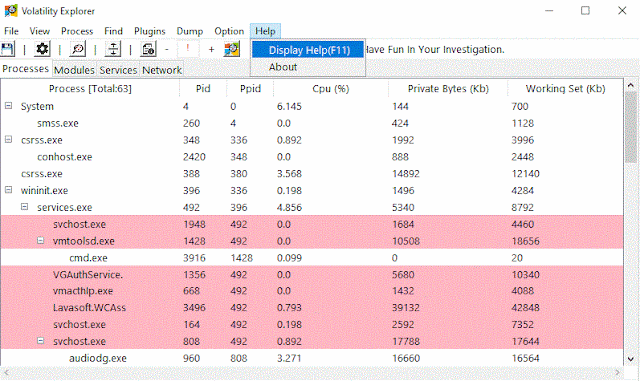
This program allows the user to access a Memory Dump. It can also function as a plugin to the Volatility Framework (https://github.com/volatilityfoundation/volatility). This program functions similarly to Process Explorer/Hacker, but additionally it allows the user access to a Memory Dump (or access the real-time memory on the computer using Memtriage). This program can run from Windows, Linux and MacOS machines, but can only use Windows memory images.

Quick Start
  1. Download the volexp.py file (download the memtriage.py file as well and replace it with your memtriage.py file if you want to use memtriage https://github.com/gleeda/memtriage).
  2. Run as a standalone program or as a plugin to Volatility:
  • As a standalone program:
 python2 volexp
 python2 vol.py -f <memory file path> --profile=<memory profile> volexp

Some Features:
python2 memtriage.py --plugins=volexp
  • Some of the information display will not update in real time (except Processes info(update slowly), real time functions like struct analyzer, PE properties, run real time plugin, etc.).
  • The program also allows to view Loaded dll's, open handles and network connections of each process (Access to a dll's properties is also optional).
  • To present more information of a process, Double-Click (or Left-Click and select Properties) to bring up an information window.
  • Or present more information on any PE.
  • The program allows the user to view the files in the Memory Dump as well as their information. Additionally, it allows the user to extract those files (HexDump/strings view is also optional).
  • The program supports viewing of the Windows Objects and files's matadata (MFT).
  • The program also support viewing a regview of the memory dump
  • Additionally, the program supports struct analysis. (writing on the memory's struct, running Volatility functions on a struct is available). Example of getting all the load modules inside _EPROCESS struct in another struct analyzer window:
  • The Program is also capable of automatically marking suspicious processes found by another plugin. Example of a running threadmap plugin:
  • View memory use of a process.
  • Manually marking a certain process and adding a sidenote on it.
  • User's actions can be saved on a seperate file for later usage.

get help: https://github.com/memoryforensics1/VolExp/wiki/VolExp-help:


ezEmu - Simple Execution Of Commands For Defensive Tuning/Research

$
0
0

ezEmu enables users to test adversary behaviors via various execution techniques. Sort of like an "offensive framework for blue teamers", ezEmu does not have any networking/C2 capabilities and rather focuses on creating local test telemetry.

Windows
See /Linux for ELF
ezEmu is compiled as parent.exe to simplify process trees, and will track (and also kill) child processes to enable easy searches in logs/dashboards.
Current execution techniques include:
  • Cmd.exe (T1059.003)
  • PowerShell (T1059.001)
  • Unmanaged PowerShell (T1059.001)
  • CreateProcess() API (T1106)
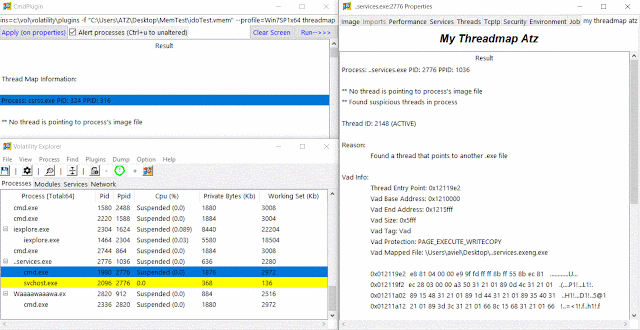
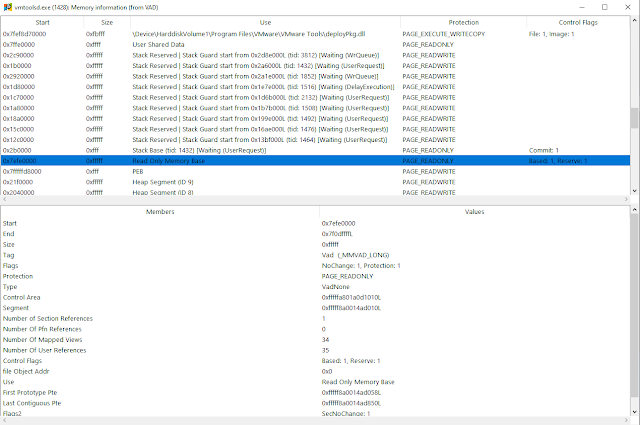
  • WinExec() API (T1106)
  • ShellExecute (T1106)
  • Windows ManagementInstrumentation (T1047)
  • VBScript (T1059.005)
  • Windows Fiber
  • WMIC XSL Script/Squiblytwo (T1220)
  • Microsoft Word VBA Macro (T1059)
  • Python (T1059.006)
Note: You need to enable some macro related trust center settings for the Word stuffz to work - https://support.office.com/en-us/article/enable-or-disable-macros-in-office-files-12b036fd-d140-4e74-b45e-16fed1a7e5c6. You also need Python installed and the PATH variable set for #12

Usage/Demo
ezEmu is an interactive terminal application and works much better if you run from cmd.exe


Compile with reference to a few local DLL dependencies
(ex: csc /r:Microsoft.Office.Interop.Word.dll,Microsoft.Vbe.Interop.dll,System.Management.Automation.dll parent.cs)

Feedback/Contribute
This started as just simple personal research/putzing and is definitely not intended to be "clean code" (this is very much Jamie-code™️). That said, I am happy to accept issues and further suggestions!
TODO: Log output file (perhaps), more CTI + learning >> more execution techniques (always)

Notice
Copyright 2020 The MITRE Corporation
Approved for Public Release; Distribution Unlimited. Case Number 20-1357.
Licensed under the Apache License, Version 2.0 (the "License"); you may not use this file except in compliance with the License. You may obtain a copy of the License at
http://www.apache.org/licenses/LICENSE-2.0
Unless required by applicable law or agreed to in writing, software distributed under the License is distributed on an "AS IS" BASIS, WITHOUT WARRANTIES OR CONDITIONS OF ANY KIND, either express or implied. See the License for the specific language governing permissions and limitations under the License.
The author's affiliation with The MITRE Corporation is provided for identification purposes only, and is not intended to convey or imply MITRE's concurrence with, or support for, the positions, opinions or view points expressed by the author.


Hack-Tools - The All-In-One Red Team Extension For Web Pentester

$
0
0

The all-in-one Red Team browser extension for Web Pentesters
HackTools, is a web extension facilitating your web application penetration tests, it includes cheat sheets as well as all the tools used during a test such as XSS payloads, Reverse shells and much more.
With the extension you no longer need to search for payloads in different websites or in your local storage space, most of the tools are accessible in one click. HackTools is accessible either in pop up mode or in a whole tab in the Devtools part of the browser with F12.

Current functions:
  • Dynamic Reverse Shell generator (PHP, Bash, Ruby, Python, Perl, Netcat)
  • Shell Spawning (TTY Shell Spawning)
  • XSS Payloads
  • Basic SQLi payloads
  • Local file inclusion payloads (LFI)
  • Base64 Encoder / Decoder
  • Hash Generator (MD5, SHA1, SHA256, SHA512)
  • Useful Linux commands (Port Forwarding, SUID)

Preview


Install the application

Chromium based browser
All the available releases are here..
Otherwise, if you want to build the project yourself from the source code

Mozilla Firefox
You can download HackTools on the Firefox browser add-onshere.

Build from source code
yarn install && yarn build
Once the build is done correctly, webpack will create a new folder called dist
After that you need to go to the extension tab on your chrome based navigator and turn on the

developer mode

Then click on the load unpacked button in the top left corner

Once you clicked on the button you just need to select the dist folder and that's it !

Authors
Ludovic COULON & Riadh BOUCHAHOUA


Viewing all 5816 articles
Browse latest View live


<script src="https://jsc.adskeeper.com/r/s/rssing.com.1596347.js" async> </script>